


CIC Consilium Investment Committee Research and Due Diligence Yearbook Vol 4, 2022 Yearbook

To the greatest extent possible, we utilise evidence when considering risk factor premia, calculating expected returns, building model portfolios, and monitoring and reporting on fund and portfolio returns.
In the short term, investment markets rarely operate in a way that is consistent with long term averages or expectations. Constant media noise, unexpected events, macro-economic issues and geo-political risks all feed into short term investor sentiment and behaviour. And, when the raw investor emotions take over, they often have a disproportionate influence over short term decision making.
When uncertainties are mounting, investors are at greater risk of doing something they might regret if there is no evidence at the core of their investment strategy, or a qualified adviser to help guide them. As the oft-quoted saying goes “If you don’t know where you are going, any road will get you there” and, without evidence acting as a counterbalance to high emotion, investors sometimes decide that doing ‘something’ is justified.
Unfortunately, these are often the moments, in hindsight, that took investors away from their plan and further away from achieving their investment goals.
Over the long term, these uncomfortable moments all fade in importance and investors are left to consider the consequences of the road they ultimately chose to take. Evidence provides both the roadmap and the driving instructions that allow investors to make the best decisions they can in pursuit of their ultimate destination.
To help you keep your clients on track through these volatile times, the CIC continues to produce and deliver a wide range of materials for you to use and share with your clients.
This includes preparing articles and information for inclusion in quarterly client commentaries, quarterly returns analyses, adviser call presentations, enhanced due diligence reports, annually updating the approved products list and contributing to white papers and client focused investment articles.
There is always a focus on the depth of portfolio monitoring and review work that is undertaken by the committee on a quarterly basis. The 2022 CIC Yearbook captures this by including much of the detailed monitoring and enhanced due diligence reporting that was completed on your behalf throughout the year.
If you have clients, prospects or regulators wanting to verify exactly what monitoring and reporting functions were undertaken over the last 12 months on the portfolios you recommend, the CIC Yearbook is an excellent resource.
Our aim is for this CIC Yearbook to give you finger-tip access to the many ways we seek to support your efforts to deliver the highest quality investment advice.
We hope this fourth edition of the CIC Yearbook becomes a convenient resource for you to access this information and becomes a valuable addition to your office library.
An overview of Consilium Investment Committee primary functions, current members and schedule of responsibilities.
Regular portfolio benchmarking and monitoring materials, including portfolio returns vs benchmarking analysis, monitoring review, quarterly review, key market movements and economic commentary extract for the quarter.
Enhanced due diligence reports.
Investment related articles published during 2022.
An overview of Consilium Investment Committee primary functions, current members and schedule of responsibilities

Members of the Committee are appointed by the Consilium Executive Management Team for a period of 12 months and may be considered for re-election annually thereafter. The current members of the Consilium Investment Committee (CIC) are:
Damon is a CFA Charterholder with over 23 years’ experience in the wealth management industry, primarily specialising in asset allocation, investment research and portfolio management. His additional qualifications include completing a degree in Commerce from Canterbury University, a Post Graduate Diploma in Business Studies (in Personal Financial Planning)
Damon is a Chartered Financial Analyst (CFA® charterholder), a member of the New Zealand CFA Society and a member of the New Zealand Institute of Directors.

Professor Ben Marshall serves on the editorial board of a number of journals and has consulted to public and private companies in a range of different areas. He holds the MSA Charitable Trust Chair in Finance at Massey University.

Professor Marshall has undertaken research in areas such as the impact of climate on financial markets, factors that influence stock returns, quantitative approaches to portfolio management, transaction cost and illiquidity measurement, and exchange traded funds.
His research has been published in leading international journals and he is a regular speaker at international finance conferences. Professor Marshall is currently ranked in the top 1% of authors based on downloads of his working papers. Professor Marshall has a particular focus on governance, analytical support and policy review.

Mitchell is a CFA Charterholder with over 15 years’ experience as a senior quantitativeanalyst and risk manager for two fund of hedge fund businesses in Hong Kong.
Mitchell has primary responsibility in areas of investment analysis, performance monitoring, supplementary fund due diligence, asset allocation and research.
Mitchell holds a Bachelor of Science (majoring in Statistics) and a Bachelor of Commerce (majoring in Management Science) from the University of Canterbury.

Lydia has been working for Consilium for over 5 years with the primary focus of her role including monitoring the model portfolio’s performance, risk and attribution, and assisting with strategic asset allocation and RFP.
Before working at Consilium, Lydia was in the managerial roles in products and services firms. In this role, Lydia was involved product development, planning, decision making and communication with internal and external sources.
Lydia has a Bachelor of Commerce majoring in Operations Research and a Master’s degree in Applied Finance and Economics from the University of Canterbury. Lydia is a candidate in the CFA® program and is bound by the CFA Institute’s Code of Ethics and Standards of Professional Conduct.
Ben is Head of Advice and has been with Consilium since the foundation of the business. Ben is responsible for Consilium Partner Services and business development, and sits on the Consilium Investment Committee.
Ben is an Accredited Investment Fiduciary (AIF) and has a degree in both History and Economics from the University of California. In 2010, he passed the United States Certified Financial Planner exam.
Ben has over 20 years’ experience in financial services, undertaking roles such as economist for the Qatar Economic Free Zones as well as senior executive roles within a large US financial advisory firm

The following table summarises the current responsibilities of the Consilium Investment Committee (CIC):
Performance monitoring
Quarterly governance
Communication/ record keeping
Research and process oversight
KiwiSaver review
Peer group review
Approved products list
Provide quarterly review of performance of each CIC approved asset and conduct further investigation as required
Independent oversight of quarterly review commentary and actions
Maintain records of all decisions and communicate to internal stakeholders or partner firms
Process enhancement recommendations and independent review of all research projects undertaken by the CIC to ensure consistency with stated policy and procedures
Annual review of recommended KiwiSaver providers in line with CIC philosophy
Annual review of Consilium Portfolios performance relative to KiwiSaver peer group
Annual update of list of Investment products approved for investment by CIC
Mid cycle SAA review Expected return update CIC portfolios
Manager review Qualitative review of investment managers and pricing
Strategic asset allocation (SAA) Review SAA every 3 years
Quarterly
Quarterly
Ongoing
Ongoing
Sep 2023
Dec 2023
Dec 2023
Dec 2024
Jun 2025
Dec 2025
Regular portfolio benchmarking and monitoring materials, including portfolio returns vs benchmarking analysis, monitoring review, quarterly review, economic commentary extract, and key market movements.
2022, Q1 (Jan 2022 – Mar 2022)
2022, Q2 (Apr 2022 – Jun 2022)
2022, Q3 (Jul 2022 – Sept 2022)
2022, Q4 (Oct 2022 – Dec 2022)
January – March 2022
P1 Market commentary
P4 Key market movements for the quarter
P7 Inflation is here, that’s why you own shares.
Headlines were dominated by the horrific war in Ukraine and the terrible humanitarian crisis continuing to unfold there. In pursuing this conflict, Vladimir Putin has surely etched his name amongst history’s most reviled.
The grave implications of the Ukraine conflict quickly fed through into increasingly volatile financial markets, with share markets declining and bond prices also generally falling over the quarter.
On the other hand, commodity prices soared. Russia is a key producer of several important commodities including oil and gas. Ukraine is an agricultural powerhouse and a significant global exporter of wheat, corn and sunflower oil. With the conflict impacting supplies from both countries, this magnified existing supply chain disruptions and added further unwanted impetus to surging global inflation.
Elsewhere, the Chinese market was negatively affected by renewed Covid-19 outbreaks in the region, leading to new lockdowns in several major Chinese cities.
Market turbulence, as unpleasant as it is, will eventually ease. In fact, to the extent that lower share prices now imply a higher expected return for owning shares, current market prices could eventually be regarded as a buying signal for longer-term investors.
Whatever the markets may have in store for us in the coming months, heightened market volatility looks set to continue for some time to come.

While it was undoubtedly a tough period for investors, this financial turbulence paled in significance when compared to the devastation and heartbreak being experienced by the Ukraine people, and by their friends, families and loved ones around the world.
Inflation has risen sharply over recent months and what was initially projected to be a transitory phenomenon has become much more widespread and persistent. Disturbingly, there are even signs that the recent acceleration in rising prices is increasingly being seen as the new norm.
That represents a real dilemma for policymakers. With inflation already much higher than forecast, central banks (including the Reserve Bank of New Zealand) have been backed into a corner and are now having to prioritise policy measures aimed at containing inflation. The primary tool at their disposal to achieve this is to raise interest rates.
The repercussions of this are already apparent in New Zealand with the Official Cash Rate (OCR) here having been raised three times (by a total of 0.75%) since 6 October 2021. With domestic interest rates already on the rise, and debt servicing costs rising along with them, this exacerbates the cost-of-living challenges already faced by many New Zealand families.
Market turbulence, as unpleasant as it is, will eventually ease.
And, in a world still trying to consolidate after the last two Covid-impacted years, the immediate outlook for economic growth suddenly looks more fragile. Whilst this adds to uncertainties in the short term, investors should still be comforted that capitalism has a way of figuring out how to survive and thrive, even in challenging environments.
We can further be comforted in the fact that markets react significantly faster than economic indicators. The fall in share prices we saw during the most recent volatile period is a result of market participants demanding a lower price for the known risks involved in these investments. This uncertainty and bad news have already been priced in and as we ease through this difficult period, we can - as long as we don’t see any further surprises - expect our investments to deliver positive returns even if the economy is somewhat subdued.
After more than two decades of successfully implementing monetary policy to carefully manage inflation expectations within a low and narrow band, central banks are now being compelled to act to ensure that inflation expectations don’t suddenly become unanchored.
However, this action is likely to have negative implications for economic activity. Central banks have become more determined to remove economic stimulus in recent weeks. In spite of acknowledging the many uncertainties within the economic outlook, including the Russian invasion, and the impact that tighter policy settings will inevitably have on growth, inflation has simply become too high for comfort.

The European Central Bank surprised markets during the quarter by presenting plans for a faster-than-expected reduction in their bond buying programme.
Their policy response suggested their concerns about inflation prevailed over all other considerations, including the war in Ukraine, and the deteriorating outlook for economic growth.
The New Zealand situation is particularly acute. With inflation expectations now above the Reserve Bank’s 1% to 3% target band and inflation itself still yet to peak, the bank is expected to progressively move the OCR to almost 3.5%; potentially using 0.5 percentage point increments in at least one of the next two meetings. Unfortunately, if delivered completely, this could be akin to slamming the economic brakes on.

Consumer and business confidence is already at rock bottom. Household cashflow is being reduced by negative real wage growth, high inflation, and the sharp rise in mortgage rates. New Zealand house prices have become ‘wobbly’ over the past three months and salesto-listings data suggests a period of housing market weakness could lie ahead. Taken together, these factors make a compelling counter argument for why the Reserve Bank’s projected tightening cycle may not be able to be delivered completely, but for now this is the outlook being anticipated by the markets.
Beyond the immense human suffering, the war in Ukraine and the sanctions imposed on Russia create broader issues related to global food production and supply.

At one end of the spectrum are countries with a significant dependency on essential commodities (including mineral products, chemicals, metals and soft commodities) that were imported from Russia and Ukraine.
At the opposite end, there are countries, many of them emerging markets, that could potentially position themselves to fill this gap by exporting more at higher prices.
Whilst this adds to uncertainties in the short term, investors should still be comforted that capitalism has a way of figuring out how to survive and thrive, even in challenging environments.
Food prices and food availability will increasingly be a global economic and political issue.
For example, the expected decrease in food production due to reduced spring plantings in Ukraine quickly lifted global wheat prices by over 15% since the start of the war. Higher grain prices will have a disproportionate impact on low-income countries, particularly some countries in Africa, and even India, where spending on food makes up a relatively high proportion of their income. Pressure will mount on these countries to either find alternate sources of supply or to ramp up their domestic production.
But, as Russia and Ukraine had been significant suppliers of fertilizer to the world, ramping up production, even by other agricultural powerhouses, may be easier said than done. For example, Brazil, which is currently the leading exporter of soybeans, corn, sugar, meat and coffee, imports about 80-85% of its fertilizer needs, with almost a third of this coming from Russia, Belarus and Ukraine. Whilst Brazil is now launching a national fertilizer plan to reduce its dependency on fertilizer imports, this will likely take several years to make a significant difference.
And even if other regions recognise an opportunity to step up their own food production in an effort to fill the void, it can take considerable time to plan, sow, grow and harvest meaningful replacement crops. Quickly replacing the 40 million metric ton supply of Ukrainian wheat would be an astronomical feat.
Maintain perspective and stay patient.
Uncertainty is a constant. We don’t know what the weather will be next week, and we certainly don’t know what might happen to change the current conflict in Ukraine, global travel and trade, supply chain pressures, concerns about inflation or the ongoing evolution of Covid-19. But we do know that all of these unknowns are factored into market prices.
And even though we may not know when or how, history tells us categorically that conflicts always end, pandemics run their course, consumerism and trade generally flourish (on average), and inflation is more commonly able to be controlled within targeted ranges. We don’t see anything in the world to suggest that this time is any different.
In fact, if we took the Ukraine conflict out of the picture, we would have been looking at a world that was beginning to emerge from the Covid shadow, in which travel and trade were picking, up and people and businesses were making longer term spending and investment plans again. All of this will return, even if Vladimir Putin may have pushed the delivery date out a little.
While the returns this quarter have been poor, they (thankfully) bear no relation to the returns of the comparable quarter in March 2020 when Covid first arrived in the world.
It’s useful to look back at that time because the best strategy then was the same as it is today – ‘don’t panic and stick to your plan’.
We can quickly see the outcome of that approach from the table below:
The third column shows how three key market indices performed (in total returns in their local currencies) during that awful first quarter in 2020. Sadly, a number of unadvised investors unfortunately exited the markets at this point.
The fourth column shows the performance of those same indexes over a longer period (note: this longer period includes both the dismal returns in the first three months of 2020 and the poor returns in the recent quarter).
Holding on to your investments through these periods of heightened market volatility wouldn’t have felt like much fun, but the overall outcome was well worth the effort.
If history is any guide, that’s a conversation we will be having with you again in the future.

We don’t see anything in the world to suggest that this time is any different.
With the prospect of US interest rate hikes and simmering tensions at the Russia/Ukraine border, there were few places for investors to hide in January, as bond yields spiked and share markets waned. Growth-tilted sectors such as information technology and consumer discretionary bore the brunt of the pain, while the energy sector generally performed strongly.
Following Russia’s invasion of Ukraine in late February, investors became increasingly concerned. Markets tumbled as investors reassessed the potential economic impact of sanctions on Russia and on further supply chain upheavals.
With this adding further fuel to a developing global inflation problem, bond yields rose markedly over the quarter as central banks quickly signalled their intention to not let inflation expectations get out of control.
Unfortunately, with equity markets generally falling and bond yields rising (meaning falling bond prices), the first quarter of 2022 was a challenging environment.
Russia’s invasion drew widespread condemnation and elicited significant economic sanctions from democratic nations. This amplified existing concerns over inflation pressures, particularly in energy and food products.
-4.9% (hedged to NZD)
-6.5% (unhedged)
In the USA, the flagship S&P 500 Index (total returns in USD) declined -4.6% in spite of US economic data otherwise remaining relatively stable and unemployment reducing to a low 3.6%.
Eurozone shares fell more sharply. The region has closer economic ties with both Ukraine and Russia, particularly when it comes to a reliance on Russian oil and gas. Worries over consumer spending led to declines for retailers, while the conflict also exacerbated supply chain disruptions by stifling the availability of a wide range of parts. This impacted the information technology sector in particular.
UK equities were more resilient as investors began to price in the additional inflationary shock of the Russian invasion. Large cap equities tracked by the FTSE 100 index even managed a small gain over the quarter, driven by the oil, mining, healthcare and banking sectors.
In New Zealand dollar terms, the MSCI World ex-Australia Index delivered a quarterly return of -4.9% on a hedged basis and -6.5% unhedged. This meant the rolling 12 month return for the New Zealand dollar hedged index is still a healthy +11.3% while the unhedged index has gained +10.9%.
Source: MSCI World ex-Australia Index (net div.)
-8.0%
Emerging market equities were firmly down in the first quarter as geopolitical tensions took centre stage. US and its Western allies imposed a raft of sanctions on Russia and commodity prices moved significantly higher in response, raising concerns over the impact on inflation, the pace of policy tightening and the outlook for growth.
Trading in Russian companies (both inside Russia and on international exchanges) became fraught as investors sought to exit these exposures en-masse and their share prices crumbled. Russia was officially removed from the MSCI Emerging Markets Index on 9 March, at a price that was effectively zero.
Egypt, a major wheat importer, was one of the weakest markets in the MSCI Emerging Markets index, due in part to a 14% currency devaluation relative to the US dollar. China also lagged the index by a wide margin as daily new cases of Covid-19 spiked, and lockdowns were imposed in several major cities, including Shanghai. Regulatory concerns relating to US-listed Chinese shares also contributed to market volatility. Conversely, the Latin American markets all generated strong gains, led by Brazil. Other net commodity exporters also posted sizeable gains, including Kuwait, Qatar, the UAE, Saudi Arabia and South Africa.
In unhedged New Zealand dollar terms, the MSCI Emerging Markets Index produced a quarterly return of -8.0%, contributing to a -10.4% return over the last 12 months.
Source: MSCI Emerging Markets Index (gross div.)
-6.8%
New Zealand was again one of the poorer performing global developed share markets over the quarter with the S&P/NZX 50 Index returning -6.8%. There was a wide divergence in sectoral returns over the quarter, with utilities and financial services firms generally outperforming, while healthcare and technology companies dominated the list of poorer performers.
+3.9%
New Zealand-based travel and expense management provider Serko Ltd declined -33.4% for the quarter as business travel volumes reduced during the important December and January period. This disruption, caused by the Omicron variant, impacted Serko’s revenue expectations for the year. Healthcare companies Ryman Healthcare, Fisher & Paykel Healthcare and Pacific Edge Ltd all fell between -23.4% and -27.8%. With the generally lower respiratory intervention requirements of the Omicron variant, as well as a relatively mild flu season in the Northern Hemisphere, some of the tailwinds that had propelled Fisher & Paykel’s strong share price performance throughout 2020 and into 2021, dissipated in the first quarter of 2022.
Although the list of companies delivering positive returns were in the minority, utilities firms with greater pricing power performed relatively well. Contact Energy, Vector, Genesis Energy, Spark, Chorus and Meridian Energy all returned between +2.4% and +5.3%, to help prop up the local market index.
Source: S&P/NZX 50 Index (gross with imputation credits)
The Australian share market (ASX 200 Total Return Index) bucked the trend by eking out a +2.2% return for the quarter in local currency terms. Returns to unhedged New Zealand investors were higher at +3.9% due to an appreciation in the value of the Australian dollar over the quarter.
Once again, the dispersion in sectoral returns was a feature of the market, with the energy, materials, utilities and financials sectors all performing positively, while consumer discretionary, healthcare and information technology companies were the notable laggards.
Also notable was the generally strong performance of the large capitalisation firms, with top 20 companies Woodside Petroleum (+52.5%), BHP Group (+29.7%), Rio Tinto (+25.6%) and Santos (+24.5%) all benefiting strongly from increases in energy and/or key commodities prices.
At the other end of the spectrum, Hutchison Telecommunications fell -32.5% and Reece Group, a leading distributor of plumbing products to commercial and residential customers in Australia, New Zealand and the United States, experienced a decline of -29.2% in spite of posting a solid half year announcement.
Source: S&P/ASX 200 Index (total return)
-2.2%
The narrative that inflation was transitory began to change at the beginning of the year and central banks increasingly signalled their inflation concerns, which drove bond yields higher. While acknowledging the uncertainties related to the geopolitical situation and its economic implications, central banks have so far suggested that unless the growth outlook were to markedly deteriorate, they view inflation as the more pressing problem.
Inflation throughout Europe was revised up to 5.9% in February and inflation in the UK accelerated to 6.2%. In the US, inflation reached a 40 year high of 7.9% and is expected to remain elevated over the coming quarters.
With this backdrop, the European Central Bank confirmed that the tapering of the pandemic emergency purchase programme will now conclude in June. President Christine Lagarde also left the door open to a first interest rate hike later this year.
The US Federal Reserve, as expected, raised the Federal Funds rate by 0.25%, making it clear that further increases will be appropriate. Committee members now expect seven hikes this year, and four next year, implying interest rates could end this cycle higher than the committee’s perceived neutral rate of 2.4%.
After an initial rate hike in December, the Bank of England raised its policy rate by 0.25% twice in the first quarter, reaching 0.75%. At their March meeting, the Bank described geopolitical risks as having accentuated its prior expectations for weak growth and high inflation this year, before noting that their monetary policy “will act to ensure that longer-term inflation expectations remain well anchored”.
With investors now expecting rate hikes at a swifter pace, global bond yields rose notably through the quarter. The US 10year Treasury yield increased from 1.51% to 2.35%, while the UK 10-year yield climbed from 0.97% to 1.61%.
While rising yields are a headwind for short term sovereign bond returns, corporate bonds generally performed even worse, as credit spreads widened due to a worsening economic outlook.
The FTSE World Government Bond Index 1-5 Years (hedged to NZD) returned -2.2% for the quarter, while the broader Bloomberg Global Aggregate Bond Index (hedged to NZD) returned -4.8%.
Source: FTSE World Government Bond Index 1-5 Years (hedged to NZD)
-2.9%
The Reserve Bank of New Zealand (RBNZ) elected to increase the Official Cash Rate (OCR) by a further 0.25% on 23 February, moving this benchmark rate from 0.75% back to its pre-Covid level of 1.00%.
In making this adjustment, the Monetary Policy Committee noted that the most significant risk to be avoided at present was for longer term inflation expectations rising above the bank’s target and becoming embedded in future price setting.
The Committee stated that while higher interest rates are necessary, households and firms may have become more sensitive to interest rate changes as their debt levels have risen. Accordingly, the behavioural responses of household and businesses in the face of higher interest rates, will be important considerations in determining the pace of future interest rate tightening. For the time being, the RBNZ are currently projecting the OCR hitting 3.4% by late 2024, however they acknowledge the pathway towards that level could well include individual rate hikes of larger than 0.25%, if deemed necessary.
Given this outlook, the New Zealand 10 year government bond yield climbed from 2.33% at the end of 2021 to 3.25% at the end of March, an increase of 0.92% over the quarter. The New Zealand 2 year government bond yield followed a similar pattern, beginning the year at 1.98% and ending the March quarter at 2.92%, a yield increase of 0.94%.
Similar to the effects seen overseas, these rising bond yields generally resulted in negative short term returns for bonds of all durations.
The S&P/NZX A-Grade Corporate Bond Index fell -2.9% for the quarter, while the longer duration but higher quality S&P/NZX NZ Government Bond Index fell -4.3%.
Source: S&P/NZX A-Grade Corporate Bond Index
Unless otherwise specified, all returns are expressed in NZD. We assume Australian shares and emerging market shares are invested on an unhedged basis, and therefore returns from these asset classes are susceptible to movement in the value of the NZD. Index returns are before all costs and tax. Returns are annualised for time periods greater than one year.
We’re not exactly sure of the recipe required to bake fast rising prices into the economy but we’re pretty sure of the ingredients. You will commonly need -
• disruptions in free-flowing trade
• shortages in goods
• surplus money in the economy; such as that provided by financial stimulus packages
Between the effects of Covid-19, logistical challenges, worldwide massive government stimulus and now the war in the Ukraine, accompanied by sanctions, we can easily see why prices are increasing. There is just too much money chasing goods that are becoming rarer and more difficult to acquire.
The effects are everywhere and by no means unique to New Zealand. Petrol prices are up, food prices are up, rental prices are up. Interest rates have also gone up and markets are factoring in more rate increases in the months ahead.
You don’t need us to remind you that inflation is here. But if you own a diversified investment portfolio you are probably already prepared for inflation.
So, what do we mean by ‘already prepared’?
It means that unlike many Kiwis, especially many senior citizens, you are not just invested in cash and term deposits which tend to perform poorly when inflation is high. You are instead invested in a range of different assets that, over time, will generally do much better than inflation.

Just recently we were told a story of a conversation one investor had with her friend Mary, who is widowed and lives in a retirement community. Mary commented that she was worried about running out of money.
“Okay Mary,” the investor asked, “what’s your financial situation look like?”
“Well,” Mary said, “I’ve got a little less than $100,000 and it’s all in a savings account in the bank.”
“Why do you have everything in the bank Mary,” the investor responded.
“Because it’s safe….”
Mary may have thought investing in the bank was safe, and perhaps it is safe… from criminals. But if there’s one thing that demonstrates that investing in cash is not safe, it’s the corroding effects of inflation.
As we write this, inflation according to the Reserve Bank of New Zealand, is at 5.9% (Q4 2020 through 2021 Q4). But even that doesn’t tell the whole story. It’s widely reported that in Q1 2022 inflation has progressively worsened.
The graph below from Stats NZ shows that inflation is currently at its highest rate in over 20 years.

It’s clear from this data that someone like Mary, earning very little on her bank savings, is in a poor position. Her $100,000 is very precious and the amount of goods, services and daily necessities it can purchase is reducing every day.
Inflation has accurately been described as a silent thief. If Mary’s savings are earning an average return of 1.0% p.a. (before tax and fees) but the cost of the critical goods and services she needs to buy is going up by 5.9% p.a. (or more), then you can quickly see her purchasing power is eroding fast.
By contrast, our clients very rarely have the majority of their assets in cash. Extra cash is held for short term, definitive purchases. Future purchases, which are the ones most influenced by rising prices, are generally funded through a portfolio.
Inflation is here, that’s why you own shares.
Although a portfolio’s value can go up and down, it typically provides good insulation from the long-term effects of inflation for very logical reasons. If the prices that businesses charge for their goods and services increase, so do their nominal revenues. Over time, that increase in revenue pushes up the value of their share prices.

Shares, unlike cash, have a long history of outperforming inflation as the chart below demonstrates. It shows inflation in the United States back to 1927 and the data tells us that $1 in 1927 was worth the same as $16 in 2021 (i.e. $1 adjusted for inflation each year). However, $1 invested in large US companies was worth $11,182 by year end 2021 before tax and costs.
Other assets also outperformed inflation over this period, including bonds and residential property, although not by as much.
The main point, however, is that an investor that owns a diversified portfolio of shares, some bonds and property, is already well positioned to withstand inflation over any reasonable time horizon. And for that reason our investors (unlike Mary) should feel comfortable.
What about alternative investments?
We are sometimes asked about other securities that are promoted to reduce the effects of inflation.
The one brought up most often is commodities. In case you were curious, commodities present three main challenges within the context of a portfolio:
1. They are traditionally dominated by energy products such as oil, which environmentally conscience investors want to avoid.
2. Commodities are very price volatile; about 20 times as volatile as inflation itself1. Trying to dampen inflation with something 20 times more volatile is like cracking a nut with a sledgehammer. It could get messy.
3. The long term returns of commodities are usually only 3% to 4%, just a little more than the return on inflation itself2.
We aren’t sure how much longer inflation will be with us. The answer may depend on being able to predict Covid-19 mutations, the geopolitical moves of Russia, the counter measures of OPEC and NATO, and Central Bank policy - all at the same time. However, we are sure that inflation will show over time, the wisdom of owning a portfolio as opposed to other ‘safe’ alternatives, such as cash.
In today’s environment, losing purchasing power with cash is inevitable.
Even though we can’t predict the future, history tells us that beating inflation over the long term in a prudently diversified investment portfolio, is probably also inevitable.
Source: Consilium Graphica 2022. Notes: Analysis period is for June 1927 to December 2021. All returns are in US dollars. Materials are only prepared for client education purposes.
1 https://www.evidenceinvestor.com/what-to-do-if-youre-worried-about-inflation/
2 https://www.aqr.com/Insights/Datasets/Commodities-for-the-Long-Run-Index-Level-Data-Monthly
The main point, however, is that an investor that owns a diversified portfolio of shares, some bonds and property, is already well positioned to withstand inflation over any reasonable time horizon.
The indices used to calculate the index portfolio returns are as follows:
underlying manager fees, but gross of custodial and adviser monitoring fees

The indices used to calculate the index portfolio returns are as follows:
Notes:
underlying manager fees, but gross of custodial and adviser monitoring fees

In the Partner Firm Service Agreement and Consilium Investment Committee Policy and Procedures Manual, the CIC outlined the following process for reviewing underlying investments.
All investment securities are reviewed on a quarterly basis and performance is measured against appropriate benchmark indices. Where a security’s performance is consistent with its mandate and in line with broad style and/or asset class returns, no further action will generally be taken.
However, a security may be placed on an ‘enhanced due diligence’ list, and subjected to a higher degree of scrutiny, for any of the following reasons:
- A change in the primary portfolio manager
- A significant change in the fund management company’s majority owner or ownership structure
- A more than 25% fall in the fund’s assets under management over a rolling one- year period (due to outflows, not market movement)
- Total fund assets falling below our minimum fund size thresholds at any time
- A change in the fund’s investment style, diversification and/or risk factor tilting
- An increase in the fund’s fees
- The fund exhibited quarterly tracking error versus a relevant benchmark outside its monitoring thresholds
- The fund exhibited a persistent deviation in tracking error versus a relevant benchmark outside its monitoring thresholds, measured over a rolling three-year basis, and allowing a volatility threshold appropriate for each fund
- An extraordinary event which, in the opinion of the Investment Committee, may impact on the manager’s ability to comply with the fund mandate in future
We completed the monitoring of all of the above aspects for all underlying funds in your portfolios and found the following:
1. Dimensional Emerging Markets Value Trust: outperformance for quarter ended 31/Mar/2022
The Dimensional EM Value Trust outperformed its market benchmark by +5.41% which exceeds our monitoring bands. Our initial analysis indicates outperformance is due to the underweight of Russian securities and overweight to high profitability value stocks.
2. Dimensional Emerging Markets Value Trust: outperformance for three years ended 31/Mar/2022
The Dimensional EM Value Trust outperformed its long-term market benchmark by +4.03% which exceeds our monitoring bands. Our initial analysis indicates the trusts tilts towards the deeper value stocks contributed to outperformance.
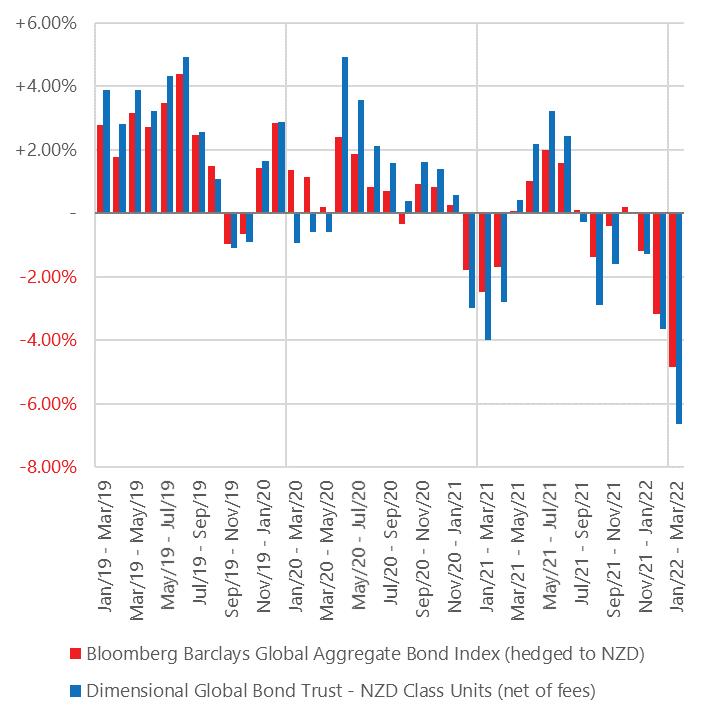
3. Dimensional Five-Year Diversified Fixed Int. Trust (NZD Class): underperformance for quarter ended 31/Mar/2022
The Dimensional Five-Year Diversified Fixed Int. Trust (NZD) underperformed its market benchmark by -2.17% which exceeds our monitoring bands.
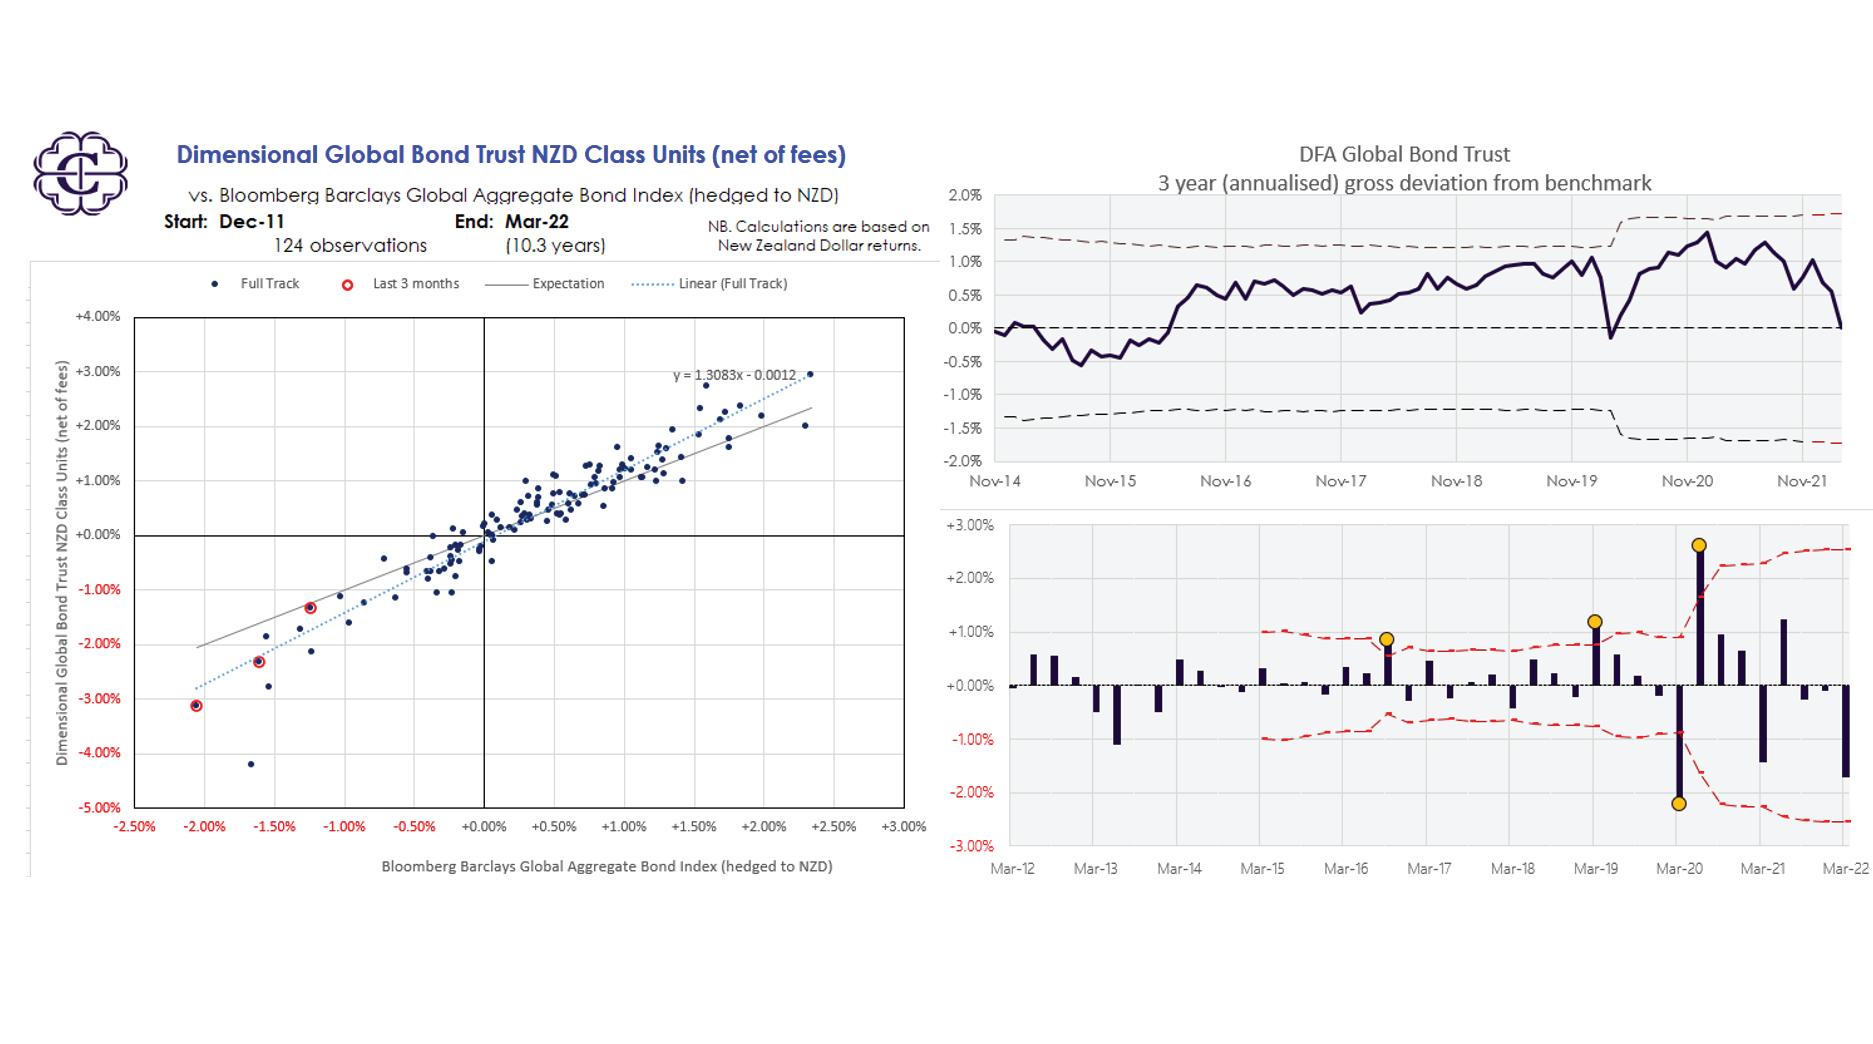
4. Dimensional Global Bond Trust/Global Bond Sustainability Trust (NZD Class): Change in mandate
The Dimensional GBT/GBST (NZD) experiences a change in mandate during Q1 2022, the upper maturity range for bonds that the trusts will primarily invest in will increase from 15 years to 20 years.
5. Dimensional Global Sustainability Trust (NZD Hedged): outperformance for quarter ended 31/Mar/2022
The Dimensional Global Sustainability Trust (NZD Hedged) underperformed its market benchmark by -2.73% which exceeds our monitoring bands.
6 Emerging Market Funds: Extraordinary event - Extraordinary event - Freezing of Russian stockmarket
All Emerging Market Funds experienced an extraordinary event with the significant disruption to the Russian stock market
7. Harbour NZ Corporate Bond Fund: 3-year outperformance
The Harbour NZ Corporate Bond Fund outperformed its long-term market benchmark by +0.40%.
8. iShares Funds: Management change
iShares informed us of two separate management changes. EM IMI Equity Index had a key management change from Jennifer Hsui to Amy Whitelaw, SUSM had a key management change from Jonathan Van Ginneken to Dharma Laloobhai.
We will be undertaking an analysis of all 8 flags over the coming weeks, and we are aiming to have completed papers summarising our findings within the next three months.
1. Dimensional Global Small Company Trust: outperformance for the quarter ended 31/Dec/2021
Investigation COMPLETE. This outperformance is resulting from the value tilts taken by the trust. We also note that the outperformance was primarily delivered by compositional differences compared to the benchmark, with allocations taken to companies not within the benchmark leading to the bulk of the outperformance. We remain satisfied that the aggregate risk exposures are consistent with the trust mandate, and we identified no unexpected or unexplained risks.
2. Dimensional Global Sustainability Trust: outperformance for three years ended 31/Dec/2021
Investigation COMPLETE. Our analysis highlighted that the outperformance in the three years to December 2021 was attributable to the trust’s compositional differences compared to the benchmark. The trust’s sustainability considerations led to significant outperformance, with a deliberate overweight to Tech giant Apple, combined with the exclusion of Energy companies, such as Exxon Mobil and BP, leading to outperformance across the three-year period. We remain satisfied the identified risk exposures are consistent with the trust mandate, and we identified no unexpected or unexplained risks.
3. Vanguard Ethically Conscious International Shares Index Fund: outperformance for three years ended 31/Dec/2021
Investigation COMPLETE. Upon reviewing this EDD flag the CIC noted that the benchmark used in our initial assessment was different to the specific benchmark used by Vanguard. This was due to past data availability constraints for the benchmark, upon further review this benchmark is now available. Following our analysis of the fund and the discovery of the correct benchmark used by the Vanguard. The CIC assesses that the fund passes this enhanced due diligence flag.
4. Dimensional Emerging Markets Value Trust: Fund outflow
Investigation COMPLETE. Dimensional informed the CIC that this flag was due to cannibalisation resulting from the introduction of the Dimensional Emerging Markets Sustainability Trust. With the introduction of this fund in July 2021, significant assets from the incumbent Dimensional Emerging Markets Value Trust transferred to the new sustainable fund. The CIC is satisfied that the reduction in the fund’s AUM had no detrimental impact on the performance received by the remaining fund investors and it is also not expected to impact Dimensional’s ability to effectively manage the fund on an ongoing basis.
Investigation COMPLETE. Our analysis highlighted that the outperformance in the December quarter relative to the custom benchmark was attributable to structural elements of the trust in particular the reduced exposure to small companies since 2020. This change occurred when the 5th factor in the Fama/French 5 factor model – reinvestment – was implemented. The custom benchmark has not been reflecting this reduced exposure and needs to be modified. However, we remain satisfied the identified risk exposures are consistent with the latest trust mandate, and we identified no unexpected or unexplained risks.
6. Funds Managed by Vanguard: Change in personnel
Investigation COMPLETE. We are satisfied that the ongoing management and support of the Vanguard funds will not be materially affected by this change, due to:
1. The fund mandates are well established, stable and remain unchanged.
2. The investment mandates all follow an index replication process which significantly minimises the degree of discretion.
3. At any point in time, the Head of Equity/Bond indexing is well supported by a large team of portfolio managers.
7. Dimensional Global Value Trust: outperformance for three years ended 31/Dec/2021
Work in progress
8. Dimensional Two-Year Sustainability Fixed Interest Trust (NZD Class): outperformance for three years ended 31/Dec/2021
Work in progress
Damon O'Brien Head of Investments and CIC ChairpersonDate: 23 September 2022

On the April 2022 monthly adviser call, the Consilium Investment Committee reported on the first quarter of 2022. A summary is included below, and the graphics on the following pages are an excerpt of that presentation.
A full recording of this presentation is available on the Consilium Portal under ‘Quarterly Reporting’.
With the outbreak of war in the Ukraine, inflationary pressures ratcheted up to levels not seen in decades forcing central banks to take swift action. Yields shot up causing losses in fixed income securities while the heightened uncertainty contributed to losses for equities as well.
Western nations took retaliatory economic action to the Russian invasion, and the Russian sharemarket was, for all intents and purposes, wiped of the investment map.
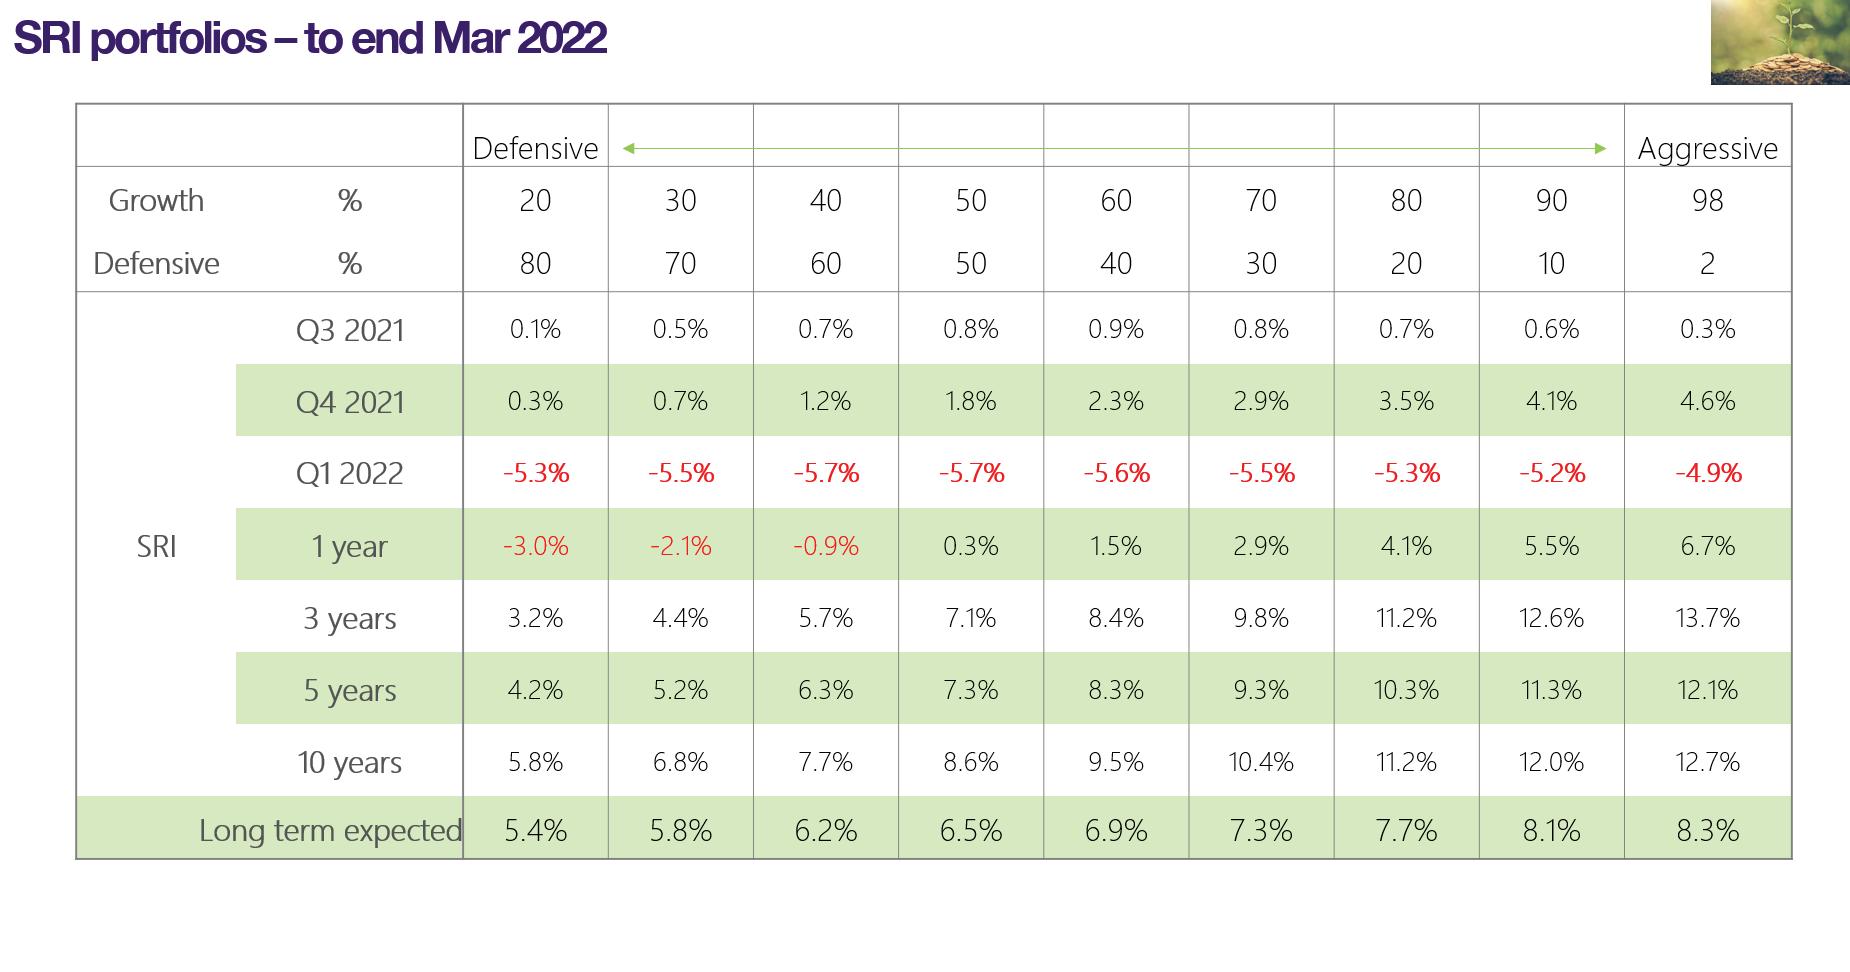
Model portfolio returns ranged from -5.7% to -2.4% for the quarter, with aggressive portfolios losing less than more defensive portfolios, the SRI suite underperformed unscreened portfolios.
In equities, Australian shares were the only asset class to return a positive return, while New Zealand, Developed and Emerging Market equities were all negative. Fixed interest was again negative in New Zealand, while internationally returns were also negative for the quarter.
Risk tilts were mixed across the quarter. The value factor was positive within Australia, Developed and Emerging markets. Large caps edged out small caps across the board. On the fixed income side, the term and credit premium were negative.

Source: https://www msci com/end-of-day-data-country

E m ergi ng m ar k ets per f or m ance (MSCI l arge cap i n di ces, l ocal cu r rency)
12 m on ths Q4 2021
Source: https://www msci com/end-of-day-data-country


Rolling 3m returns
Rolling 12m returns
Key:

New Zealand

Australia
Developed Markets (hedged)


Developed Markets (unhedged)


Emerging Markets


Unscreened f und retur ns rel ati ve to mar k et and styl e – to end Mar 2022


April – June 2022
P1 Market commentary
P5 Key market movements for the quarter
P8 What happened to bonds?
Whether you own a TV or radio, read a newspaper, or get your news online, it’s a fairly safe bet that the bulk of the economic news you are receiving at the moment sounds fairly gloomy.
Even if we could ignore the news, which is often more noisy than informative, we can’t easily ignore that the price of food, petrol and many other essential goods have been rising sharply in recent months, putting pressure on household budgets.
This comes at a time when New Zealand house prices also seem to have peaked. After having accelerated strongly throughout much of 2021, helping homeowners at least ‘feel’ wealthier, housing market indicators now suggest prices could be easing in many regions. And, while the housing market begins to cool, mortgage rates are heading in the other direction (higher), which will only serve to crimp discretionary spending even further.
As spending reduces across the economy, and without our border and immigration policies currently enabling enough visiting holidaymakers or migrant workers to take up the slack, the immediate economic outlook appears weaker than the post-covid global reopening world that many envisaged was awaiting us this year.
While New Zealand’s official unemployment rate is at record lows, and our exporters continue to perform fairly well supplying a world still scrambling to satisfy widespread food and commodity shortages, these appear to be isolated rays of sunshine peeking out from behind a thickening bank of economic cloud.
Consumers and businesses have shown great resilience over the last few years. But the economic environment continues to be challenging and the pathway towards a sustainable economic recovery (perhaps with an initial period of low or negative growth), is unlikely to be smooth.
One of the elements that will have a bearing on the shape and speed of the recovery will be what happens with inflation.
The roots of the current surge in global inflation can be traced all the way back to the start of the Covid-19 pandemic, when a large imbalance between the supply and demand for goods emerged.
One of the elements that will have a bearing on the shape and speed of the recovery will be what happens with inflation.
The global economy contracted sharply in the first half of 2020 as lockdowns were imposed, but what followed was a highly unusual recession as households were largely shielded from economic pain. Many were able to continue to work from home on full pay, while others had their balance sheets protected by various government payments and employment subsidies such that, in aggregate, net savings rose sharply.
With consumers relatively flush with cash and most parts of the global economy still closed, notably the services sector, this pent-up demand was directed into the goods sector and, in New Zealand’s case, the housing market.
While the supply of goods can often struggle to keep pace with demand shocks even in normal economic times, strains on production were amplified by Covid lockdowns and the simultaneous disruption to global supply chains. Shortages of goods caused supplier delivery times to lengthen, and the deteriorating imbalance between supply and demand flowed through to consumers in the form of higher prices.
More recently, the spill-over from the tragic events in Ukraine has only exacerbated these underlying inflation trends as commodity prices have soared, lifting inflation even further.
However, inflation has begun to show some tentative signs of softening, even if the official (backward looking) figures still look strong. Global shipping rates spiked during the pandemic due to supply chain constraints, and the higher freight costs were typically passed on to consumers. However, the Freightos Baltic Index (FBX) Global Container Index suggests these are now well off their highs, having fallen to around US$6,500 per container, compared with around US$11,000 per container in late 2021. It is a tangible sign that some of the recent freight congestion is finally starting to ease. Similarly, higher oil prices have been hurting consumers at the petrol pump with the international oil price rising from around US$50 per barrel in February 2020 to around US$120 per barrel by early June 2022. However, in the last few weeks the oil price has moved steadily downwards to hover around the US$100 per barrel level. Price declines have also been seen in some other key industrial commodities such as copper, which is used in building construction and electronic product manufacturing. After more than doubling in price from March 2020 to the end of February 2022, the copper price has eased over 20% since.
All of these more recent price trends help reinforce the idea that inflation, whilst continuing to be problematic now, may begin to ease over the remainder of 2022.

As central banks have been steadily revising their inflation expectations upwards, these have been accompanied by downward revisions in projections for global GDP growth.
The recent World Bank Global Economic Prospects Report highlighted this only too clearly.
In January, it forecast global growth for 2022 of 4.1%, but barely six months later, in its June update, this was cut sharply to 2.9%, a nearly one-third reduction from its earlier estimate.
Economic activity has so far been relatively robust as consumers have shown an ability to absorb higher prices, in part due to running down the savings they accumulated during the initial phase of the pandemic. The subsequent tight labour market and pick-up in wage growth has also helped. While these factors should remain supportive for a time, some cracks have begun to emerge on the demand side of the global economy.
With inflation outstripping wage growth in most countries, a squeeze on real incomes has started to erode consumer confidence. Some measures of consumer confidence in the US and UK have fallen to levels not seen since the global financial crisis, while confidence is declining in Europe. It’s the same in New Zealand with the ‘cost of living crisis’ now widely recognised as the number one issue facing households. All of this suggests that consumers may soon be less willing (or able) to tolerate higher prices in the future, and there is even a risk of outright declines in demand. In the case of recent oil, copper and other commodity price declines, this adjustment may already be underway.
Meanwhile, now that central banks are finally getting on with the job of raising interest rates and global bond markets price in additional rate hikes, there are also signs that tighter financial conditions are starting to have an impact.
All of these more recent price trends help reinforce the idea that inflation, whilst continuing to be problematic now, may begin to ease over the remainder of 2022.
In the US, 30-year mortgage rates have climbed to 5.7% in mid-June, the highest level since 2008, and this has coincided with a deterioration in US housing market.
The New Zealand housing market is also showing clear signs of having cooled from the FOMO (fear of missing out) days of late 2021/early 2022. The Reserve Bank of New Zealand was amongst the first of the global central banks to begin raising interest rates late last year, and with floating mortgage rates now nudging 5.5%, we are seeing more regular commentary suggesting a slowdown in house sales. In some regions, house prices may already be easing.
All of this makes for a very difficult environment for policymakers. Faced with widespread pricing pressures, central banks have determined that tackling inflation is their highest priority, and higher interest rates are the primary tool at their disposal to achieve it. Therefore, as long as inflation remains a concern, central banks will likely continue raising interest rates while maintaining cautionary forward guidance, in an effort to cool activity.
As if this escalating inflation and weakening economic growth environment wasn’t enough, the ongoing war in the Ukraine and the drawn-out global impact of Covid, are other factors continuing to create uncertainty or unease in the minds of many investors.
In general, when investors are feeling happy and confident, they are often more comfortable allocating to higher risk investments. However, when they are lacking in confidence, they are less inclined to take higher risks. Market commentators have a specific phrase for this general investor attitude, they refer to it as ‘investor sentiment’, either positive or negative. Recently, investor sentiment has been more consistently negative. And it is with this backdrop that global share markets have been struggling over recent months.
On 14 June, the main New Zealand share market (the S&P/NZX 50 Total Return Index) slipped into official ‘bear market’ territory. A bear market is generally defined as a decline of at least -20% from the prior market peak, which in New Zealand’s case was on 4 October 2021. At time of writing, the S&P/NZX 50 had since rallied a little, reducing the size of this decline, but nevertheless it reflects a very tough period for local share market investors.
This is not an issue unique to New Zealand. The globally significant US share market has had it even worse. The headline S&P 500 Index similarly fell into bear market territory on 13 June, while experiencing its worst first half of the year since 1970. The other high profile US index, the Nasdaq 100 which includes all the large technology companies, ended June over -30% below its peak of 27 December 2021.
These returns are reflective of markets that are facing a range of uncertainties and they are therefore pricing in a high degree of caution or pessimism. But that doesn’t mean that the returns outlook for the months ahead is necessarily poor.

When we review historical data (back to 1940) using the leading US share market index as our reference (the S&P 500 index), the chart below summarises the average one, two and three year performance of the S&P 500 after all previous bear market declines of -20%.
As the chart clearly shows, the average return after a decline of -20% is positive in all analysed time periods, and strongly positive over the subsequent two and three year periods. As challenging as things may seem now, this is a timely reminder that markets are always much more focused on where the economy is going, and not where it has been. After all, share markets are a leading indicator for the economy.
As challenging as things may seem now, this is a timelyreminder that markets are always much more focused on where the economy is going, and not where it has
been.
Bond markets have also experienced a poor start to the year, with interest rates in many countries having increased and with further rate rises projected. It is a unique aspect of bond pricing that when interest rates rise, two things happen –
1. The prices of existing bonds go down (which happens immediately)
2. The expected future returns of those existing bonds go up (with these higher returns being delivered over time)
In this regard, falling bond prices are felt immediately in portfolio valuations, while the higher expected future returns are only received in the months that follow. One small comfort from this is that with current bond yields now much higher than they have been for several years, the expected future returns from bonds are looking increasingly attractive.
Even if New Zealand or any other countries enter a technical recession this year (two or more consecutive quarters of negative growth), recessions don't tend to last for very long and don’t necessarily impact asset prices. As we have already noted, if demand and inflation show more obvious signs of reducing, central bank policies can also be expected to eventually pivot from fighting inflation to supporting growth.
For now, uncertainties are elevated and these uncertainties have been fully priced into markets. While this has been a big factor in the poor share market returns year to date, it doesn’t tell us anything about the returns we should expect for the remainder of this year. Markets are relentlessly forward-looking. They don’t only calibrate the information that is known today, they also calibrate all the fears, hopes and expectations of every market participant. Whilst investor sentiment has been very negative, and this has weighed heavily on market prices, we know that sentiment and markets can turn very quickly. Just as the prospect of better economic times ahead can be a catalyst that can help move markets higher, and it can happen well before the benefits are readily observable in the economy around us.

Given the current low market starting point, if sentiment was to begin to improve in the coming weeks and months around any one or more of the current uncertainties (inflation, central bank policy, economic growth, Covid or the Ukraine conflict), then share markets at these lower prices might suddenly look a lot more appealing.
As always, in periods like this where the market has been challenging, it is best not to try and ‘time’ your exposure. Whilst it might be tempting to think that you could just sit out of the markets and wait for the current storm to blow over, the forward-looking markets will always go up, and sometimes strongly, well before the economic clouds have cleared. And given the speed that markets can react, being on the sidelines and missing the recovery can often be far more detrimental to a long term plan, than absorbing the current lower valuations and higher volatility of returns.
The most reliable advice is always to maintain the risk exposure that you set, and considered appropriate, when the skies were clearer. Investing more when prices are cheaper is usually an even better option, but that may not be an option that is available to everybody. If it isn’t, just batten down the hatches and wait this one out. The skies always clear and the markets always recover. We just don’t ever quite know the timing.
Whilst it might be tempting to think that you could just sit out of the markets and wait for the current storm to blow over, the forwardlooking markets will always go up, and sometimes strongly, well before the economic clouds have cleared.
Shares and bonds across the board were under pressure in the second quarter of 2022, as markets priced in further increases in interest rates as well as an increased risk of recession. Amongst equities returns, which were generally poor, the MSCI World Value index significantly outperformed its Growth counterpart, although both registered double-digit declines. The Chinese share market provided a rare highlight as prolonged lockdowns were lifted in some major cities, allowing macroeconomic indicators there to show some improvement.
Inflation rates in major economies continued to persist at multi-decade highs, with various central banks raising interest rates and others clearly signalling their intention to do so soon. The quarter also saw mounting concerns over global economic growth prospects, with the fight to tame inflation likely to result in monetary policy settings that would be less supportive than the global economy has enjoyed in recent years.
The potential for economies to experience a recession later this year became more widely contemplated and, towards the end of the quarter, economic indicators began to reflect a general moderating or slowing in economic activity.
In the US, investor focus was on inflation and the policy response from the US Federal Reserve. The bank enacted initial rate hikes during the quarter and signalled that there would be more to come. Even so, they admitted the task of bringing inflation down without triggering a recession would be a challenging balancing act.
While weak sentiment affected all sectors, consumer staples and utilities companies were comparatively resilient. However, there were some dramatic declines for some companies, most notably in the media, entertainment and auto sectors.
Further steep declines were common for eurozone shares, as the war in Ukraine continued and concerns mounted over potential gas shortages, with supplies to Germany a particular being a point of concern. Higher inflation also dented consumer confidence, with the European Central Bank (ECB) poised to raise interest rates in July.
UK equities also fell over the quarter, with economically sensitive areas of the market performing poorly towards the end of the period amidst rising recessionary risks.
In New Zealand dollar terms, the MSCI World ex-Australia Index delivered a quarterly return of -15.1% on a hedged basis and -6.9% unhedged. This meant the rolling 12 month return for the New Zealand dollar hedged index reduced to -12.2% while the unhedged index is down -4.2%.
Source: MSCI World ex-Australia Index (net div.)
-1.6%
In a quarter where global share markets generally slumped, it was somewhat against the usual trend to see the relative outperformance of the emerging markets region (as a whole). When investors are wary of exposure to higher risk assets, emerging markets are often harder hit. But not this quarter.
That said, plenty of emerging market share markets did post declines. The South Korea share market struggled, with financials, technology and energy stocks hit particularly hard amid growing fears of a global recession. Taiwan was also significantly lower, on fears that rising inflation and global supply chain problems would weaken demand for its technology products.
The Latin American markets of Colombia, Peru and Brazil were amongst the weakest in the MSCI Emerging Markets Index. A combination of rising concerns about a global recession, domestic policy uncertainty and weaker industrial metals prices later in the quarter, all contributed to the declines.
The emerging European markets of Poland and Hungary both underperformed by a wide margin, as geopolitical risks stemming from Russia’s invasion of neighbouring Ukraine persisted.
The shining light for the region was China which managed to deliver a solid positive return for the quarter. With lockdown measures in certain Chinese cities being eased, this prompted a recovery in economic activity.
As the largest constituent in the emerging markets region, China’s positive result was a major driver to the mild loss for this asset class in the quarter, with the MSCI Emerging Markets Index producing a quarterly return of -1.6% in unhedged New Zealand dollar terms.
Source: MSCI Emerging Markets Index (gross div.)
-1.0%
The New Zealand market endured a difficult quarter with the S&P/NZX 50 Index returning -10.2%. Whilst at the individual company level there was ‘red ink’ almost across the board for the quarter, it was the industrials and health care sectors that contributed the largest drag on the performance of the index.
The two worst affected firms in the industrials sector, Air New Zealand and Freightways were down -27.9% and -25.9% respectively for the quarter, as the prospect of weaker economic growth weighed heavily on their prices. While building materials firm Fletcher Building fell -21.0% as sentiment around the domestic building and construction sector continued to cool.
With only six firms in the top 50 delivering a positive return in the quarter, it was software firm Pushpay that enjoyed the strongest performance, gaining 11.4%. This followed news that two existing shareholders (BGH Capital and Sixth Street) were intending to make a takeover bid for the firm.
Source: S&P/NZX 50 Index (gross with imputation credits)
The Australian share market (ASX 200 Total Return Index) had a similarly tough time sliding -11.9% over the quarter in local currency terms. Returns to unhedged New Zealand investors were slightly better at -9.8%, due to an appreciation in the value of the Australian dollar over the quarter.
Once again, the dispersion in sectoral returns was a feature of the market, with the utilities and energy sectors standing apart from the rest by delivering small gains. At the other end of the spectrum, the information technology sector suffered a very poor quarter as growth company valuations came under increasing pressure due to the expectation of faster rate hikes. The real estate and materials sectors were also very weak.
With only a little over one in ten companies in the ASX 200 delivering positive returns during the quarter, infrastructure firm Atlas Arteria (+23.1%) and small energy company Viva Energy Group (+23.0%) were the clear standouts.
At the other end of the standings, there were 21 companies within the ASX 200 that delivered returns of -35% or worse for the quarter. This list was littered with small capitalisation firms in the technology and basic materials sectors, as valuation concerns and general negative sentiment during the quarter impacted these companies the most.
Source: S&P/ASX 200 Index (total return)
Global bonds saw their prices continue to decline during the quarter, with yields markedly higher due to elevated inflation data, increasingly ‘hawkish’ central bank statements and rising interest rates. There was a small bond rally (price gains) towards the end of the quarter as economic growth concerns began to rise.
With inflation data in major economies at multi-decade highs, the quarter was characterised by various central banks raising interest rates and others signalling their intention to do so. The quarter also saw mounting concerns over future economic growth prospects, including the possibility of a recession later this year.
In the US, the Federal Reserve implemented a series of interest rate hikes, raising the US policy rate by 0.50% in May and a further 0.75% in June, their largest single rate hike since 1994. At the same time, Federal officials cut their 2022 growth forecasts. In response, the US 10 year bond yield rose from 2.35% to 3.02% over the quarter.
European bond yields were volatile as the European central bank indicated it would end asset purchases early in the third quarter and raise interest rates soon after. With this backdrop, the German 10 year bond yield increased from 0.55% to 1.37% over the quarter.
In the UK, the Bank of England implemented further interest rate hikes, bringing the total to five in the current cycle, as well as raising its inflation forecast to a staggering 11%. This helped push the UK 10 year bond yield up from 1.61% to 2.24%.
Corporate bonds also suffered in the broad bond market sell off, and generally underperformed government bonds as credit spreads widened markedly. With mounting concerns over the economic outlook, high yield credit securities (i.e lower credit quality) were hit particularly hard.
The FTSE World Government Bond Index 1-5 Years (hedged to NZD) returned -1.0% for the quarter, while the broader Bloomberg Global Aggregate Bond Index (hedged to NZD) returned -4.5%.
Source: FTSE World Government Bond Index 1-5 Years (hedged to NZD)
-1.4%
The Reserve Bank of New Zealand (RBNZ) elected to increase the Official Cash Rate (OCR) by a further 0.50% on 14 April and again by another 0.50% on 26 May, taking this benchmark rate from 1.00% to 2.00% by the end of the quarter.
In its accompanying statement, the RBNZ noted that “the level of global economic activity is generating rising inflation pressures that are being exacerbated by ongoing supply disruptions driven by both Covid-19 persistence and the Russian invasion of Ukraine. The latter continues to cause very high prices for food and energy commodities.”
The Monetary Policy Committee also reconfirmed it planned to continue to lift the OCR “at pace” to a level that will confidently bring consumer price inflation to within its 1-3% target range.
In effect, this confirms the expectations of the RBNZ are for interest rates to continue to rise, for the time being at least.
Given this outlook, the New Zealand 10 year government bond yield climbed from 3.25% at the end of the first quarter to 3.87% at the end of June. The New Zealand 2 year government bond yield followed an entirely similar pattern, beginning the quarter at 2.92% and ending the June quarter at 3.51%, a yield increase of 0.59%.
Similar to the effects seen overseas, these rising bond yields generally resulted in negative short term returns for bonds of all durations.
The S&P/NZX A-Grade Corporate Bond Index fell -1.4% for the quarter, while the longer duration but higher quality S&P/NZX NZ Government Bond Index fell -3.2%.
Source: S&P/NZX A-Grade Corporate Bond Index
Unless otherwise specified, all returns are expressed in NZD. We assume Australian shares and emerging market shares are invested on an unhedged basis, and therefore returns from these asset classes are susceptible to movement in the value of the NZD. Index returns are before all costs and tax. Returns are annualised for time periods greater than one year.
On November 15, 2020, the New Zealand Herald ran an article titled, ‘What negative interest rates would mean for borrowers and savers’. It said that the Central Bank was seriously considering negative interest rates as an option to stimulate the economy in the post COVID recovery.

A mere 18 months later, the Central Bank raised the OCR to 2.5%, and indicted further upward moves were likely as outlined in its May Monetary Policy Statement1
The Reserve Bank Governor’s comment at the time was succinct and accurate, “We’re in a different world now.”
Not unsurprisingly, financial markets had priced lower interest rates into bond prices in 2019 and 2020 and investors got higher than normal returns as a result. In both 2019 and 2020, bonds provided investors very attractive returns. The Global Sustainability Bond Trust by Dimensional earned investors 8.64% in 2019 and 7.66% in 2020.
Since those heady days, market expectations about interest rates have changed dramatically. Markets no longer consider negative rates a possibility. Now markets are focused on inflation. Supply shortages, logistics problems and workforce constraints, combined with international energy disruptions, have pushed prices higher across many goods and services. Bond markets have absorbed this information and investors are now seeking a higher return on bonds. In response, bond prices have gone down and many investors received negative returns.
It’s important to point out that the poor recent bond returns are not the result of fund management or the credit worthiness of the underlying bonds themselves.
Poor returns are due to investors expecting inflation and requiring a higher yield as a result.
While that explains what happened, the question remains; should you still own bonds in your portfolio?
The answer in general is yes, although we always need to consider individual circumstances. It is worthwhile to provide some context and evidence for our position, especially considering recent returns.
Historically, bonds have been an excellent diversifier to shares. Since 1993 (as far back as we have NZ data at our disposal), there has been only one other calendar year where bond prices and share prices were both negative; in 1994 which we have circled below. By contrast we can look at 1998, 2000 and 2008 and see where bond prices went up while share prices that went down providing that diversification benefit investors are looking for.
Another illustration of the below chart is the narrower range of returns. While returns from shares can range from +50% to -40%, returns from bonds have never exceeded 20% in either direction. An appropriate allocation to bonds will reduce the volatility risk for your portfolio, which is especially important if you have a shorter investment time horizon.
The bond funds used in our portfolios are overwhelmingly comprised of bonds selected from
Historically, bonds have been an excellent diversifier to shares.
borrowers that are investment grade rated (BBB, A, AA, and AAA). Those borrowers, which include the New Zealand Government, are very likely to pay back the bonds. If investors hold on for the long run, they will likely receive the positive return that comes from those borrowers making their scheduled payments.
4. Increasing rates are priced in
But what if interest rates go up more from here? Won’t that lead to lower bond returns? Not necessarily. The expectation is that interest rates will go up, and those expected increases are already priced in by the market. The reason they are priced in is because there is substantial, publicly available information about the intentions of central banks with future interest rate movements. One source is the projections made by US Federal Open Market Committee Members. Those projections are in the chart summarised below. Each dot represents the opinion of a member on where interest rates will be for the years 2022 – 2024 and then longer term. This chart shows that some members, called ‘doves’, believe interest rates will be lower than the median projection, while others, called ‘hawks’ believe they will be higher than the median projection. The median position is plotted in a line in the chart above. The question for bond prices will not be whether rates go up, but rather how much they go up by and whether the hawks or the doves are closer to the truth. This is a question that markets adjust for everyday making the answer a 50/50 guess. After all, prices must fairly include all known expectations for both a buyer and seller to willingly trade.
On a positive note, bonds are yielding more than in previous years. The Dimensional Global Bond Sustainability Trust, as of the date of writing, is yielding 4.77%2. That number was closer to 1.0% 18 months ago.
What that means for investors is that bonds now have a much higher expected return. Even if prices go down, investors could still earn a positive return because they are starting from a 4.77% yield rather that 1.0% yield. To summarise, over the next year:

ࠠ If yields do not change, investors win.
ࠠ If yields go down, investors win.
ࠠ If yields go up, prices will fall, but investors are starting from around a 4.77%3 return rather than a 1% return. Therefore, they could still earn a net positive return over the next 12 months.
We understand that it has been a very difficult 12 months for bond holders, as markets have adjusted from the possibility of negative interest rates to watching the Reserve Bank move to fight inflation. Markets have moved quickly, as they should, to reflect this change. The way markets do that is through prices. So, while the returns over the past six months have been painful, they do make economic sense.
From here, the question is about the long-term place of bonds in investor’s portfolio. We strongly believe they still have a place. They remain a good diversifier, they are issued by investment grade borrowers, interest rate increases are factored in, and yields are much higher than they were 18 months ago.
If you have any concerns, please let us know. As always, we want you to be comfortable with your long-term investment strategy.
1 https://www.rbnz.govt.nz/hub/publications/monetary-policy-statement/ monetary-policy-statement-may-2022

2 https://au.dimensional.com/funds/global-bond-sustainability-nzd-class
3 In the global sustainability bond fund
The indices used to calculate the index portfolio returns are as follows:
Notes:
All returns are in New Zealand dollars
Model portfolios are designed and supplied by the Consilium Investment Committee (CIC)

Growth assets refer to investments in shares and property
Income assets refer to investments in cash and fixed interest
Model portfolio returns are net of underlying management fees, but gross of custodial and adviser monitoring fees
Long term expected returns are based on the CIC’s 2018/2019 strategic asset allocation review. These expected returns are net of underlying manager fees, but gross of custodial and adviser monitoring fees
Individual portfolios that deviate from the model portfolios will experience different returns
Past returns are no guarantee of future returns
The indices used to calculate the index portfolio returns are as follows:
Notes:
Due to the general lack of availability of SRI index data, this analysis compares SRI model portfolio returns with standard unscreened market indices
All returns are in New Zealand dollars
Model portfolios are designed and supplied by the Consilium Investment Committee (CIC)
Growth assets refer to investments in shares and property
Income assets refer to investments in cash and fixed interest
Model portfolio returns are net of underlying management fees, but gross of custodial and adviser monitoring fees
each asset
Long term expected returns are based on the CIC’s 2018/2019 strategic asset allocation review. These expected returns are net of underlying manager fees, but gross of custodial and adviser monitoring fees
Individual portfolios that deviate from the model portfolios will experience different returns
Past returns are no guarantee of future returns
In the Partner Firm Service Agreement and Consilium Investment Committee Policy and Procedures Manual, the CIC outlined the following process for reviewing underlying investments.
All investment securities are reviewed on a quarterly basis and performance is measured against appropriate benchmark indices. Where a security’s performance is consistent with its mandate and in line with broad style and/or asset class returns, no further action will generally be taken.
However, a security may be placed on an ‘enhanced due diligence’ list, and subjected to a higher degree of scrutiny, for any of the following reasons:
- A change in the primary portfolio manager
- A significant change in the fund management company’s majority owner or ownership structure
- A more than 25% fall in the fund’s assets under management over a rolling one- year period (due to outflows, not market movement)
- Total fund assets falling below our minimum fund size thresholds at any time
- A change in the fund’s investment style, diversification and/or risk factor tilting
- An increase in the fund’s fees
- The fund exhibited quarterly tracking error versus a relevant benchmark outside its monitoring thresholds
- The fund exhibited a persistent deviation in tracking error versus a relevant benchmark outside its monitoring thresholds, measured over a rolling three-year basis, and allowing a volatility threshold appropriate for each fund
- An extraordinary event which, in the opinion of the Investment Committee, may impact on the manager’s ability to comply with the fund mandate in future
We completed the monitoring of all of the above aspects for all underlying funds in your portfolios and found the following:
1. Dimensional Five-Year Diversified Fixed Int. Trust NZD Class: 3-year underperformance to 30/Jun/2022
The fund underperformed its long term benchmark by -1.51% pa, which exceeds our monitoring bands. Our initial analysis indicates this flag was the result of an additive effect of recent quarters underperformance.
2. Vanguard Ethically Conscious International Shares Index Fund: Change in personnel James Chatfield has been promoted to Senior Portfolio Manager, Ian Campbell has been promoted to Portfolio Manager, and Victoria Chai has been promoted to Equity Trader/Index Analytics. All three personnel work within the Australian Equity Index Investment Group.
We will be undertaking an analysis of both flags over the coming weeks, and we are aiming to have completed papers summarising our findings within the next three months.
1. Dimensional Global Value Trust: underperformance for three years ended 31/Dec/2021
Investigation COMPLETE. Our analysis highlighted that the three year relative underperformance of the trust to end December 2021, was largely attributable to the incumbent factor loadings of the custom benchmark setting the relative return expectations for this trust at an unreasonably high level. Once these factor loadings were brought into line with the CICs own updated expected returns research, deviation versus the revised custom benchmark was reduced and the prior three years observed performance was in line with new expectations.
2.
Dimensional Two-Year Sustainability Fixed Int. Trust NZD Class: underperformance for three years ended 31/Dec/2021
Investigation COMPLETE. Our analysis highlighted that the persistent underperformance was attributable to compositional differences between the trust and the benchmark, in particular the overweights to sources of higher expected return such as the steeper yield curves of different nations.
3.
Dimensional Global Sustainability Trust NZD Hedged Class: outperformance for quarter ended 31/Mar/2022
Investigation COMPLETE. Our analysis highlights that the trusts sustainability exclusions in aggregate contributed to the significant underperformance through the quarter, with exclusions to high emitters such as Energy firms in particular being the main driver.
4. Dimensional Emerging Markets Value Trust: outperformance for quarter ended 31/Mar/2022
Investigation COMPLETE. Our analysis highlighted that the outperformance in the quarter ended 31 March was attributable to structural elements of the trust relative to its benchmark. Factor tilts towards high profitability value stocks were the main driver of outperformance, with selective regional and industry exposure also contributing positively.
5. Dimensional Emerging Markets Value Trust: outperformance for three years ended 31/Mar/2022
Investigation COMPLETE. Our findings conclude that the outperformance is largely attributable to the same compositional factors that explain the recent positive quarterly deviations of performance, namely deeper value and the size tilt.
6. Harbour NZ Corporate Bond Fund: outperformance for three years ended 31/Mar/2022 Investigation COMPLETE. The CIC assesses that this 3-year flag was the result of an additive effect of three recent quarters of outperformance. We remain satisfied the fund was managed within its mandates over these quarters and their performance deviations are adequately explained.
7. Dimensional Five-Year Diversified Fixed Int. Trust NZD Class: underperformance for quarter ended 31/Mar/2022
Investigation COMPLETE. Our analysis highlighted that the underperformance was a result of the trusts corporate bond exposure, duration profile and compositional differences within currency allocation of the trust. The compositional analysis was insightful, and we remain satisfied the identified risk exposures are consistent with the trust mandate, and we identified no unexpected or unexplained risks.
8. Dimensional Emerging Markets Value Trust: Extraordinary event - Freezing of Russian stockmarket Investigation COMPLETE. Emerging Market Funds experienced an extraordinary event with the significant disruption to the Russian stock market. Dimensional demonstrated their ability to mange this change and have removed Russia as an eligible country of domicile for investment. The trust still holds securities here, however their valuation has been written down to zero. These securities will be sold when liquidity returns.
9. iShares MSCI EM SRI UCITS ETF (SUSM): Extraordinary event - Freezing of Russian stockmarket Investigation COMPLETE. Emerging Market Funds experienced an extraordinary event with the significant disruption to the Russian stock market. iShares demonstrated their ability to mange this change and have removed Russia as an eligible country of domicile for investment. The fund still holds securities here, however their valuation has been written down to zero. These securities will be sold when liquidity returns.
10. iShares MSCI EM SRI UCITS ETF (SUSM): Change in personnel Investigation COMPLETE. Although a change in personnel can create many challenges within a business, we are satisfied that the ongoing management and support of the fund will not be materially affected by this change, due to:
1. The fact that the fund mandate is stable, well established and unchanged.
2. The investment mandate follows an index replication investment process which significantly minimises the degree of discretion any individual portfolio manager can have in the funds’ allocation.
3. BlackRock has developed a highly automated compliance process to help ensure that portfolios are managed in accordance with their stated guidelines and applicable regulatory requirements.
11. Dimensional Global Bond Sustainability Trust NZD Class: Change in mandate Investigation COMPLETE. Through our regular monitoring discussions with Dimensional we were able to confirm that the investment strategies are entirely unchanged, this is merely a widening of the investable universe and has been introduced in response to the increased issuance of long duration bonds over the last few years. The CIC do not anticipate any change in the expected risk and return of the trust as a result of the change in mandate. We are satisfied the trust has passed this EDD review.
12. Dimensional Global Bond Trust NZD Class: Change
Investigation COMPLETE. Through our regular monitoring discussions with Dimensional we were able to confirm that the investment strategies are entirely unchanged, this is merely a widening of the investable universe and has been introduced in response to the increased issuance of long duration bonds over the last few years. The CIC do not anticipate any change in the expected risk and return of the trust as a result of the change in mandate. We are satisfied the trust has passed this EDD review.
Damon O'Brien Head of Investments and CIC ChairpersonDate: 23 September 2022
On the July 2022 monthly adviser call, the Consilium Investment Committee reported on the second quarter of 2022. A summary is included below, and the graphics on the following pages are an excerpt of that presentation.
A full recording of this presentation is available on the Consilium Portal under ‘Quarterly Reporting’.
The impact of the war in the Ukraine and inflationary pressures from the lingering effect of the Covid-19 pandemic continued to weigh on capital markets. The United States entered a technical recession, however the labour market remained robust. Ultimately the repricing of securities in the face of higher interest rates and increased uncertainty weighed on markets and the June quarter in 2022 generally delivered significantly negative returns across the majority of asset classes.
Model portfolio returns ranged from -4.4% to -10.7% for the quarter, with aggressive portfolios losing more than defensive portfolios, and the SRI suite underperformed unscreened portfolios.
In equities, Emerging Market shares were the most resilient (albeit still negative) while New Zealand, Australian and Developed Market equities were all negative in the order of -10%. The NZD weakened, helping insulate losses on unhedged positions. Fixed interest was very negative across the board and the year-to-date figures are among the worst ever seen over a 6 month window.
Risk tilts were mixed across the quarter. The value factor was positive within Australia, Developed and Emerging Markets while large caps generally were more robust than small caps although profitability tilts generally helped. On the fixed income side, longer term bonds suffered more than short term and the credit premia were generally negative with credit spreads widening in the face of increased default risk.
The U S economy is contracting (US GDP has decreased both quarters of 2022)

Source: U S Bureau of Economic Analysis, Real Gross Domest ic Product [A191RL1Q225SBEA], retrieved from FRED, Federal Reserve Bank of St Louis; https://fred stlouisfed org/series/A191RL1Q225SBEA

Source: U S Bureau of Labor St atistics, U nemployment Rat e [U NRATE], ret rieved from FRED, Federal Reserve Bank of St Louis; https://fred stlouisfed org/series/U NRATE

Topped out at 23 1mil on 9-May-2020
Cont inued claims, also referred t o as insured unemployment , is t he number of people who have already filed an init ial claim a nd who have experienced a week of unemployment and t hen filed a cont inued claim t o claim benefits for t hat week of unemployment Cont inued claims dat a are based on t he week of unemployment , not t he week when t he init ial claim was filed
Source: U S Employment and Training Administ ration, Cont inued Claims (Insured U nemployment ) [CCSA], retrieved from FRED, Federal Res erve Bank of St Louis; https://fred stlouisfed org/series/CCSA, July 30, 2022


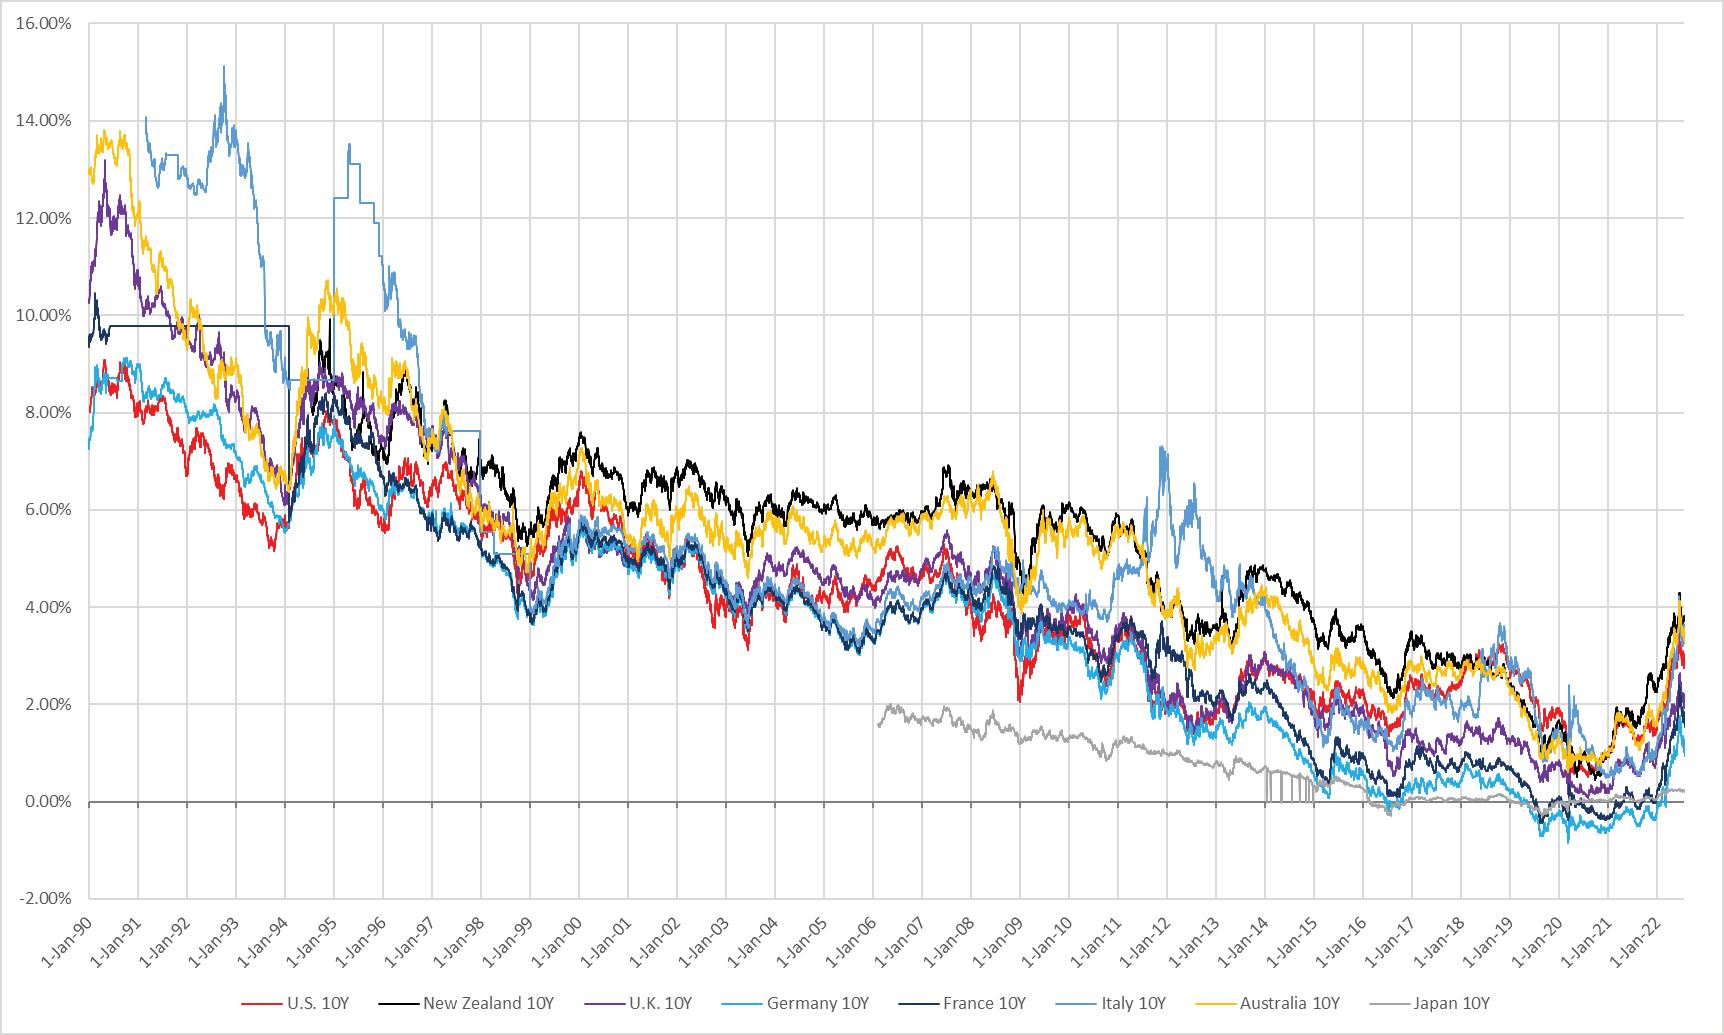
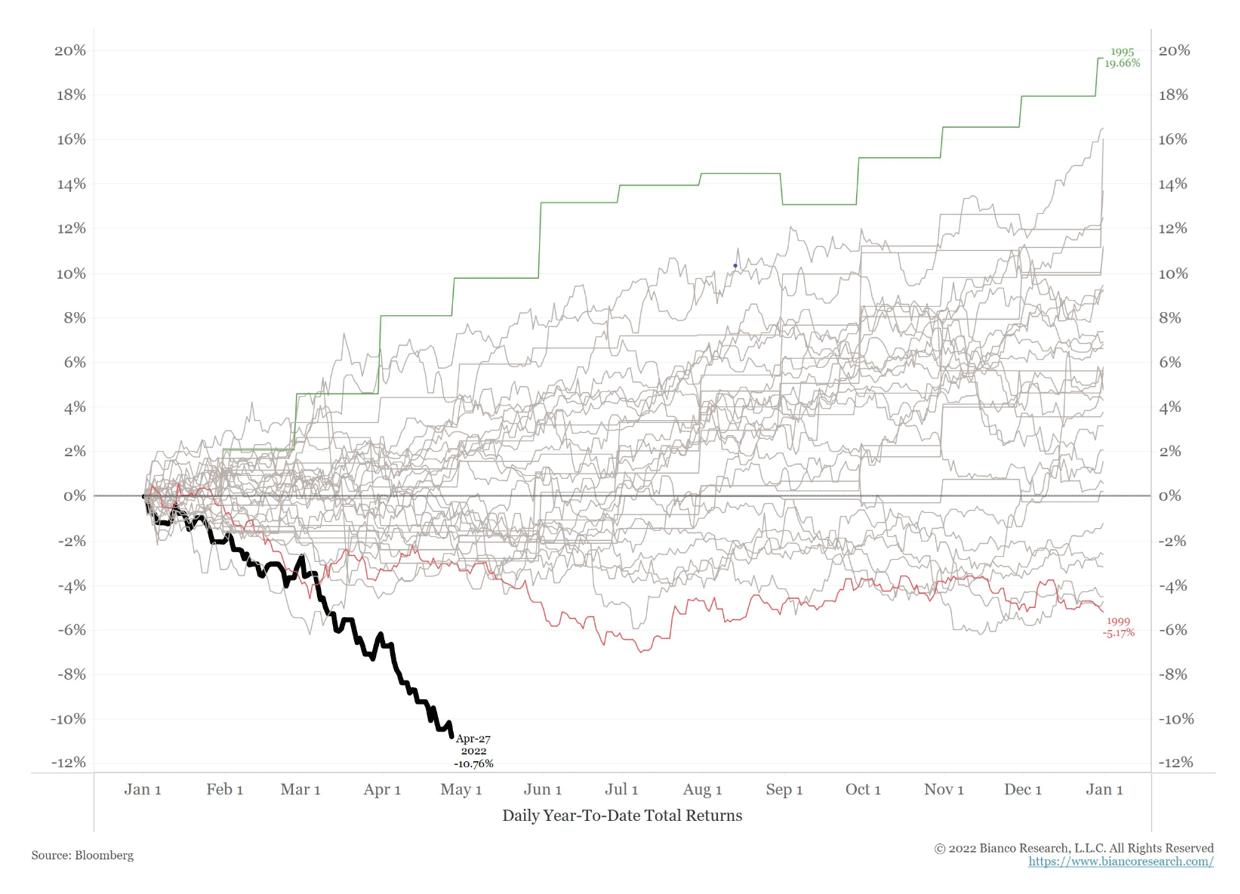
Increases lik e this not seen often, and off a far greater base Source
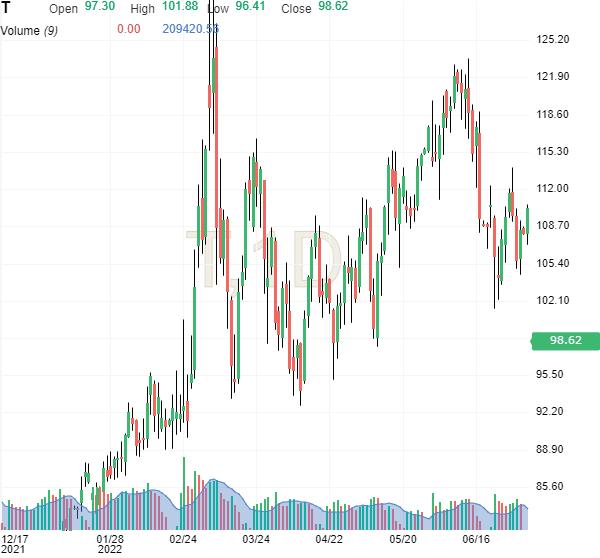
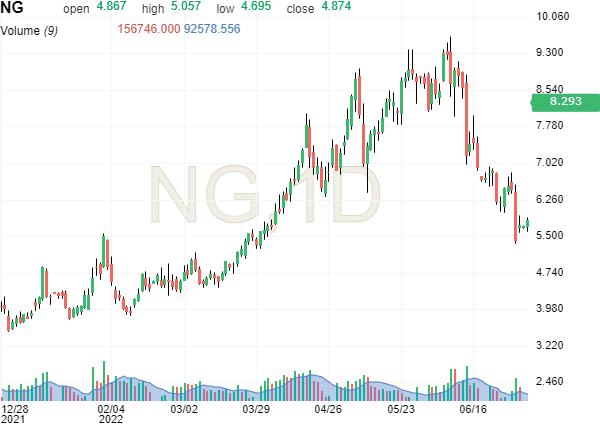
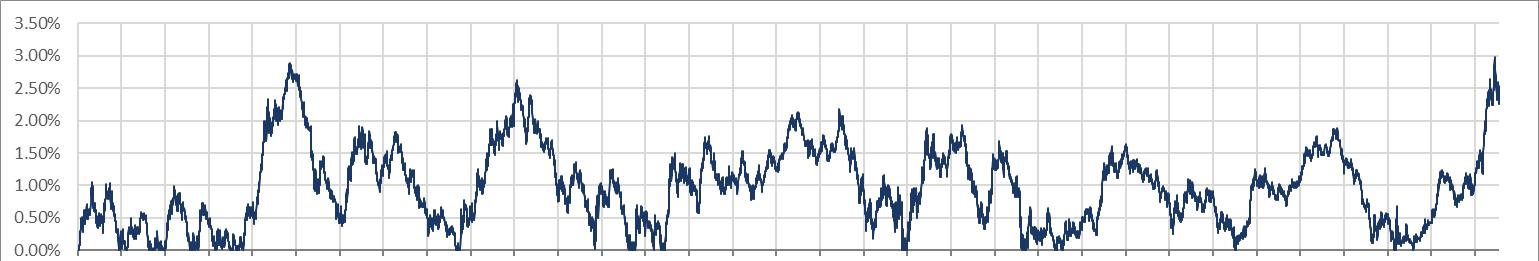
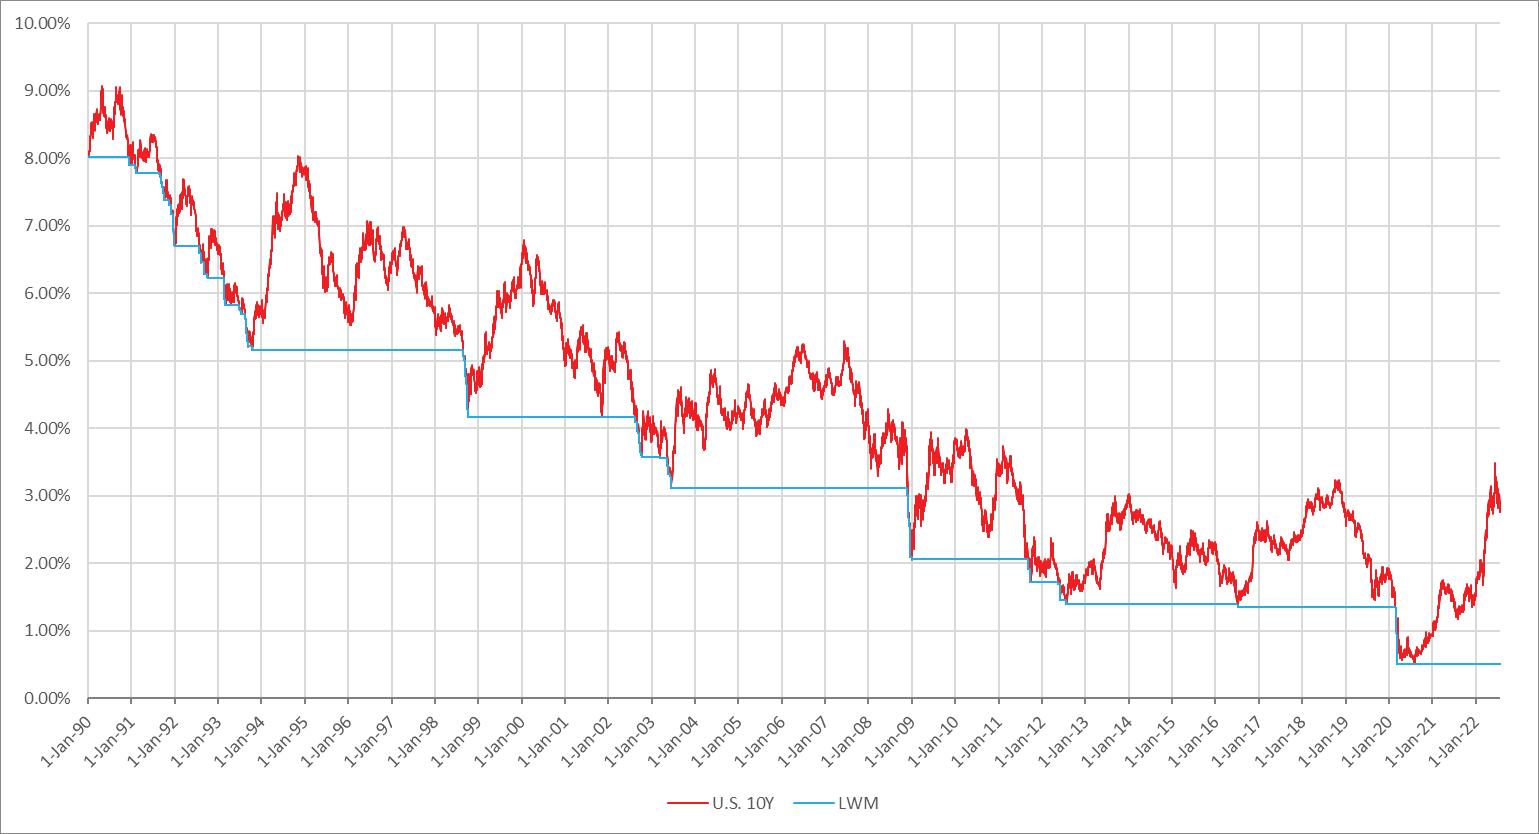
Other commodity prices well off highs


Wheat Gold
Source: Investing com
Devel oped m ar k ets per f or m ance (MSCI l arge cap i n di ces, l ocal cu r rency)
12 m on ths Q2 2022
Source: https://www msci com/end-of-day-data-country


Source: https://www msci com/end-of-day-data-country Relative flag sizes represent approximate exposure in model portfolios


1 January 1995 to 30 June 2022

1 January 1995 to 30 June 2022

The global economy has been buffeted by multiple challenges in 2022 and it is fast shaping up as a year not many will remember fondly. During the drawn-out lockdowns and upheaval that accompanied the peaks of Covid-19, the world collectively pined for a seamless post-Covid recovery. The reality however, has been rather bumpy.
Amidst a backdrop of sharply increasing inflation, tight labour markets, rapidly rising interest rates, and ongoing uncertainties surrounding both the war in Ukraine and the lingering pandemic, the global economy has stutterstepped its way through 2022.
Soaring food and energy prices are eroding real incomes, triggering a global cost-of-living crisis. Economic growth in the world’s three largest economies – the United States, China, and the European Union – is weakening, with significant spill over to other countries.
Business confidence has been on a gradual decline since mid-2021, with the deterioration particularly concerning for many developing countries that are yet to fully recover from the pandemic. Global trade has remained relatively subdued, as global supply chain disruptions and bottlenecks in international freight movements have been slow to improve.
Although international food and energy prices may have eased from recent peaks, they continue to sit at uncomfortably high levels. Inflationary price pressures, which have reached multi-decade highs in many countries, are hitting vulnerable population groups hard and prompting central banks to accelerate their efforts to tame inflation.
Good news is seemingly in short supply at present and these highly publicised economic, political and health challenges have all contributed to persistent headwinds for investment markets. However, the unforgettable lesson from all previous market corrections is that periods of weakness can often provide the best opportunities for long term investors.
Even before Russian President Vladimir Putin ordered the invasion of Ukraine, the global economy was under pressure.
Inflation was already higher than markets were anticipating, as the initial recovery from the pandemic recession was stronger than expected. The demand surge quickly overwhelmed factories, ports and freight yards, causing delays, shortages and pushed prices higher.
However, the unforgettable lesson from all previous market corrections is that periods of weakness can often provide the best opportunities for long term investors.
In response, central banks began raising interest rates to cool economic growth and contain spiking prices. Unfortunately, with the stop-start nature of the Covidera causing much more volatility in key economic indicators like growth and inflation, it became more difficult for central banks to ‘steer the ship’. If they leant too far towards supporting economic recovery and growth, they faced a bigger fight to control mounting inflation. But if they focused too rigidly on dampening down price increases, they pushed economies much closer to possible recession. It’s an economic highwire act with a hefty consequence attached to any misstep.
At the same time, China, pursuing a zero-Covid policy, imposed lockdowns that temporarily weakened the world’s second largest economy. Elsewhere, many developing countries still grappled with the pandemic and the heavy debts they had taken on to protect their populations from economic disaster.
As disruptive as they were, all of those challenges might have been manageable. But when Russia invaded Ukraine on 24 February, the West responded with heavy economic sanctions which further disrupted trade in the critical areas of food and energy. Russia is the world’s third-biggest petroleum producer and a leading exporter of natural gas, fertiliser and wheat, while farms in Ukraine feed millions globally.
The inflationary impacts resulting from this disruption have rippled out to the world.

The fight against inflation is being waged globally. And, while it is too early to declare victory, economic data continues to point to a peaking in inflation which, all things being equal, should begin to be reflected in lower average inflation readings in the future.
Importantly, the decline in inflation indicators is relatively broad-based. Delivery times and shipping costs are improving amidst the economic slowdown. Backlogs of electronic components have reduced back to their longrun averages. Ratios of orders-to-inventory, which swung to historical highs following the covid shutdowns, have moved back towards historical lows as many inventories have been significantly replenished.
The general slowdown in global demand has also taken pressure off commodity prices and allowed supply chains to partly normalise. Oil prices continued to recede in the recent quarter, providing some welcome relief to consumers at the petrol pump. Ending September at around US$80 per barrel, the international oil price has fallen by US$40 from its early June peak of US$120 per barrel, a 33% decline.
While all of this is indicative of an improving global supply chain, this is a complex system in which change can be difficult to quantify. To that end, the Federal Reserve Bank of New York has developed a ‘Global Supply Chain Pressure Index’ that combines variables from multiple indices in transportation and manufacturing, such as those related to delivery times, prices, and inventory. Since hitting a historical peak in December 2021, this measure of global supply chain pressure, while still reporting elevated readings, is now more than three quarters of the way back to typical preCovid levels.
It’s an economic highwire act with a hefty consequence attached to any misstep.
Fixed interest markets continue to be highly focused on inflation, monetary policy signals from central banks and the state of the economy.
Considerations about the economy are largely centred on two competing themes:
a. supply-based constraints leading to higher labour and goods prices
In New Zealand, escalating recession fears in July, linked to the idea of potentially fewer interest rate hikes, drove New Zealand 10 year government bond yields down to their lowest levels since April. By late August, however, the focus had shifted almost entirely to the policy comments made by central banks. In synchronicity with other major central banks, the Reserve Bank of New Zealand (RBNZ) reaffirmed its absolute focus on getting inflation back down towards its target range, resulting in the New Zealand 10 year government bond yield moving back to its June highs.
It was a very similar pattern in the USA. The yield on the US 10 year treasury bond reached an intra-year high of 3.5% in the middle of June, before steadily declining over the next six weeks as market concerns about recession risks took centre stage. However, as it became clear the Federal Reserve was steadfast in its commitment to subduing inflation, yields quickly rose again from early August, back beyond the prior peak, and briefly touched 4% near the end of September, a yield not seen on the US 10 year treasury bond since 2010.
With interest rates rising everywhere, the degree of tightening will ultimately depend on local conditions. In New Zealand, the RBNZs latest projections are for the Overnight Cash rate to rise to just over 4% in 2023. With the RBNZ having recently adjusted this benchmark rate to 3.50% on 5 October, it implies we are getting closer to the end of the current round of rate rises. That’s certainly what many homeowners with mortgages will be hoping.
The UK hit the headlines for a very different reason during the quarter – on 8 September the world was met with the sad news that Queen Elizabeth II, the UK's longest-serving monarch, had died at Balmoral aged 96, after reigning for 70 years.
The Queen ascended to the throne in 1952 and witnessed enormous social change during her reign. She also worked with 15 different prime ministers, from Winston Churchill in 1952, to Liz Truss who took office on 6 September, just two days before Queen Elizabeth’s death.
With the UK barely out of its official mourning period, Liz Truss alongside Chancellor Kwasi Kwarteng announced the country’s biggest tax package in 50 years. The package was aimed at boosting UK growth by cutting taxes and regulation and was to be funded by vast amounts of new government borrowing.
Unfortunately, the announcement met with almost universal opposition.
The International Monetary Fund openly criticised the plan, warning that the proposed measures were “likely to fuel the cost-of-living crisis.” The financial market reaction was equally severe, sending a very strong signal that modern monetary theory, which was fashionable during the Covid-19 pandemic, is now completely discredited.
This modern monetary theory was that monetarily sovereign countries (like the UK, USA and New Zealand) do not need to rely on taxes or borrowing to support their spending objectives. Since they are the monopoly issuers of their own currency, they can simply print and spend as much as they need. However, the seismic market fallout that erupted following the UKs late September tax proposals strongly suggests otherwise.

With the RBNZ having recently adjusted this benchmark rate to 3.50% on 5 October, it implies we are getting closer to the end of the current round of rate rises.
That’s certainly what many homeowners with mortgages will be hoping.
The proposed plan triggered an immediate crisis of investor confidence in the UK government – jolting global financial markets to such an extent that the Bank of England had to intervene with a pledge to purchase 65 billion pounds of UK government bonds in order to stem a potential market rout.
This led to the UK government quickly back-tracking and scrapping some of the tax plans they had unveiled to much fanfare, only a few days earlier.

Quite apart from the ever-present challenge of living in a world that is still managing the ongoing impacts of the pandemic, grappling with a significant geopolitical conflict, and enduring a cost-of-living crisis, long term investors have also had their patience tested by these events.
Portfolio valuations have been volatile in 2022, reflecting the uncertainties surrounding these complex real-world issues. Share markets have been buffeted as investor confidence has waned, and bond markets have suffered due to rapidly changing interest rate expectations.
Although it is hard to point to much obvious good news at present, one source of comfort should be that investor sentiment is currently very negative. That may sound counterintuitive, but when investor sentiment is strongly negative it means the markets have very likely factored in (and priced in) all of the existing bad news.
That’s why at the end of September, investors could buy a 10 year New Zealand Government bond yielding 4.3%, when at the start of the year it was yielding just 2.4%. It’s also why the price-to-earnings ratio of the globally significant S&P 500 Index in the USA was at 19.8, down from 26.3 at the start of the year and 37.3 at the end of 2020. In the investment world, unlike in our real-world supermarkets, almost everything is now cheaper.
In many ways, the investment discounts available today versus what investors were paying only a matter of months ago should be enough to see buyers queuing around the street. For the moment, the queues are relatively short. But as greater clarity gradually emerges about global inflation, interest rates and economic growth rates, the prices available in financial markets today might very well look highly appealing. And one thing we do know is that forward-looking markets always have the capacity to respond (and respond quickly) to the prospect of better times ahead. While investor patience has been tested this year, it is always important to remind ourselves that:
1. Investment returns often come in spurts – making it important that we stick to our long term strategy
2. Markets are volatile – meaning they can go down as well as up, so down periods should always be expected
3. Critical to achieving sound long term investment outcomes is good ‘investor behaviour’ – which means holding on to quality assets that have become temporarily cheaper, rather than being tempted to sell at a discount
As always, we don’t profess to know how or when the most significant events in the world today will be resolved. However, we do expect that central bank actions to contain inflation will eventually achieve that aim. We also expect that interest rates will eventually stop their ascent and reflect a new post-Covid equilibrium. We even expect the current conflict in Ukraine to reach a conclusion.
In the meantime, in spite of prevailing uncertainties, we expect global capitalism to continue to find ways to survive and thrive and for long term investors to continue to benefit from a consistent exposure to those endeavours over time.
In many ways, the investment discounts available today versus what investors were paying only a matter of months ago should be enough to see buyers queuing around the street. For the moment, the queues are relatively short.
Volatility remained high through the third quarter of 2022 as markets priced in changing expectations on the economic impact of rapidly rising interest rates, increased European energy uncertainty, and the lingering effects of COVID-19. The quarter was a story of two halves, with July and August delivering some initial relief and strong returns for battered investors in both share and bond markets, until September reversed course, wiping out the majority of earlier gains.
Inflation continues to run hot in most nations and central banks remain committed to raising interest rates hard and fast in order to achieve greater price stability, in spite of the risk to future economic growth. The quarter included rate hikes from almost every major central bank, and in many cases multiple hikes, leading to aggregate rate increases rarely seen in history.
Economic indicators have already begun to reflect increased business costs and a general reduction in consumer demand. While this will dampen inflationary pressures it has also started to erode firm earnings and overall global economic growth. In fact, the US formally entered a technical recession on 30 September with the official measure of real GDP growth (i.e. after adjusting for inflation) coming in negative for two consecutive quarters. To date, the job market has remained robust with unemployment near all-time lows. However, as growth weakens, the prospect of a ‘hard’ or ‘soft-landing’ hinges on the ability of firms across all industries to weather the storm and keep their labour force employed as the global economy slows.
-5.1% (hedged to NZD)
+4.7% (unhedged)
The quarter began with a sharemarket rally, as hopes of a pivot to interest rate reductions in 2023 helped raise growth prospects. These hopes were dashed following a summit of central bankers which reaffirmed their commitment to fighting inflation through higher interest rates which took place through the quarter.
The S&P 500 Index lost -4.9% for the quarter in USD terms after being up +9.2% at the end of July. Consumer discretionary was the strongest sector, led by Amazon who reported solid mid-year revenue growth and a rosy projection for the third quarter. The energy sector was also a strong performer with Exxon Mobil and Chevron Corporation advancing, despite the oil price having declined from its June peak.
Across the Atlantic, European shares were down with inflationary concerns, in particular increasing energy costs, weighing on the economy. Nord Stream 1, the main gas pipeline between Russia and Europe was ‘closed for maintenance’ for long periods, and leaks to the Nord Stream 2 under the Baltic Sea have raised concerns of energy shortages this European winter. Natural Gas prices remain heightened, trading as much as three times the 2022 opening price. The European and British central banks raised interest rates through the quarter and the Euro tumbled to a 20 year low against the US dollar. All of this contributed to losses and the S&P Europe 350 index declined -4.0% in local currency terms.
A weak New Zealand dollar and a very strong US dollar moved the USD/NZD rate by over 10% (from 0.624 to 0.559). While this now makes holidays to Hawaii more expensive for Kiwis, it also means significant foreign exchange gains for local investors holding unhedged securities. This sort of price action often occurs during times of market stress.
In New Zealand dollar terms, the MSCI World ex-Australia Index delivered a return of -5.1% for the quarter on a hedged basis, and +4.7% unhedged. This meant the rolling 12 month return for the New Zealand dollar hedged index reduced to -17.1%, while the unhedged index is down -1.0%.
Source: MSCI World ex-Australia Index (net div.)
Against the backdrop of slowing global growth, heightened inflationary pressure and rising interest rates, emerging market equities posted negative returns in the third quarter.
-1.1%
China underperformed by a significant margin which dragged the overall index down. A slump in the Chinese property market weighed on investor sentiment, and the imposition of Covid-related lockdowns in various major cities negatively impacted domestic demand. Growth-sensitive north Asian markets, such as South Korea and Taiwan, also declined as the outlook for global trade deteriorated.
Poland and the Czech Republic were also among the biggest decliners, as the Russian war in Ukraine escalated and led to an energy crisis in Europe, which in turn has contributed to accelerating inflation across Europe.
India and Indonesia posted positive returns which were well ahead of the broader index, and Brazil also performed well as Brazilian growth and inflation data both improved.
The MSCI Emerging Markets Index produced a quarterly return of -1.1% in unhedged New Zealand dollar terms, and has returned -10.9% over the trailing 12 months.
Source: MSCI Emerging Markets Index (gross div.)
+2.2%
The New Zealand market was able to hold on to early gains through the quarter with the S&P/NZX 50 Index posting a welcome gain of +2.2%. The quarter again delivered a high level of dispersion with individual company returns ranging from -30% to +25%.
Electricity ‘gentailers’ (generators/retailers) enjoyed a strong quarter with almost all of the big players advancing. Our largest company Meridian, delivered a solid gain of +5%, while infrastructure investment company Infratil returned a healthy +12.6% with news of its stake in a US renewable energy company having tripled in value.
Second largest index constituent, Fisher & Paykel Healthcare, declined -7.4% after the company advised its profits would fall sharply from the same year-ago period, when demand was extraordinarily high due to the Covid-19 pandemic.
Other larger firms, Air New Zealand (+25%) and a2 Milk (+24%), saw their share prices surge for contrasting reasons. The airline reversed losses from earlier in the year as sales continued to pick up thanks to border re-openings and the continued relaxation of the Covid-19 restrictions. Stronger than expected revenue results and a share buyback announcement boosted a2’s returns, rewarding company investors who have endured a challenging few years.
Fast food retailer Restaurant Brands NZ Ltd (owner operator of KFC, Pizza Hut, Carl’s Jr. and Taco Bell in New Zealand) was the biggest loser over the quarter. The share price fell -29% as rising food costs resulted in declining profits and the group announced the retirements of their CEO and CFO.
Source: S&P/NZX 50 Index (gross with imputation credits)
The Australian share market (ASX 200 Total Return Index) was robust through the quarter delivering +0.4% in local currency terms. Returns to unhedged New Zealand investors were better at +3.8% due to the relative strength of the Australian dollar.
+3.8%
The fate of the Australian market is largely tied to the performance of their banking and mining companies and both were, in aggregate, positive over the quarter. The 'Big Four' lenders (CBA, NAB, Westpac and ANZ) especially robust with their revenue expectations benefiting from higher interest rates. Materials giants Rio, BHP, Fortescue and South32, declined on the back of weakening global growth expectations, while smaller players, especially those involved in lithium, cobalt and other clean energy metals (eg. Pilbara Minerals Ltd: +99%, Mineral Resources Limited: +38%) thrived.
Large biotech firm CSL led the Healthcare sector up, while energy producers such as Woodside benefitted from increased demand for their oil and gas as opposed to supplies from Russia. Real estate struggled with increased borrowing costs and uncertainty about future tenant viability weighing on the sector.
Source: S&P/ASX 200 Index (total return)
-1.9%
Fixed income markets began the quarter pricing in the possibility of interest rate reductions ahead, given concerns the initial rate hikes might cool the economy too quickly. This generally pushed yields down and delivered gains for fixed income investors. However, hopes of a pivot to a loosening of policy (i.e. lower interest rates) were dashed following the Jackson Hole Economic Symposium in late August and subsequent announcements from the US Federal Reserve, in particular, reaffirming their dedication to fighting inflation.
The ’Fed’ raised US rates twice to 3.25%, a long way from the 0.25% setting in March this year. The US 10 year bond yield rose from 3.02% to 3.83% over the quarter spending some time briefly above 4%, a level not seen since 2010. Shorter duration bonds saw even higher increases as the prospect of higher rates for longer were priced in; the US 2 year bond yield closing the month at 4.27% after commencing at 2.96%. With 2 year yields ending the quarter higher than 10 year yields, this ‘inverted’ yield curve is a clear signal that investors remain wary about the future strength of the US economy. The European Central Bank (ECB) faces an even more complex task with their policy decisions affecting many nations with varying economic stability. This is compounded by the energy crisis unfolding as a result of the Russian invasion of Ukraine and Euro Area inflation reaching a record high 10% p.a. The ECB increased interest rates twice from zero to 1.25%.
In the UK, the Bank of England (‘BoE’) continued their tightening cycle with two further 50bps interest rate hikes, bringing the total to seven in the current cycle. The late quarter ‘mini-budget’ announcement by the new UK Chancellor was very poorly received and sparked a sharp selloff in UK Government Bonds (‘Gilts’) as the market priced in expectations of increased borrowing to finance these policies. The gilt market volatility spiked and the BoE was forced to provide emergency liquidity to protect bondholders, in particular large pension funds. With the market remaining highly critical of the UKs ability to finance these polices, the British pound weakened significantly.
-1.1%
In this increasing yield environment, fixed income securities were negative across the board, with longer duration bonds generally delivering worse returns. Corporate bonds also suffered, and generally underperformed government bonds as credit spreads continued to widen, especially in September.
The FTSE World Government Bond Index 1-5 Years (hedged to NZD) returned -1.9% for the quarter and is -5.4% over the trailing 12 months. The broader Bloomberg Global Aggregate Bond Index (hedged to NZD) declined returned -3.7% in the quarter and is -12.3% for the last 12 months.
Source: FTSE World Government Bond Index 1-5 Years (hedged to NZD)
The Reserve Bank of New Zealand (RBNZ) continued with its monetary tightening cycle, increasing the Official Cash Rate (OCR) twice in the quarter taking this benchmark rate to 3.00%.
In their accompanying statement, the RBNZ noted that “Global consumer price inflation has continued to rise, albeit with some recent reprieve from lower global oil prices… The outlook for global growth continues to weaken, reflecting the ongoing tightening in global monetary conditions.”
The statement also noted that monetary conditions needed to continue to tighten until the Monetary Policy Committee are confident there is sufficient restraint on spending to bring inflation back within its 1-3 percent per annum target range. With New Zealand inflation at 7.3% year-on-year in July (next announcement due 18 October), and the August unemployment rate at a very low 3.3% this continued tightening policy is consistent with the banks dual mandate to maintain price stability and contribute to maximum sustainable employment.
Similar to the effects seen overseas, rising bond yields generally resulted in negative short-term returns for bonds of all durations, with longer term and lower quality bonds declining more.
The S&P/NZX A-Grade Corporate Bond Index fell -1.1% for the quarter, while the longer duration but higher quality S&P/ NZX NZ Government Bond Index fell -1.9%.
Source: S&P/NZX A-Grade Corporate Bond Index
Unless otherwise specified, all returns are expressed in NZD. We assume Australian shares and emerging market shares are invested on an unhedged basis, and therefore returns from these asset classes are susceptible to movement in the value of the NZD. Index returns are before all costs and tax. Returns are annualised for time periods greater than one year.
The pandemic showed the power of a previously unknown virus to spread through the global population, threating health and creating economic mayhem. But few people appreciate the power of bad information to go viral in a similar way, endangering their wealth.
Globally, regulators are warning of an increase in financial disinformation and outright scams, fuelled by the growth of social media use, the failure of a traditional media gatekeepers, rising isolation during the pandemic and the human propensity to fall for get-rich-quick pitches.
The result of this means people are losing billions of dollars annually by acting on unreliable information, often spread by bad actors through digital media channels.

So just as we learned during the pandemic about maintaining good hygiene and consulting health professionals, the explosion of financial disinformation highlights the importance of sticking to sound investment principles and having a trusted financial adviser on your side.
Nearly every week, a financial regulator somewhere is alerting people to yet another scam, each seemingly more sophisticated that the previous.
In New Zealand, the Financial Markets Authority (FMA) says about 20% of the population has been targeted by investment scams. Among the latest scam is a rogue operator claiming to be NZ Super Fund, making unsolicited offers to purchase cryptocurrency assets, with a small up-front payment of course.¹
The Australian Competition and Consumer Commission (ACCC) says losses to bond investment scams nearly tripled in the first half of 2022. Consumers lost more than $20mn to imposters impersonating banks and claiming to offer government bonds or term deposits.²
Overall, scams robbed Australians of a record $2bn in 2021, the ACCC says, with investment information scams the highest loss category.
In New Zealand, the Financial Markets Authority says about 20% of the population has been targeted by investment scams. Among the latest scam is a rogue operator claiming to be NZ Super Fund, making unsolicited offers to purchase cryptocurrency assets, with a small up-front payment of course.
Indicating that this is a global phenomenon, the US Securities and Exchange Commission (SEC) recently charged 11 individuals in a fraudulent crypto pyramid and Ponzi scheme that raised more than $300mn from millions of retail investors worldwide.³
Aside from crypto scams, regulators in the UK have noted a significant rise in scammers taking advantage of the growing use during the pandemic of digital communication tools. Specifically, the Financial Conduct Authority found perpetrators are using screen-sharing software to take control of victims’ computers, steal their passwords and drain their bank accounts.⁴
These rogue operators have become so sophisticated that in some cases, when investors seek to retrieve their money, the scammers impersonate recovery agents who offer the victims help in getting their money back…in exchange for a fee.
It should be emphasised that social media in itself is not entirely a malign phenomenon. In many ways, it democratises access to information. But it also carries risks for users who can assume that all the information they find there can be trusted and reliably acted upon. Again, this highlights the value that a trusted financial adviser brings, in both acting as an information filter and understanding the needs and goals of each individual client.
We all need to remember that exercising information hygiene habits to protect our wealth is just as important as the lessons we adopted during the pandemic to protect our health. These information habits include the following:
• If an investment opportunity sounds too good to be true, you should exercise scepticism. Offers of ‘high return-low risk’ should set off alarm bells.
• Be wary of any unsolicited offer or unexpected contact, particularly if it comes at you via a social media platform.
But outright fraud is not the only information threat to investors. The demise of the gatekeeping role of traditional media and the rise of unverified and unedited social media content can encourage people into short-term trading, often based on unreliable rumours and opinions.
The ‘meme stock’ boom took off during the pandemic as people stuck at home started trading popular stocks using cheap or free trading apps, and sharing information on social media channels.
Social media has also created a new type of financial celebrity known popularly as the ‘finfluencer’. These are people, often without qualifications, who offer advice on anything from buying a house, to setting up a budget or building a global stock portfolio.
In Australia, the corporate regulator has issued a warning to social media influencers, reminding them that like any licensed financial adviser, they are still subject to the laws related to discussing financial products and services.⁵
• Tighten up your privacy controls on social media and protect yourself from identity theft. Do not share your screen with someone you have never met.
• Use trusted, established sources for financial information as much as possible.
• Limit your media consumption. Just because you can check news headlines and your portfolio 24/7 doesn’t mean that you should.
Most importantly, speak with your financial adviser who understands your needs, circumstances, goals and risk appetites.
¹ Scam Operation Targeting New Zealanders’, FMA, 31 Aug 2022
² Consumers Warned About Fake Investment Opportunities’, ACCC, 3 Aug 2022
³ ‘SEC Charges 11 Individuals in $300m Crypto Pyramid Scheme’, SEC, 1 Aug 2022
⁴ ‘Screen Sharing Scams’, Financial Conduct Authority, 5 May 2022
⁵ ‘Information for Social Media Influencers and Licensees’, ASIC, 21 March 2022
Again, this highlights the value that a trusted financial adviser brings, in both acting as an information filter and understanding the needs and goals of each individual client.
The indices used to calculate the index portfolio returns are as follows:
All returns are in New Zealand dollars
Model portfolios are designed and supplied by the Consilium Investment Committee (CIC)
Growth assets refer to investments in shares and property
Income assets refer to investments in cash and fixed interest
Model portfolio returns are net of underlying management fees, but gross of custodial and adviser monitoring fees
Long term expected returns are based on the CIC’s 2021/2022 strategic asset allocation review. These expected returns are net of underlying manager fees, but gross of custodial and adviser monitoring fees
Individual portfolios that deviate from the model portfolios will experience different returns
Past returns are no guarantee of future returns
The indices used to calculate the index portfolio returns are as follows:
Notes:
All returns are in New Zealand dollars
Model portfolios are designed and supplied by the Consilium Investment Committee (CIC)
Growth assets refer to investments in shares and property
Income assets refer to investments in cash and fixed interest
Model portfolio returns are net of underlying management fees, but gross of custodial and adviser monitoring fees
Long term expected returns are based on the CIC’s 2018/2019 strategic asset allocation review. These expected returns are net of underlying manager fees, but gross of custodial and adviser monitoring fees
Individual portfolios that deviate from the model portfolios will experience different returns
Past returns are no guarantee of future returns
The indices used to calculate the index portfolio returns are as follows:
Notes:
Due to the general lack of availability of SRI index data, this analysis compares SRI model portfolio returns with standard unscreened market indices in each asset class.
All returns are in New Zealand dollars
Model portfolios are designed and supplied by the Consilium Investment Committee (CIC)
Growth assets refer to investments in shares and property
Income assets refer to investments in cash and fixed interest
Model portfolio returns are net of underlying management fees, but gross of custodial and adviser monitoring fees
Long term expected returns are based on the CIC’s 2021/2022 strategic asset allocation review. These expected returns are net of underlying manager fees, but gross of custodial and adviser monitoring fees
Individual portfolios that deviate from the model portfolios will experience different returns
Past returns are no guarantee of future returns
The indices used to calculate the index portfolio returns are as follows:
Notes:
Due to the general lack of availability of SRI index data, this analysis compares SRI model portfolio returns with
All returns are in New Zealand dollars
Model portfolios are designed and supplied by the Consilium Investment Committee (CIC)
Growth assets refer to investments in shares and property
Income assets refer to investments in cash and fixed interest
Model portfolio returns are net of underlying management fees, but gross of custodial and adviser monitoring fees
unscreened market indices
each asset
Long term expected returns are based on the CIC’s 2018/2019 strategic asset allocation review. These expected returns are net of underlying manager fees, but gross of custodial and adviser monitoring fees
Individual portfolios that deviate from the model portfolios will experience different returns
Past returns are no guarantee of future returns
In the Partner Firm Service Agreement and Consilium Investment Committee Policy and Procedures Manual, the CIC outlined the following process for reviewing underlying investments.
All investment securities are reviewed on a quarterly basis and performance is measured against appropriate benchmark indices. Where a security’s performance is consistent with its mandate and in line with broad style and/or asset class returns, no further action will generally be taken.
However, a security may be placed on an ‘enhanced due diligence’ list, and subjected to a higher degree of scrutiny, for any of the following reasons:
- A change in the primary portfolio manager
- A significant change in the fund management company’s majority owner or ownership structure
- A more than 25% fall in the fund’s assets under management over a rolling one- year period (due to outflows, not market movement)
- Total fund assets falling below our minimum fund size thresholds at any time
- A change in the fund’s investment style, diversification and/or risk factor tilting
- An increase in the fund’s fees
- The fund exhibited quarterly tracking error versus a relevant benchmark outside its monitoring thresholds
- The fund exhibited a persistent deviation in tracking error versus a relevant benchmark outside its monitoring thresholds, measured over a rolling three-year basis, and allowing a volatility threshold appropriate for each fund
- An extraordinary event which, in the opinion of the Investment Committee, may impact on the manager’s ability to comply with the fund mandate in future
We completed the monitoring of all of the above aspects for all underlying funds in your portfolios and found the following:
1. Hedged funds managed by Dimensional: Change in key party
During the quarter, Dimensional announced they have engaged with BNP Paribas as an FX Hedge Counterparty
We will be undertaking an analysis of the flag over the coming weeks, and we are aiming to have completed papers summarising our findings within the next three months.
1. Vanguard Ethically Conscious International Shares Index Fund: Change in personnel Investigation COMPLETE. We are satisfied that the ongoing management and support of the Vanguard funds will not be materially affected by this change, due to:
1. The fact that the fund mandates are stable, well established and unchanged.
2. The investment mandates follow an index replication investment process which significantly minimises the degree of discretion any individual portfolio manager can have in the funds’ allocation.
3. At any point in time, the Head of Equity indexing is well supported by a large team of portfolio managers with many years’ experience within Vanguard.
Dimensional Five-Year Diversified Fixed Int. Trust NZD Class: 3-year underperformance to 30/Jun/2022
Investigation COMPLETE. Following our analysis of the trust – specifically, the performance attribution – the CIC is satisfied the trust’s underperformance for the three years was due to structural elements of the trust relative to its benchmark. The trusts overweights to sources of higher expected returns such as the steeper yield curves of different nations and the trust’s small corporate bond exposure, duration profile and compositional differences within each currency allocation have been the primary sources of underperformance.
Damon O'Brien Head of Investments and CIC ChairpersonDate: 24 November 2022
2.
On the October 2022 monthly adviser call, the Consilium Investment Committee reported on the third quarter of 2022. A summary is included below, and the graphics on the following pages are an excerpt of that presentation.
A full recording of this presentation is available on the Consilium Portal under ‘Quarterly Reporting’.
The September quarter offered a little respite even in the face of ongoing concerns around inflation and the war in the Ukraine. Rates continued to be hiked across developed markets, but investors began to look through these immediate changes, to find optimism and expectations that this hiking cycle may conclude soon.
Ultimately the 2022 September quarter delivered mixed returns. New Zealand, Australian and unhedged Developed Markets equities were up, while hedged Developed Markets equities, Emerged Markets equities and fixed income were down.
There was no consistent pattern in the premiums. Value was positive emerging markets, but negative in other developed markets and flat in Australia. Small caps generally outperformed large caps in all regions while the profitability tilts, term and credit were negative across the board.
Phase one classic model portfolio returns ranged from -0.4% to -0.8% for the quarter, with the 40/60 portfolio losing the least. Phase one SRI model portfolio returns ranged from -1.0% to -0.5%, with defensive portfolios losing more than aggressive portfolios. The phase one SRI suite underperformed the classic suite on the defensive end while outperforming on the aggressive.
The 2021 SAA classic model portfolio returns ranged for the quarter from -1.7% to -0.8% while SRI ranged from -2.4% to -0.4%. Defensive lost more than aggressive portfolios in both suites.
Monetary tightening cycle continues/acceler ates!


Source: globa -rates com
Monetary tightening cycle


Source: U S Bureau of Labor St atistics, U nemployment Rat e [U NRATE], ret rieved from FRED, Federal Reserve Bank of St Louis; https://fred stlouisfed org/series/U NRATE
Source: U S Bureau of Labor St atistics, U nemployment Rat e [U NRATE], ret rieved from FRED, Federal Reserve Bank of St Louis; https://fred stlouisfed org/series/U NRATE


Devel oped m ar k ets per f or m ance (MSCI l arge cap i n di ces, l ocal cu r rency) 12 m on ths
Source: https://www msci com/end-of-day-data-country


E m ergi ng m ar k ets per f or m ance (MSCI l arge cap i n di ces, l ocal cu r rency) 12 m on ths
Source: https://www msci com/end-of-day-data-country


Relative flag sizes represent approximate exposure in model portfolios


Global bonds suffer again in Q3 2022


Key:
New Zealand
Australia
Key:
Developed Markets (hedged)
Developed Markets (unhedged)
Emerging Markets
New Zealand
Australia
Developed Markets (hedged)


Developed Markets (unhedged)
Emerging Markets
Key:
New Zealand
Australia
Developed Markets (hedged)


Developed Markets (unhedged)
Emerging Markets
Sustainability overlay negligible through quarter, lagging over last 12m


Unscreened f und retur ns rel ati ve to mar k et and styl e – to end Sep 2022


Key: Positive risk tilt Negative risk tilt Positive tracking error Negative tracking error

October – December 2022
P1 Market commentary
P4 Key market movements for the quarter
P7 Why is there no Lionel Messi of managed funds?
P9 Randomness of returns
If you needed any reminder that investment markets are forward looking, then the last quarter of 2022 provided the perfect example.
Entering the final three months of the year, investors were surveying an environment that included a seemingly unending supply of negative news headlines:

"The highest inflation in four decades"
"Double-digit losses in both share markets and bond markets"
"Interest rates rising rapidly"
"Ongoing war in Ukraine"
"Continued lockdowns in the world’s second largest economy (China)"
"Elevated petrol prices"
"A slowdown in the housing market"
So, what did share markets do?
They went up. In many cases, they went up strongly.
All of the 23 developed markets in the MSCI World Index were positive over the quarter and 19 went up by at least 6% (in local currency terms). It was a similar story in emerging markets where 14 of the 24 nations in the MSCI Emerging Markets Index went up by more than 6%. The gains in emerging markets were not uniform, with six emerging nations dipping into the red for the quarter.
As indicated by these results, it was a very strong quarter for share markets. The obvious question is, why? What do the markets know that we don’t?
Markets don’t actually 'know' any more than we do. The aggregate market is made up of individuals, trusts, companies, professional investors and a wide range of institutional investors. While individual investors can sometimes react poorly to the constant media ‘noise’, and occasionally make knee-jerk decisions to sell, investors that are committed to seeking longer term investment outcomes are often better able to block out this noise and focus on the value of the underlying assets. When markets become difficult, investors that are easily influenced by emotion, uncertainty or fear are prone to making bad decisions. But for every panicked seller, we need to remember there is always a buyer (often more considered) taking an equal and opposite view.
During 2022, the prices of many good quality investments had reduced to the point that, in aggregate, market participants began to regard them as being relatively cheap. And for most long term investors, ‘quality’ plus ‘cheap’ equals an attractive investment opportunity.
Sure, there were (and are) many uncertainties in the world and the list above covers most of the big ones. But investors looking to own high quality assets for the long term, don’t need to be quite so concerned about exactly when interest rates might stop rising, when housing prices will stabilise, or even when the war in Ukraine will end.
At some point (hopefully sooner rather than later), most investors believe that all of these things will happen. And, when viewed through that lens, it’s easier to understand how the asset prices available at the beginning of the September could generally be considered attractive, regardless of what was still going on in the world around us.
... it was a very strong quarter for share markets. The obvious question is, why?
What do the markets know that we don’t?
The cost of living crisis was one of the big talking points of 2022 with prices, particularly at the supermarket and at the petrol pump, rising uncomfortably quickly at times.
Having successfully controlled inflation within their target range of 1-3% over most of the last decade (as the following chart shows), the Reserve Bank of New Zealand (RBNZ) had also very effectively managed our collective inflation expectations. That is, we all generally expected average inflation of around 2% (give or take) to persist into the future, and our spending and investment behaviours reflected those expectations.
However, following the post-Covid surge in inflation from 2021 to the current level of 7.2% pa (as at 30 September 2022), the RBNZ has become increasingly concerned about the risk of a potential ‘de-anchoring’ of our collective inflation expectations. In other words, they are concerned we may begin to expect much higher levels of inflation into the future than we had previously.
If we begin to expect higher inflation, this is likely to impact our decision making in relation to savings, investment and spending. It is also likely to impact other areas such as wage negotiations, putting pressure on wages to continue to rise higher and higher to meet rising costs. This, in turn, flames the inflationary pressures we are already facing.
If our inflation expectations were to be reset at higher levels, it presents a much bigger challenge for the RBNZ to quickly get price inflation back down towards the levels we had previously been experiencing.
Galvanised by these concerns, the RBNZ hiked New Zealand’s official cash rate (OCR) by another 0.75% at their November meeting to 4.25%, and revised their projection for the OCR to now reach a peak of 5.50% in 2023. This revised peak is a full 1.40% above the OCR forecast of 4.10% from their August announcement.
How successful the RBNZ are at curbing inflation will be something to watch this year. The chart shows that when inflation has historically reached a short term peak of 4% or more, it has subsequently fallen reasonably quickly (usually after the RBNZ has moved interest rates higher). If something similar can be achieved within the next one or two inflation updates, there is still a chance the projected OCR peak of 5.50% may not be required. For now we watch and wait for more inflation data.
It should also be noted that with much of the global economy experiencing similar inflationary issues, the coordinated interest rate rising that is occurring around the world will act as a headwind to global growth in 2023. If that headwind blows too hard for too long, it increases the chances that we will see a period of lower or negative growth in some countries/regions later this year. Clearly, a delicate balancing act for central banks around the globe.
How successful theRBNZ
are at curbing inflation will be something to watch this year.
While it wasn’t a good year overall for share markets, there was one standout performer – the energy sector. Higher oil and gas prices were a feature of the year, and it was one of several factors that contributed to rocketing global inflation. Although higher oil prices are generally bad news for consumers and travellers, it was great news for the energy industry (and it's investors). As oil prices soared, so too did the performance of many listed energy companies.
In the US, the energy sector returned more than 65% in 2022 - its best year on record - and in Europe it was also easily the leading sector, up more than 37%. These returns are even more remarkable in a year when global share markets were broadly negative.
This represented a dramatic turnaround from the depths of 2020, when the energy sector was initially the largest casualty of the global shutdown that followed the arrival of the Covid-19 pandemic.

The combination of rising interest rates and higher inflation in 2022 led not only to a bear market in shares, but the worst year for bonds in modern financial history. As interest rates rose faster and further than all early predictions, bond prices declined by significantly more than we are accustomed to. As the year wore on, it led to some investors considering potential alternative assets, particularly ones that could also help to offset traditional share market risk.
However, just as investors may be starting to lose faith in the role that bonds play within diversified portfolios, the forward-looking prospects for bonds are now better than they have been in years.
As at 30 December, the S&P/NZX A-Grade Corporate Bond Index in New Zealand had a running yield of 5.4%, while the Global Aggregate Bond Index was yielding 4.9% in New Zealand dollar hedged terms, (having touched over 5% in recent months).
With central banks now well into their interest rate tightening cycles, early signs of global inflation beginning to moderate and consumer demand seemingly softening, we have an environment for stronger bond returns than we have seen in recent years.
Also noteworthy, is that bond yields are now at levels where they have room to rally (i.e. room for bond prices to rise) if, for example, a non-inflationary macroeconomic shock were to occur and policymakers were to respond by lowering interest rates.
This more positive outlook may be tempered a little by the fact that the large government deficits that built up during the early and mid-stages of the Covid pandemic, are likely to remain elevated for some time. Even if governments are successful in taking a more frugal approach to future spending, they will need to continue selling more bonds to the private sector, and that will be happening in a financial system with reduced overall liquidity. This could limit the scope for bond yields to decline much as headline inflation falls back from peak levels.
However, even in a scenario where bond yields may remain more consistently at or around their current levels, the running yields alone, as outlined above, make them an attractive component of diversified portfolios.
The final quarter of 2022 provided a very positive end to an otherwise challenging year for investors.
It was encouraging that in spite of the lack of clarity on a number of high profile macroeconomic, and geopolitical issues, the markets were able to look through these matters and conclude that many asset prices were increasingly looking attractive.
One strong quarter in no way guarantees that the recent challenging market conditions are fully behind us, but it is a positive sign, and it takes us into the new year with more reason for optimism about the potential for better times ahead.
If the uneven transition from Covid lockdowns to a global economic reopening has shown us anything, it’s that governments, central banks and investment markets don’t have a proven playbook about how to seamlessly return the world back to its pre-Covid state. As a result, the last few years have thrown up economic outcomes and market eccentricities that have been well outside our normal expectations.
With the potential for inflation pressures to ease in 2023 and for interest rates to stabilise, it is not unreasonable to hope that some of these eccentricities also begin to moderate.
In the meantime, when markets are as difficult to navigate as they have been lately, the very best approach is always to stay invested, stay well diversified, keep costs low, and stay patient.
These returns are even more remarkable in a year when global share markets were broadly negative.
After such a challenging first three quarters of 2022, it was difficult to imagine the final quarter would deliver anything substantially different. As they say however, it is always darkest before the dawn. With no new risks surprising or alarming markets, and the impact of significant, and ongoing, tightening of monetary policy starting to be reflected in reducing rates of inflation, market participants started to consider when recent rate hikes could begin to be pared back. With tentative optimism that this rate rising cycle might end sooner than expected, November in particular saw strong performances in both shares and bonds, helping propel the final quarter of the year into the positives.
Unemployment remains low, GDP growth beat estimates, inflation has slowed (a little), and the corporate earnings reporting season was strong in many sectors, all of which contributed to positive returns.
Many central banks, in particular the US Federal Reserve (the Fed), reduced the speed at which they have been increasing interest rates. Although the Fed’s final announcement of the year warned of difficulties still to come for the economy and that the interest rates were far from their peak level in this cycle. That halted the emerging ‘Santa rally’ in early December and the last month of the year was generally weaker. Regardless, the quarter overall was generally positive across the board which helped claw back some of the market weakness from earlier in the year.
US, Eurozone and UK share markets all made strong gains in the quarter, with much of the progress made in November. Investors were generally balancing ongoing central bank caution with signs that elevated global inflation could begin to ease, and indications that the current pace of policy tightening would slow.
Gains in the UK were also helped, in part, by the country emerging from its September crisis when the former prime minister and chancellor announced huge fiscal stimulus, with little detail on how it would be funded.
In a reversal of recent price action, the New Zealand dollar was very strong through the quarter. While this was good news for anyone buying foreign currency over the holidays, it was not so good for investors holding unhedged foreign assets, as these holdings, when reported in New Zealand dollar terms, are worth less. Conversely, any NZD hedged securities were insulated from this and given the volatility in currency markets in 2022, it underlines the perils of being fully hedged, or fully unhedged, in these highly unpredictable times.
The MSCI World ex-Australia Index delivered a return of +7.1% for the quarter hedged to the NZ dollar, and -3.4% for the unhedged index. This meant the 2022 calendar year return for the New Zealand dollar hedged index ended down -17.9%, while the unhedged index returned -12.0%.
Source: MSCI World ex-Australia Index (net div.)
-3.2%
The relaxation of Covid restrictions in China and the weakening in the US dollar were the main themes in emerging markets through the quarter, driving up returns in local currencies. The headline MSCI Emerging Markets Index gained +9.8% for the quarter in US dollar terms.
Investors welcomed the relaxation of China’s Covid regulations, which helped boost optimism regarding an earlierthan-expected re-opening of the economy. This propelled the Chinese share market to a double-digit return and via its significant weight was the main driver of the strong index returns.
Poland and Hungary also rebounded strongly following months of underperformance resulting from the war in neighbouring Ukraine.
Weaker energy prices over the quarter led to Middle Eastern markets generally underperforming, with soccer world cup hosts Qatar, stumbling to a double-digit decline for the quarter.
Although these results were very good in local currency, the strong New Zealand dollar meant the MSCI Emerging Markets Index produced a quarterly return of -3.2% in unhedged New Zealand dollar terms and finished the year down -13.4%.
Source: MSCI Emerging Markets Index (gross div.)
+3.8%
The New Zealand market, as measured by the S&P/NZX 50 Index, shook off a negative October to post a welcome gain of +3.8% for the quarter. Unfortunately, the index still recorded a -11.3% return the year, remarkably, the first negative calendar year for the NZ share market since 2008.
Three of the top 15 companies by market capitalisation, made strong contributions to the overall index performance
– Fisher & Paykel Healthcare (+23.1%), a2 Milk (+20.6%) and Ebos Group (+16.7%). For a2 Milk and Fisher & Paykel in particular, both of having had their share prices under some pressure at different times throughout the Covid disruptions, it was a very pleasing result.
At the other end of the spectrum, a trio of Healthcare companies: Ryman (-36.5%), Arvida (-19.1%) and Summerset Group (-17.9%) all struggled, continuing a downward trend in the performance of each of these shares over the last 18 months.
Source: S&P/NZX 50 Index (gross with imputation credits)
The Australian share market (ASX 200 Total Return Index) closed out a relatively robust year delivering +9.4% in local currency terms through the quarter.
+2.6%
This strong quarterly result is less surprising when the two largest components of the index – BHP Group and Rio Tinto – delivered returns (in Australian dollars) of +18.5% and +24.7% respectively. Both of these mining firms have benefitted considerably from a more than 50% rally in iron ore prices since the beginning of November.
Other large index constituents include the 'Big Four' banks (CBA, NAB, Westpac and ANZ) which all delivered quarterly returns ranging from +7.0% to +16.2% as their revenue expectations continue to benefit from a higher interest rate environment.
Although the Australian share market was strong overall, the reported returns to unhedged New Zealand investors were much lower due to the relative strength of the New Zealand dollar over the quarter. For the full 2022 calendar year, the ASX 200 was slightly negative (-1.1% in AUD and -0.1% in NZD terms). However, relative to most other assets classes, the ASX was a very resilient performer during a highly challenging period for investment markets.
Source: S&P/ASX 200 Index (total return)
+0.5%
Bond markets ended the year on a mixed note in the final quarter. Government bond yields edged higher towards the end of the year, reflecting some disappointment at the still hawkish tone from some central banks, despite mounting evidence of slowing economic growth.
The US Federal Reserve raised interest rates twice during the quarter, with the Fed Funds rate ending the year at 4.5%. The Bank of England also announced two rate hikes, bringing the UK interest rate to 3.5%, while the Bank of Japan announced a modification to its yield curve control policy.
Credit spreads (the extra return investors need to encourage them to invest in bonds with lower credit quality) generally tightened across the quarter on improved risk sentiment. This resulted in US and European investment grade bonds generally outperforming government bonds.
The eurozone faced its most challenging year for inflation in its history, although indicators late in the year signalled slowing headline inflation, helped by falling energy price pressures. Nevertheless, the European Central Bank (ECB) continued to tighten monetary policy conditions and maintained its aggressive stance about future rate hikes.
Over the quarter, the US 10 year bond yield rose from 3.83% to 3.88%, with the two year bond yield rising from 4.27% to 4.43%. Germany’s 10 year bond yield increased from 2.11% to 2.56%. The UK 10 year yield decreased from 4.10% to 3.67%, after the country’s new prime minister reversed most of his predecessor’s ‘mini budget’ proposals, which had been very poorly received by the markets.
The FTSE World Government Bond Index 1-5 Years (hedged to NZD) returned +0.5% for the quarter and -4.6% for the year. The broader Bloomberg Global Aggregate Bond Index (hedged to NZD) advanced +0.8% in the quarter but declined -11.7% for the year, comfortably the worst calendar year for this asset class.
Source: FTSE World Government Bond Index 1-5 Years (hedged to NZD)
The Reserve Bank of New Zealand (RBNZ) raised the Official Cash Rate (OCR) twice more in the fourth quarter taking this benchmark rate to 4.25%.
In their 23 November statement, the RBNZ noted that to meet its policy remit of low annual inflation while supporting maximum sustainable employment, both 'actual and expected' inflation needed to decline substantially. Accordingly, given the extent to which domestic spending was contributing to higher and more persistent actual and expected inflation outcomes, the RBNZ determined that a November rate hike of 0.75% to 4.25% was warranted and revised their projections for a higher OCR peak (now targeting 5.50%) in 2023.
Similar to the broad trends overseas, the New Zealand 10 year bond yield opened the quarter at 4.29%, briefly touched 4.00% in early December, and finished the quarter at 4.55%.
The S&P/NZX A-Grade Corporate Bond Index rose +0.2% for the quarter, while the longer duration but higher quality S&P/NZX NZ Government Bond Index gained +0.1%. Both indices ended the year well down at -5.1% and -9.1% respectively.
Source: S&P/NZX A-Grade Corporate Bond Index
Unless otherwise specified, all returns are expressed in NZD. We assume Australian shares and emerging markets shares are invested on an unhedged basis, and therefore returns from these asset classes are susceptible to movement in the value of the NZD. Index returns are before all costs and tax. Returns are annualised for time periods greater than one year.
Lionel Messi coolly placed the ball on the penalty spot. He had every reason to be confident in that moment. He had, after all, scored 793 goals, and supplied 250 assists in his professional career. That's 72 minutes on average per goal contribution – more than one a game.
Nothing in his career would mean more than these next few seconds. He had already scored twice in the final of the World Cup and brilliantly assisted the third. A whole nation held their breath. Unlike players that tried to convert penalty kicks with power, Messi has learned he merely needs to kick the ball calmly to where the goalie isn’t. His stuttered approach to the ball is really an attempt to wait until the very last split second to decide where to place the ball. French goalie Hugo Lloris flinched first to his left. It was the break Messi was waiting for. He guided the penalty to the opposite corner.
Glory.
You may or may not be an international football fan. Maybe you confuse FIFA with the Fertilizer Industry Federation of Australia. But no matter who you are, you can be impressed with a player like Lionel Messi who has been so consistently great for so long. Even if you’re French, you’d have to tip your cap to Messi’s incredible career.
It's Messi’s persistent greatness that we can use as a relevant contrast to the complete lack of persistent greatness in the arena of investment management.
Messi was of course splendid at the 2022 Qatar FIFA World Cup, and football commentators all over the world were not the least surprised. Messi, 35, has been great for many years. As proof of this, look at the FIFA annual awards for the best male footballer in the world.
In the last five years, Messi was named the top footballer in 2019. He came second place twice and once third. In 2018, Messi was ranked in fifth place. This is impressive considering there are 130,000¹ professional football players worldwide, as estimated by Statista.
2021
2020
Robert Lewandowski Lionel Messi Mohamed Salah
Robert Lewandowski Christiano Ronaldo Lionel Messi
2019 Lionel Messi Virgil van Dijk Christiano Ronaldo
2018 Luka Modrić Christiano Ronaldo Mohamed Salah
2017 Christiano Ronaldo Lionel Messi Neymar
The reason Messi performs so well year after year is because of his astounding skill, mental toughness and hard work. And those attributes persist. Skill especially persists in football, chess, tennis and many other disciplines. It’s normal and intuitive to count on skill to persist.
Given this, you would naturally assume that in the world of managed funds, the best approach would be to find a skilful manager, e.g., the 'Lionel Messi of managed funds!' It would be intuitive to think finding a manager like that would greatly improve your chances of investment glory.

However, we’d argue such an approach is doomed to mediocrity or worse, failure.
Here’s a curious fact. In the world of investment management, skill, defined as manager led outperformance against a relevant benchmark, doesn’t persist. Let’s look at how we can justify that statement, and then outline the approach we take to selecting investment managers for your portfolio.
What proof do we have that in the world of investment management skill doesn’t persist? The best data comes from the United States.
In the United States, index provider Standard and Poors (S&P), has developed something called the Persistence Scorecard to study the persistence of investment performance by managed funds². S&P's Persistence
Scorecard tracks the percentage of U.S. equity funds that remained in the top-quartile (25%) or top-half (50%) of equity fund rankings over five-consecutive annual periods (through mid-2022).
In their latest report, S&P researchers highlighted a few key takeaways. Those included:
• Among all actively managed funds whose performance over the 12 months ending June 2018 placed them in the top quartile with their respective category, "not one fund in any of our reported fixed-income and equity categories remained in the top quartile in each of the four subsequent one-year periods ending in June 2022.”
• Over a five-year horizon "it was statistically near impossible to find consistent outperformance."
Performance persistence of all U.S equity funds in the top quartile on 30 June 2018
Percentage of funds that remained in the top quartile
Look at the graphic above which substantiates the statements from S&P.
You might assume this was a US only phenomenon, but S&P has found the same results in every country it tests. That includes Australia³ where S&P concluded, “Over a five-year horizon, it was statistically near impossible to find consistent outperformance,” for an Australian fund manager.
This lack of persistence is quite the contrast to Messi who was in the top 0.0038% for five consecutive years! What’s going on? Why is there such a lack of persistence amongst investment managers but such great persistence from the likes of Messi?
There are several reasons that investment manager performance doesn’t persist:
Even playing field: The net outperformance of all managers in the market is zero. Losers evenly offset winners and no one wants to lose this game.
Competition: The losers go out of business. The skilled managers that remain and go into competition with each other, eroding each other’s advantage. Some winners must subsequently become losers. The cycle repeats.
Cost: Managers with skill naturally charge higher fees and those fees offset the benefit they can bring to investors.
Bloating: Managers with skill often end up with more assets than they have good investment ideas, watering down their skill.
Luck: Many managers that initially look skilful are often just lucky. Statistically you need about 30 years of returns to distinguish luck from skill. It would be rare that a manager with skill stayed with one fund for 30 years.
Flawed measurement: Managers that boast skill often compare themselves to a benchmark with different risk attributes to what they invest in. Once you use an accurate benchmark, much of what looked like skill just melts away.
The Persistence Scorecard shows that outperformance is typically relatively short-lived, with few funds consistently outranking their peers.
If that’s the case, then how do we go about selecting funds for a portfolio? The answer is to look past manager performance and identify the key characteristics of funds which have been academically proven to provide higher returns over long periods of time. The main characteristics that affect long term performance are:
• The types of assets the fund owns – for example New Zealand shares
• How diversified is the fund
• The cost of the fund
• The average size, price and profitability of the underlying businesses the fund owns
• Does the fund keep the above attributes consistent over time
• The tax liability of the assets the fund owns Although none of the above might sound as attractive as finding a ‘Lionel Messi’ fund manager, over time these types of investment characteristics, if held calmly and (here’s our buzz word) persistently by investors, can yield excellent results.
This is the type of persistence that really matters.
https://www.statista.com/statistics/1283927/number-pro-soccer-playersby-country/#:~:text=Pro%20soccer%20players%20worldwide%20in%20 2021%2C%20by%20country&text=Of%20the%20estimated%20130%20thousand,10%20thousand%20originated%20from%20Brazil. https://www.spglobal.com/spdji/en/spiva/article/us-persistence-scorecard/ https://www.spglobal.com/spdji/en/spiva/article/australia-persistence-scorecard

The Persistence Scorecard shows that outperformance is typically relatively short-lived, with few funds consistently outranking their peers.
This table shows each asset class in our portfolios and their r eturns over the past 20 years, as well as the returns of a 50/5 0 portfolio. There is no discernible pattern in the results fro m year to year. This makes it exceptionally challenging to pick in advance, the highest performing asset class each year. To achieve more consistent results, we invest in multiple asset classes. This ensures our portfolios always have some exposure to the highest returning s ectors, whilst never being at risk of only being allocated to t he lowest returning sectors. This is known as prudent diversific ation.
Source: NZ equities: NZSX 50 Index (Gross Dividends) from Jan 2003 to Dec 2022. S&P/NZX 50 Index (Gross with Imputation) from Jan 2016 to present. Australian equities: S&P/ASX 200 Index (Total Return) Global large equities: MSCI World Index (net div., AUD) Global value equities: MSCI World Value Index (net div., AUD) Global small equities: MSCI World Small Cap Index (net div., AUD) Emerging markets equities: MSCI Emerging Markets Index from Jan 2002 to Dec 2015. MSCI Emerging Markets (Gross Div.) from Jan 2016 to present. NZ property: New Zealand Property Index (Gross Dividends) from Jan 2002 to Dec 2015
A-Grade Corporate Bond Index Jul2015 to present. Hedged global bonds: Citigroup World Government Bond Index Hedged to NZD Jan 2002 to Dec 2012.
S&P/NZX All Real Estate Index (Gross with ICs) from Jan 2016 to present. Global property: UBS Global Real Estate Index (Gross Dividends) from Jan 2002 to Dec 2014. S&P Developed REIT Index (net div.) from Jan 2015 to present. NZ fixed interest: NZX 10 Yr Govt Bonds from Jan 2002 to May 2003. ANZ Corporate A Bonds from Jun 2003 to Jun 2015. S&P/NZX
Bloomberg Barclays Global Aggregate Bond Index (hedged to NZD) Jan 2013 to present. New Zealand cash: NZ One Month Bank Bill Yields. 50/50 portfolio: portfolio returns net of manager fees, but gross of tax, adviser and platform fees. Inflation: Statistics NZ change in New Zealand Consumer Price Index from Jan 2003 to Dec 2021. *Indicative 2022 figure as at 13 January 2023.
The indices used to calculate the index portfolio returns are as follows:
All returns are in New Zealand dollars
Model portfolios are designed and supplied by the Consilium Investment Committee (CIC)
Growth assets refer to investments in shares and property
Income assets refer to investments in cash and fixed interest
Model portfolio returns are net of underlying management fees, but gross of custodial and adviser monitoring fees
Long term expected returns are based on the CIC’s 2021/2022 strategic asset allocation review. These expected returns are net of underlying manager fees, but gross of custodial and adviser monitoring fees
Individual portfolios that deviate from the model portfolios will experience different returns
Past returns are no guarantee of future returns
The indices used to calculate the index portfolio returns are as follows:
All returns are in New Zealand dollars
Model portfolios are designed and supplied by the Consilium Investment Committee (CIC)
Growth assets refer to investments in shares and property
Income assets refer to investments in cash and fixed interest
Model portfolio returns are net of underlying management fees, but gross of custodial and adviser monitoring fees
Long term expected returns are based on the CIC’s 2018/2019 strategic asset allocation review. These expected returns are net of underlying manager fees, but gross of custodial and adviser monitoring fees
Individual portfolios that deviate from the model portfolios will experience different returns
Past returns are no guarantee of future returns
The indices used to calculate the index portfolio returns are as follows:
Notes:
Due to the general lack of availability of SRI index data, this analysis compares SRI model portfolio returns with standard unscreened market indices in each asset class.
All returns are in New Zealand dollars
Model portfolios are designed and supplied by the Consilium Investment Committee (CIC)
Growth assets refer to investments in shares and property
Income assets refer to investments in cash and fixed interest
Model portfolio returns are net of underlying management fees, but gross of custodial and adviser monitoring fees
Long term expected returns are based on the CIC’s 2021/2022 strategic asset allocation review. These expected returns are net of underlying manager fees, but gross of custodial and adviser monitoring fees
Individual portfolios that deviate from the model portfolios will experience different returns
Past returns are no guarantee of future returns
The indices used to calculate the index portfolio returns are as follows:
Notes:
Due to the general lack of availability of SRI index data, this analysis compares SRI model portfolio returns with standard unscreened market indices in each asset class.
All returns are in New Zealand dollars
Model portfolios are designed and supplied by the Consilium Investment Committee (CIC)
Growth assets refer to investments in shares and property
Income assets refer to investments in cash and fixed interest
Model portfolio returns are net of underlying management fees, but gross of custodial and adviser monitoring fees
Long term expected returns are based on the CIC’s 2018/2019 strategic asset allocation review. These expected returns are net of underlying manager fees, but gross of custodial and adviser monitoring fees
Individual portfolios that deviate from the model portfolios will experience different returns
Past returns are no guarantee of future returns
In the Partner Firm Service Agreement and Consilium Investment Committee Policy and Procedures Manual, the CIC outlined the following process for reviewing underlying investments.
All investment securities are reviewed on a quarterly basis and performance is measured against appropriate benchmark indices. Where a security’s performance is consistent with its mandate and in line with broad style and/or asset class returns, no further action will generally be taken.
However, a security may be placed on an ‘enhanced due diligence’ list, and subjected to a higher degree of scrutiny, for any of the following reasons:
- A change in the primary portfolio manager
- A significant change in the fund management company’s majority owner or ownership structure
- A more than 25% fall in the fund’s assets under management over a rolling one- year period (due to outflows, not market movement)
- Total fund assets falling below our minimum fund size thresholds at any time
- A change in the fund’s investment style, diversification and/or risk factor tilting
- An increase in the fund’s fees
- The fund exhibited quarterly tracking error versus a relevant benchmark outside its monitoring thresholds
- The fund exhibited a persistent deviation in tracking error versus a relevant benchmark outside its monitoring thresholds, measured over a rolling three-year basis, and allowing a volatility threshold appropriate for each fund
- An extraordinary event which, in the opinion of the Investment Committee, may impact on the manager’s ability to comply with the fund mandate in future
We completed the monitoring of all of the above aspects for all underlying funds in your portfolios and found the following:
1. Funds managed by Dimensional: Change in management
Glenn Crane, Chairman and CEO of DFA Australia Limited has announced he will step down from his CEO role at the end of 2022. Glenn will be replaced as CEO by Bhanu Singh from the 1st of January 2023. Glenn Crane will continue to serve as an Executive Chairman.
We will be undertaking an analysis of the flag over the coming weeks, and we are aiming to have completed papers summarising our findings within the next three months.
1. Funds managed by Dimensional: Change in key party
Investigation COMPLETE. During the quarter DFA engaged with BNP Paribas as an FX Hedge Counterparty. We remain satisfied that DFA's approach to undertaking due diligence on counter parties is thorough and sufficient.
Damon O'Brien Head of Investments and CIC ChairpersonDate: 24 February 2023
On the January 2023 monthly adviser call, the Consilium Investment Committee reported on the fourth quarter of 2022. A summary is included below, and the graphics on the following pages are an excerpt of that presentation.
A full recording of this presentation is available on the Consilium Portal under ‘Quarterly Reporting’.
The dominant themes for the year continued in Q4 with all eyes on economic data releases and the central banks’ actions and rhetoric guiding market direction.
The quarter started well as both equities and fixed income accumulated gains as market participants priced in optimism that this period of hefty rate rises was almost over. However, in November the US federal reserve halted any ‘Santa rally’ in its tracks with comments around the ongoing battle against inflation shot yields up again and weakened equities.
The gains at the start of the period helped the quarter close higher with gains across the risk spectrum. Value again outperformed, closing out a strong year for risk tilts, while the New Zealand dollar reversed prior weakness, somewhat limiting gains on unhedged foreign equities.
After taking a battering in earlier quarters, fixed income delivered small gains through the quarter but closed out the year down significantly.
Yields volatile through quarter, up immensely for the year
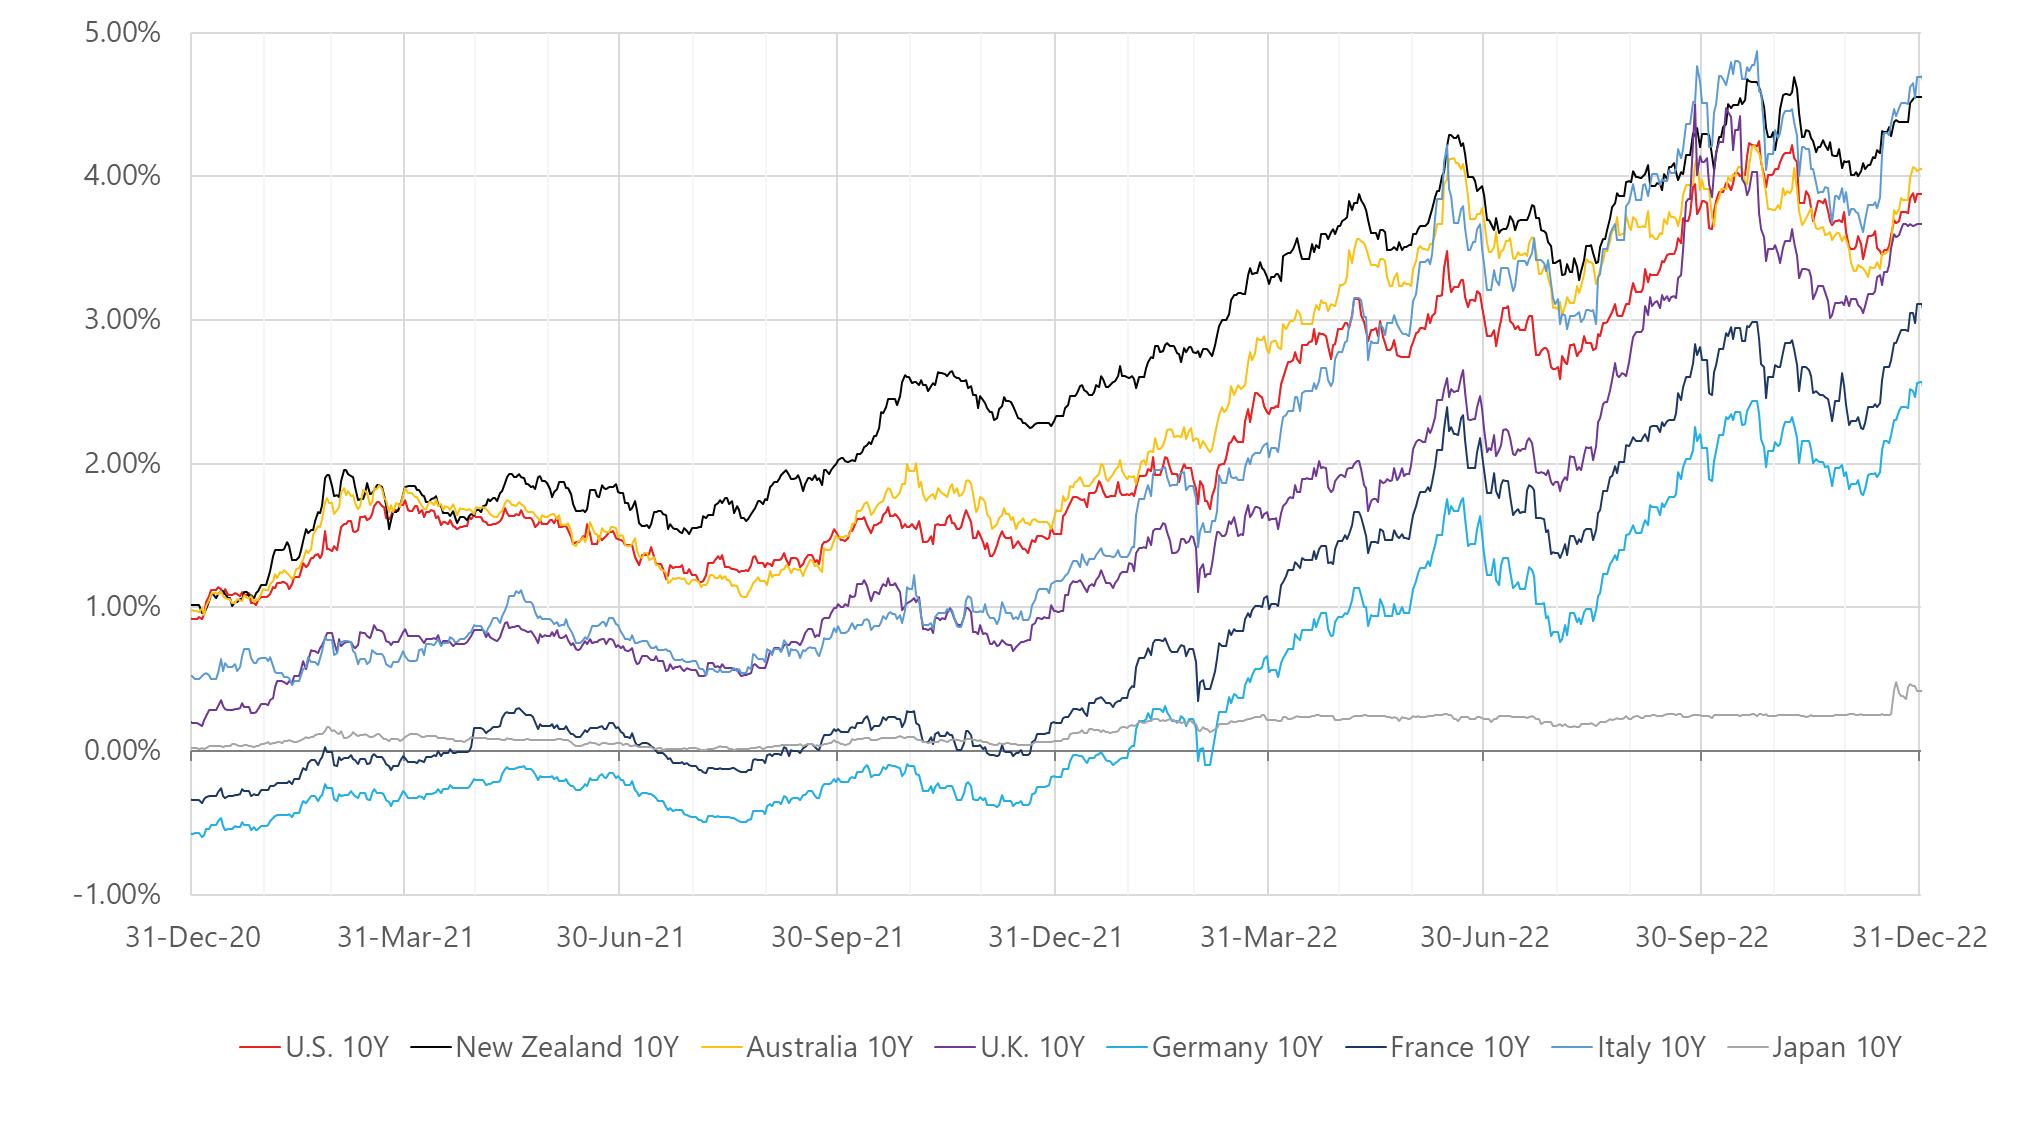
Devel oped m ar k ets per f or m ance (MSCI l arge cap i n di ces, l ocal cu r rency) 12 m on ths
Source: https://www msci com/end-of-day-data-country
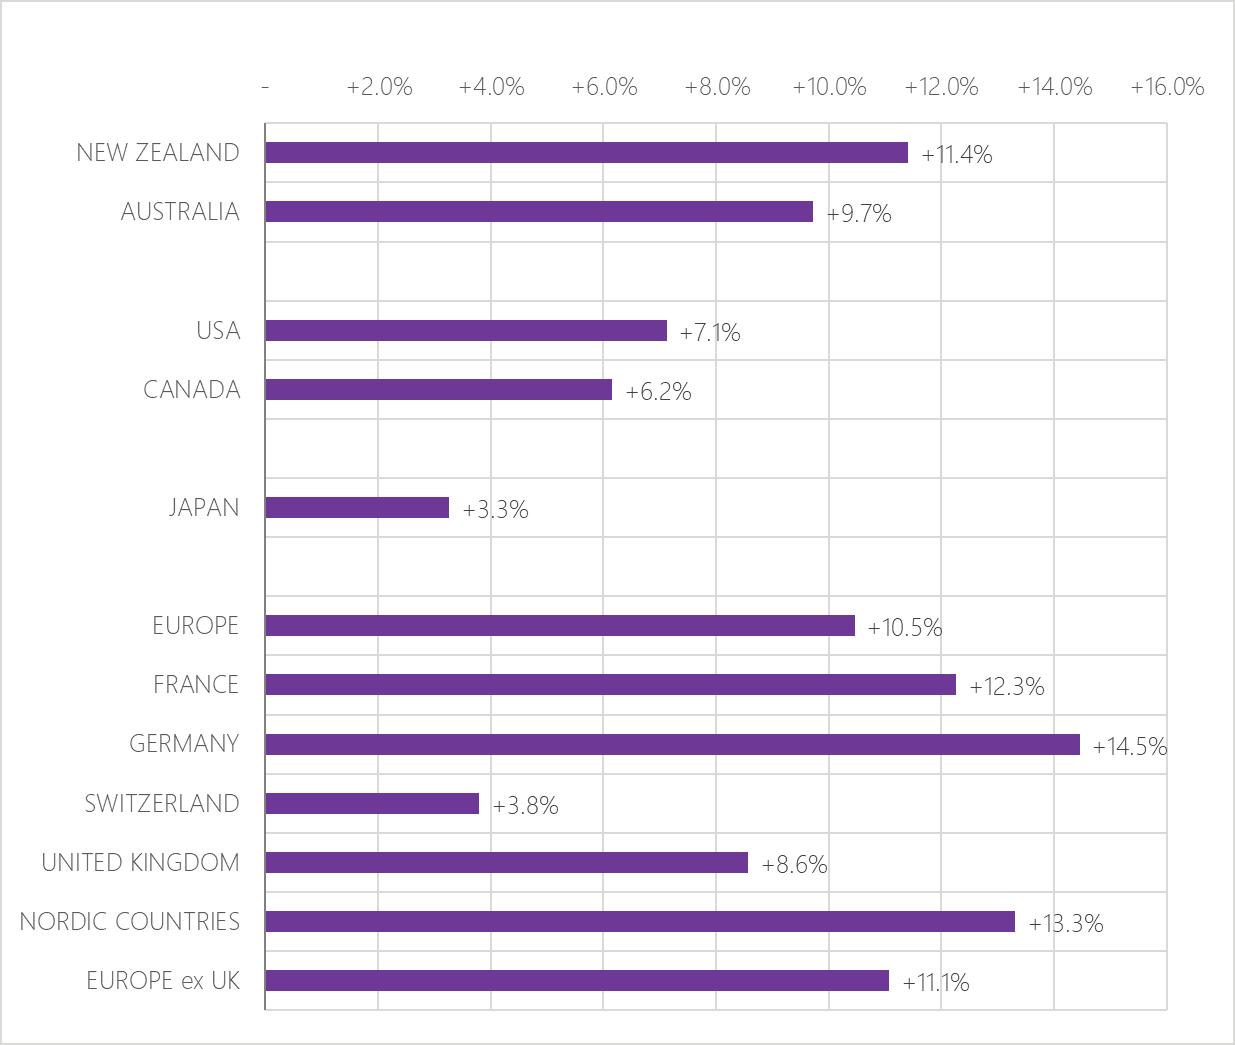
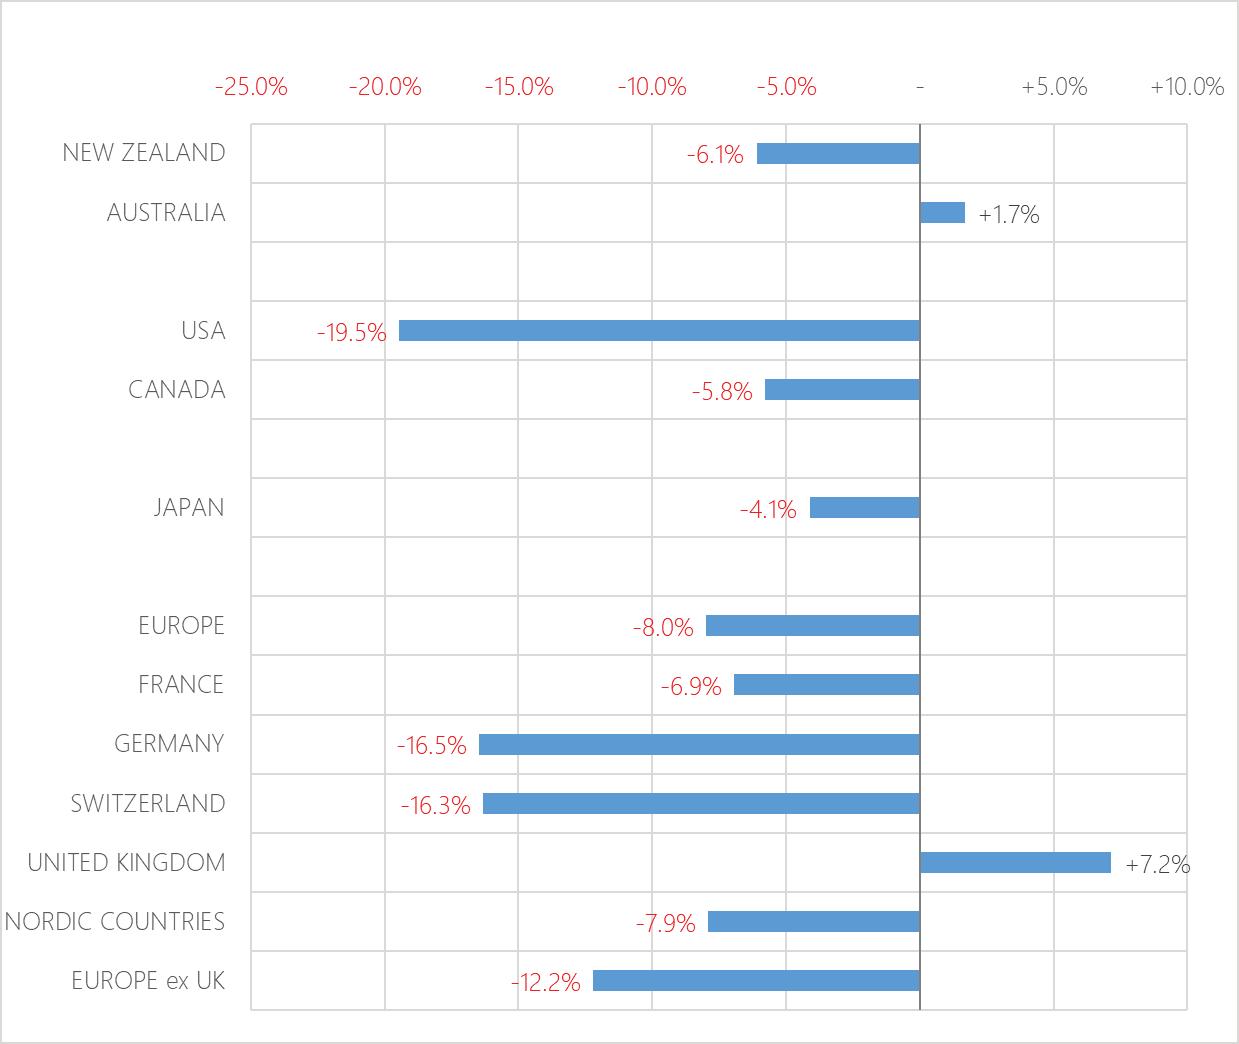
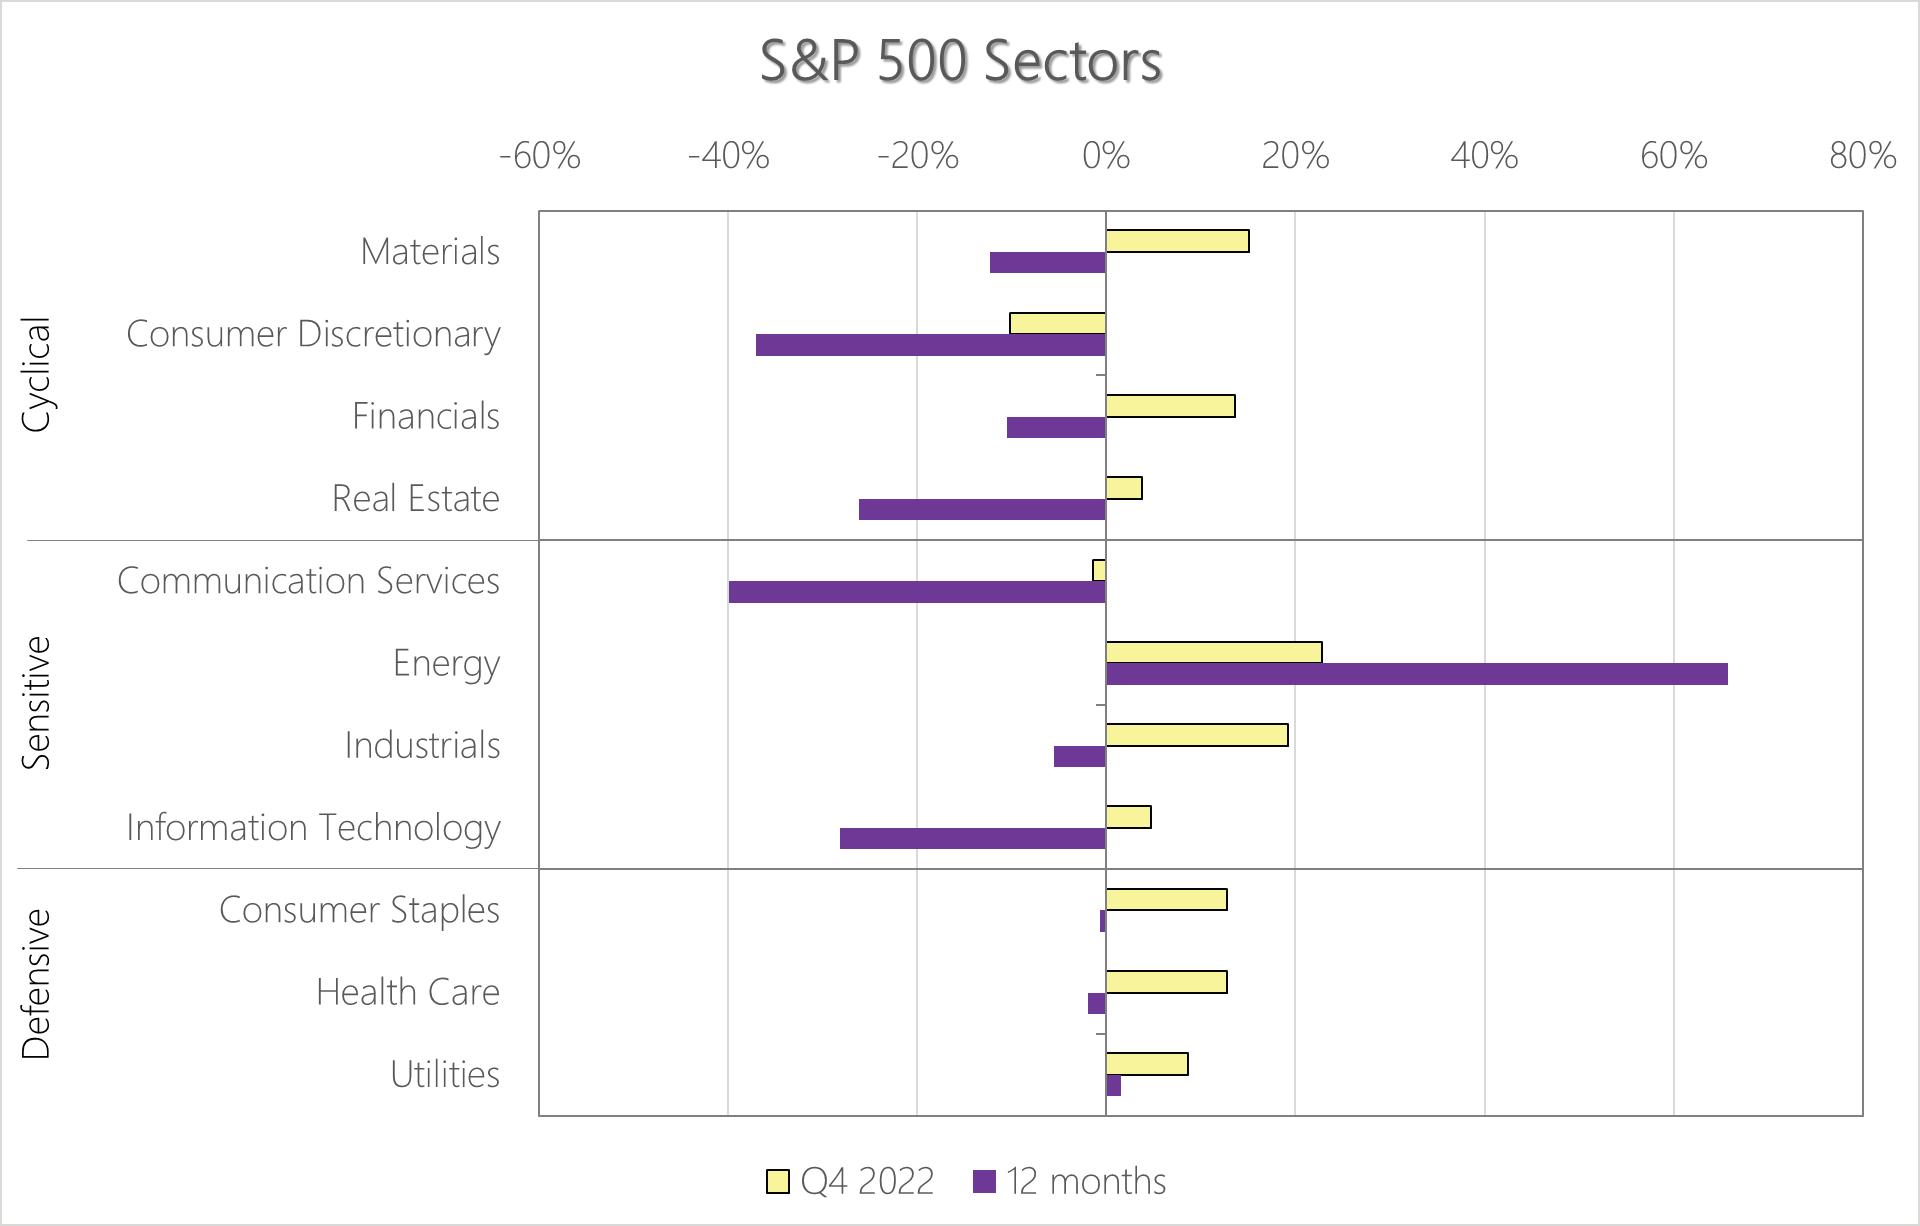

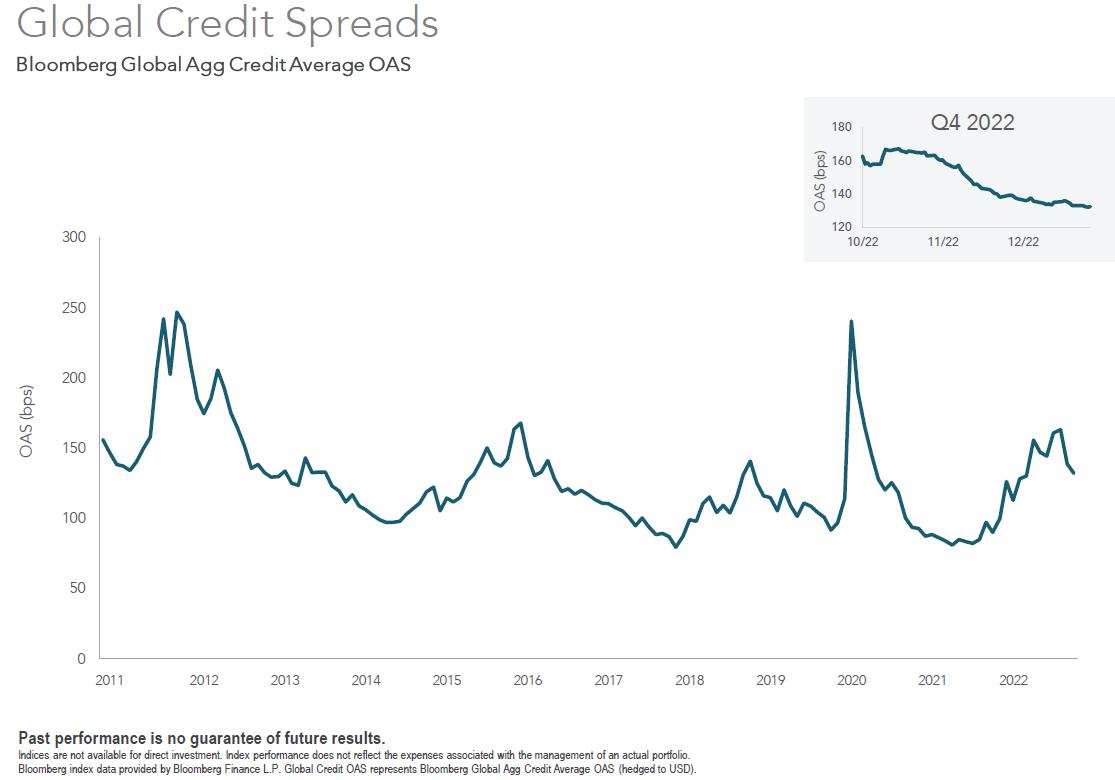

m ergi ng m ar k ets per f or m ance (MSCI l arge cap i n di ces, l ocal cu r rency)
Source: https://www msci com/end-of-day-data-country
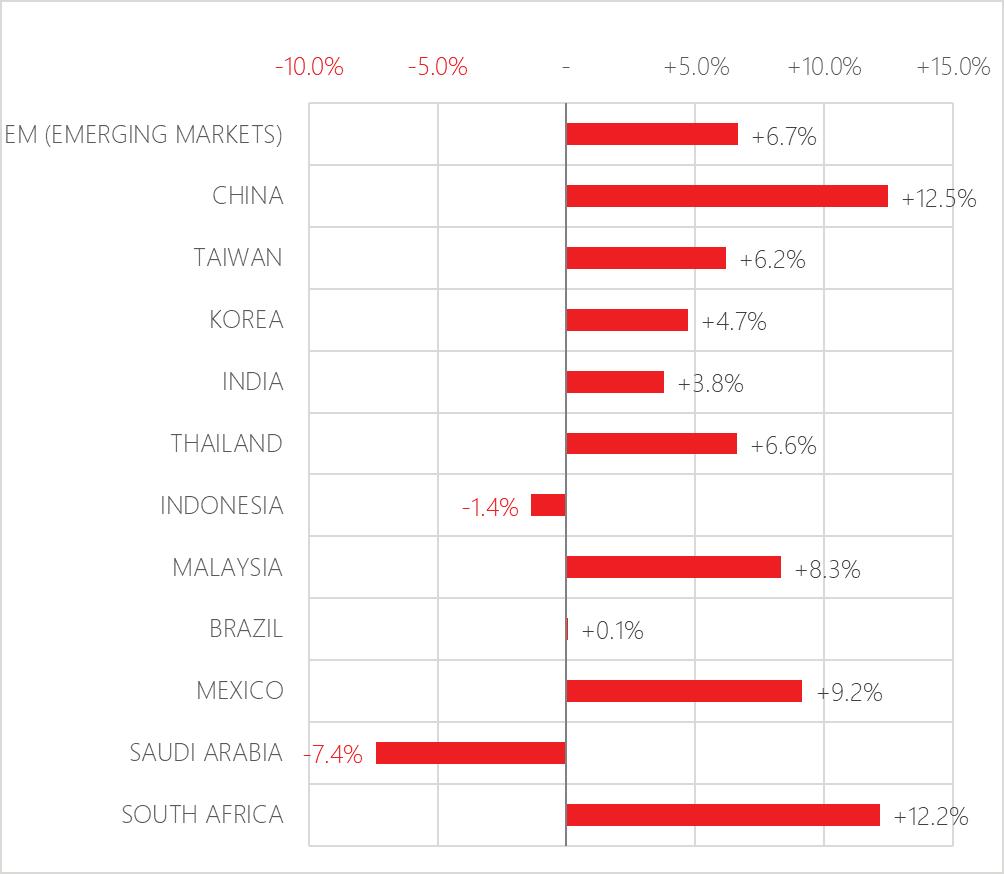
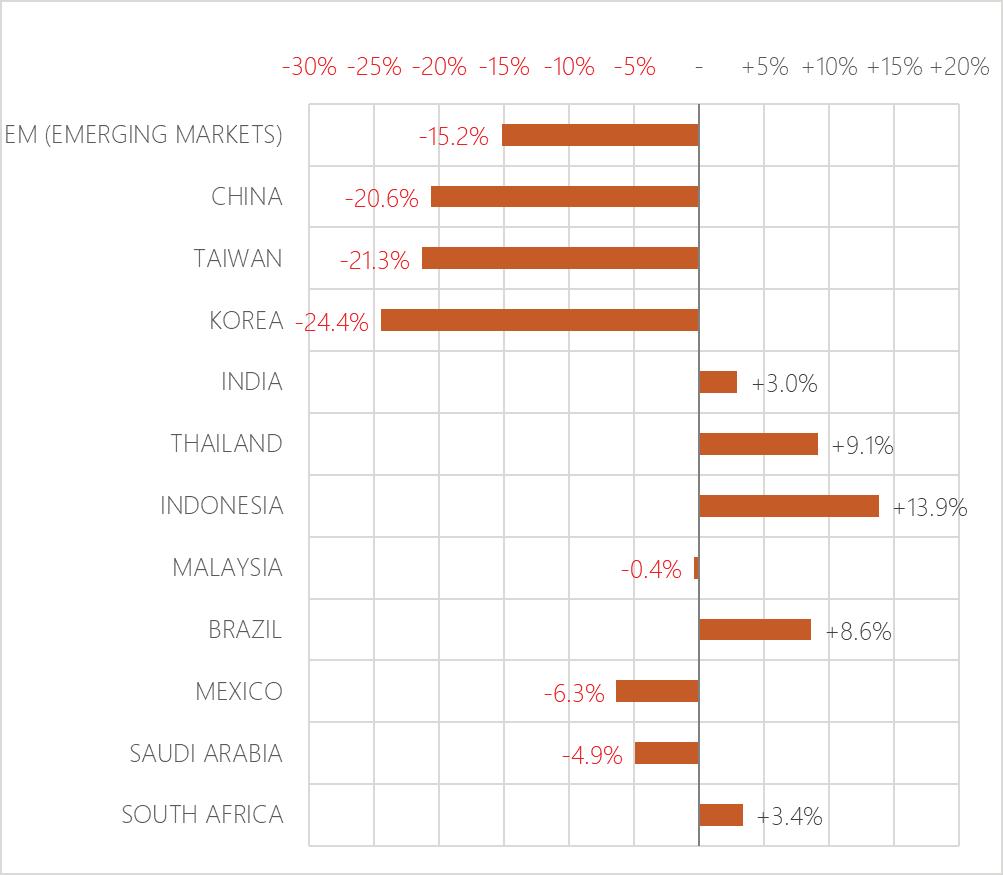
Relative flag sizes represent approximate exposure in model portfolios
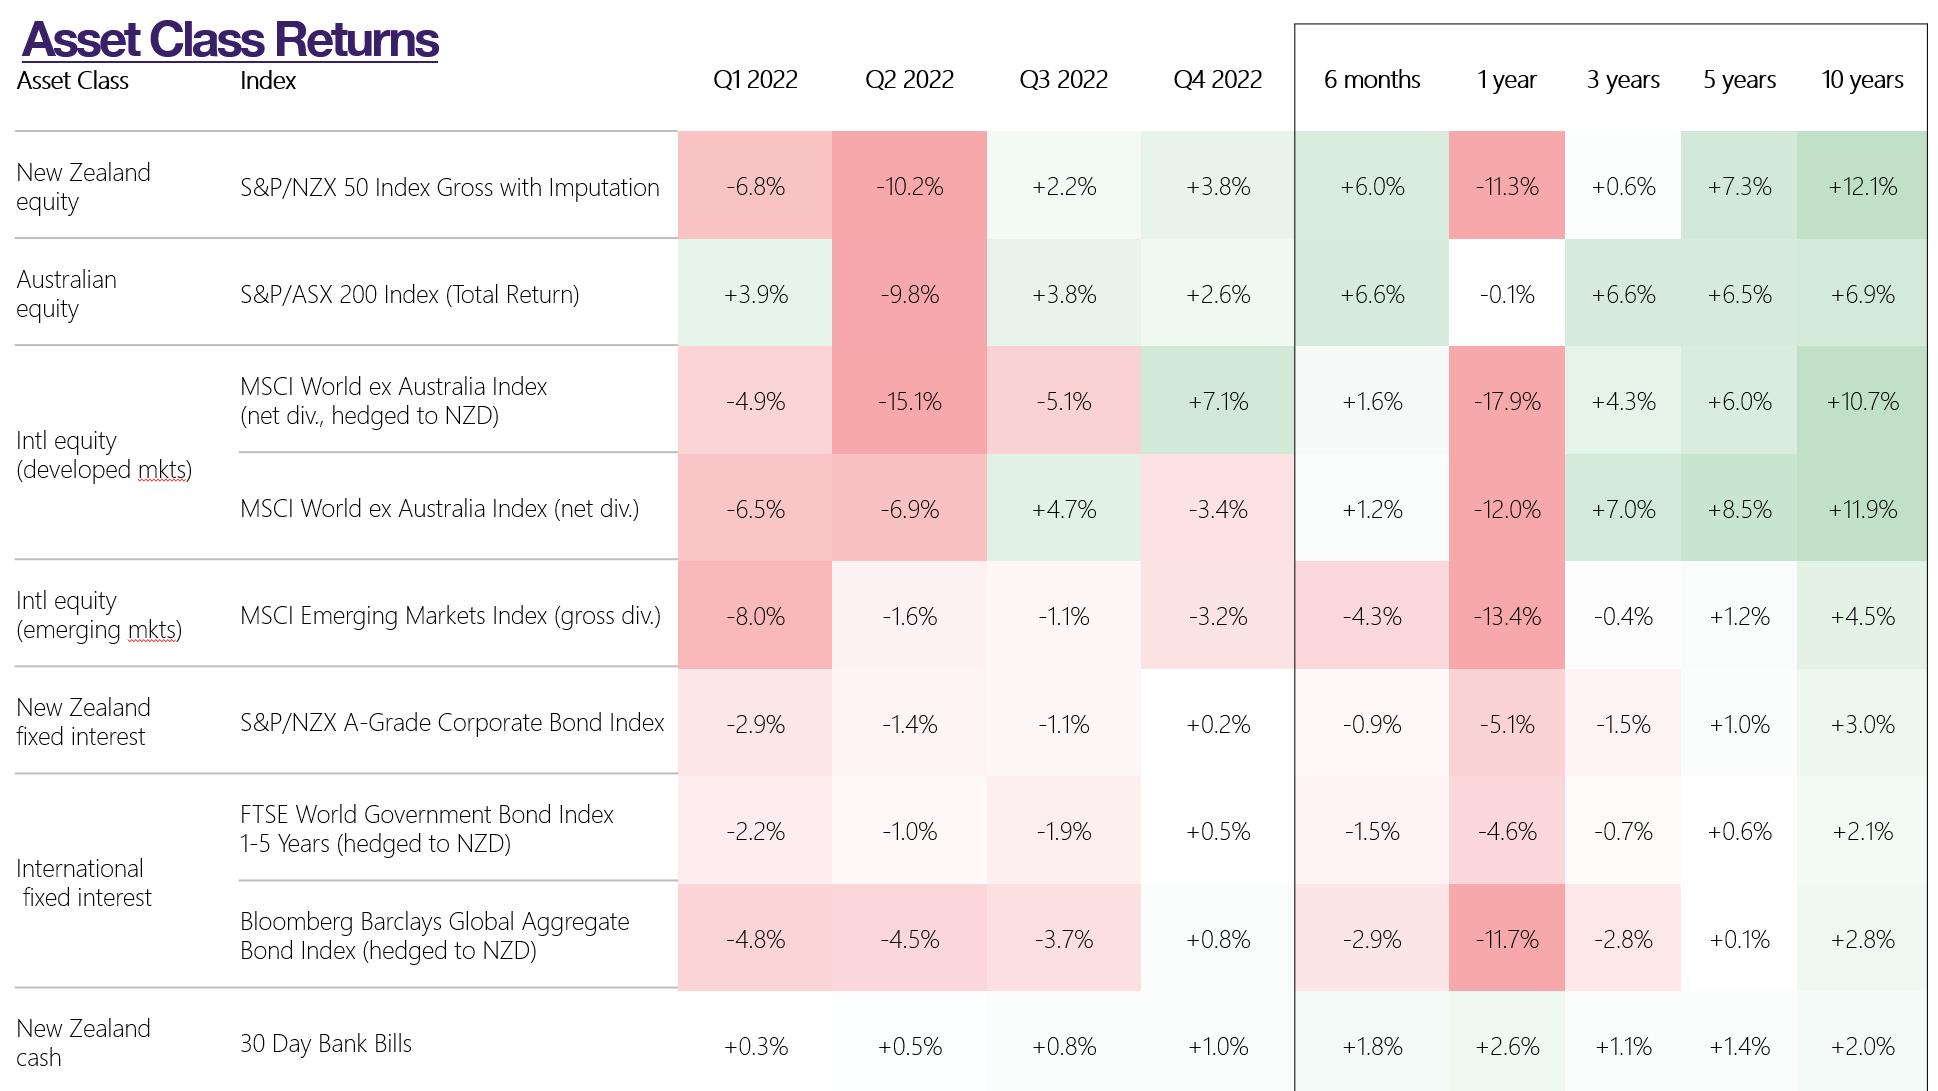
12 m on ths
Global bonds were UP in Q4 2022!
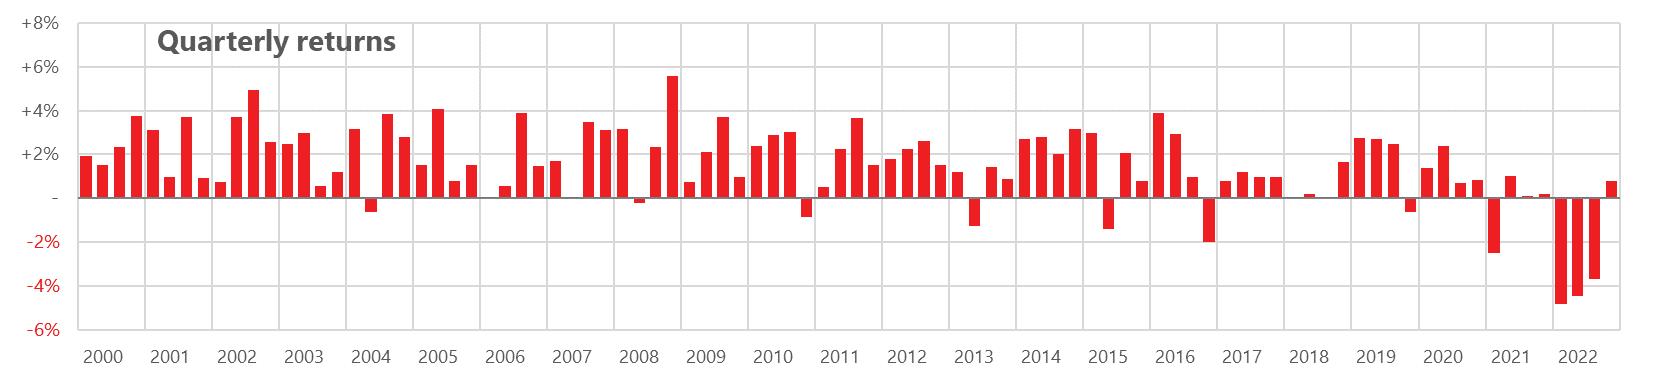
Key:
New Zealand
Australia
Developed Markets (hedged)
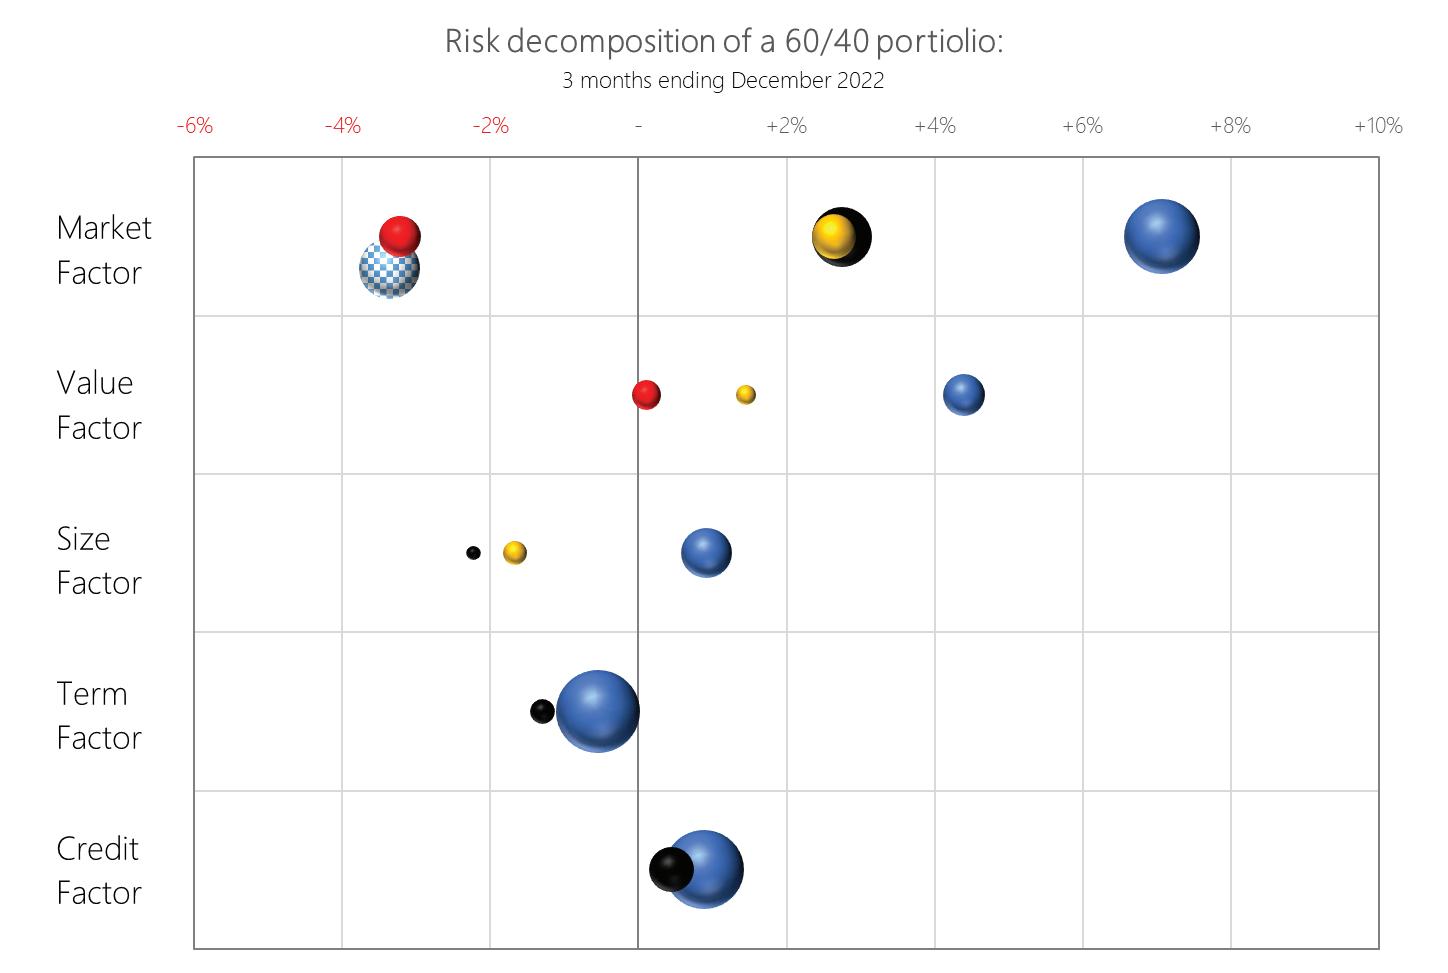
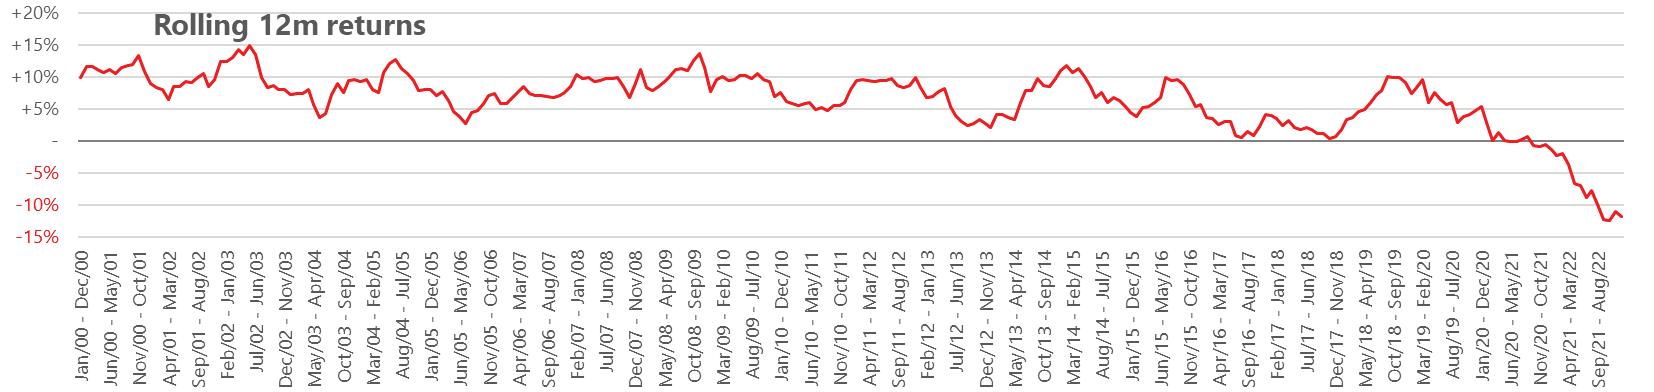
Developed Markets (unhedged)
Emerging Markets
Key:
New Zealand
Australia
Key:
Developed Markets (hedged)
Developed Markets (unhedged)
Emerging Markets
New Zealand
Australia
Developed Markets (hedged)
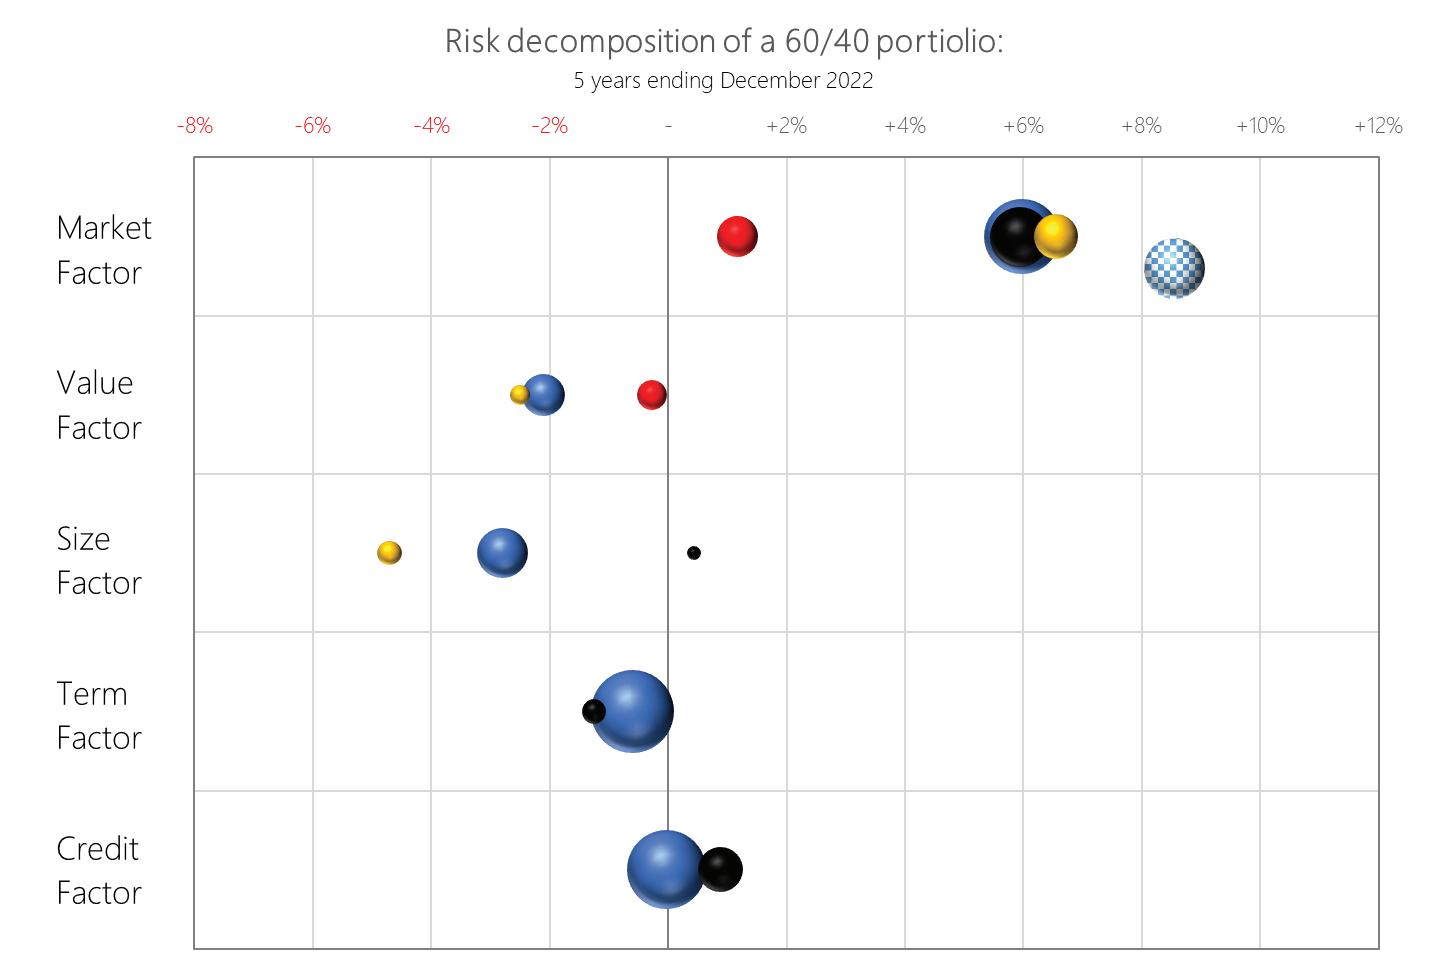
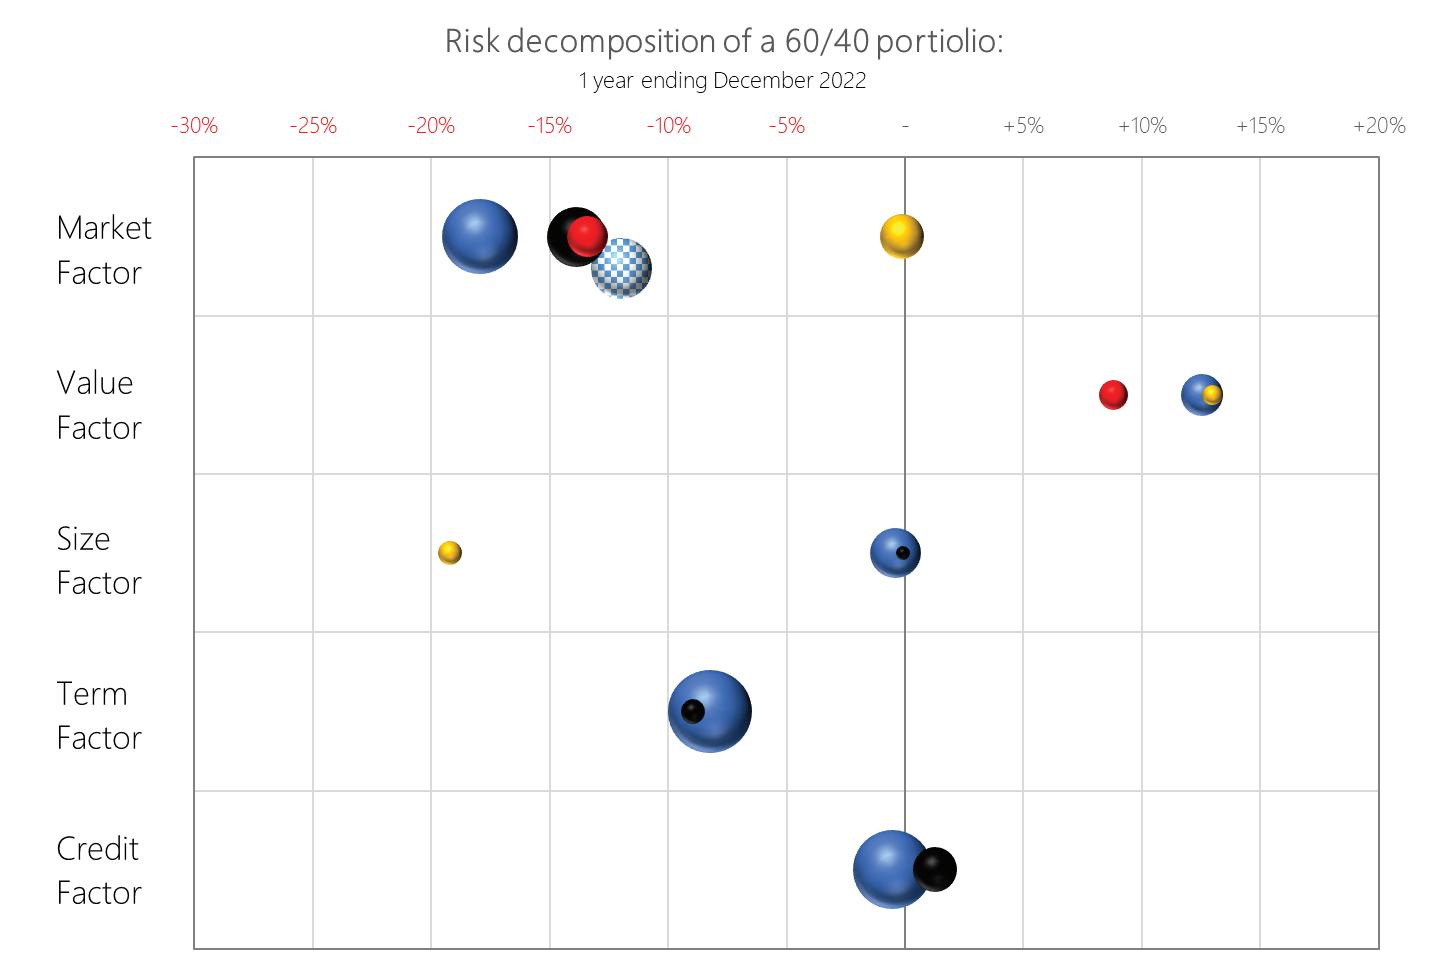
Developed Markets (unhedged)
Emerging Markets
DM sustainability overlay negative through quarter, lagging over last 12m
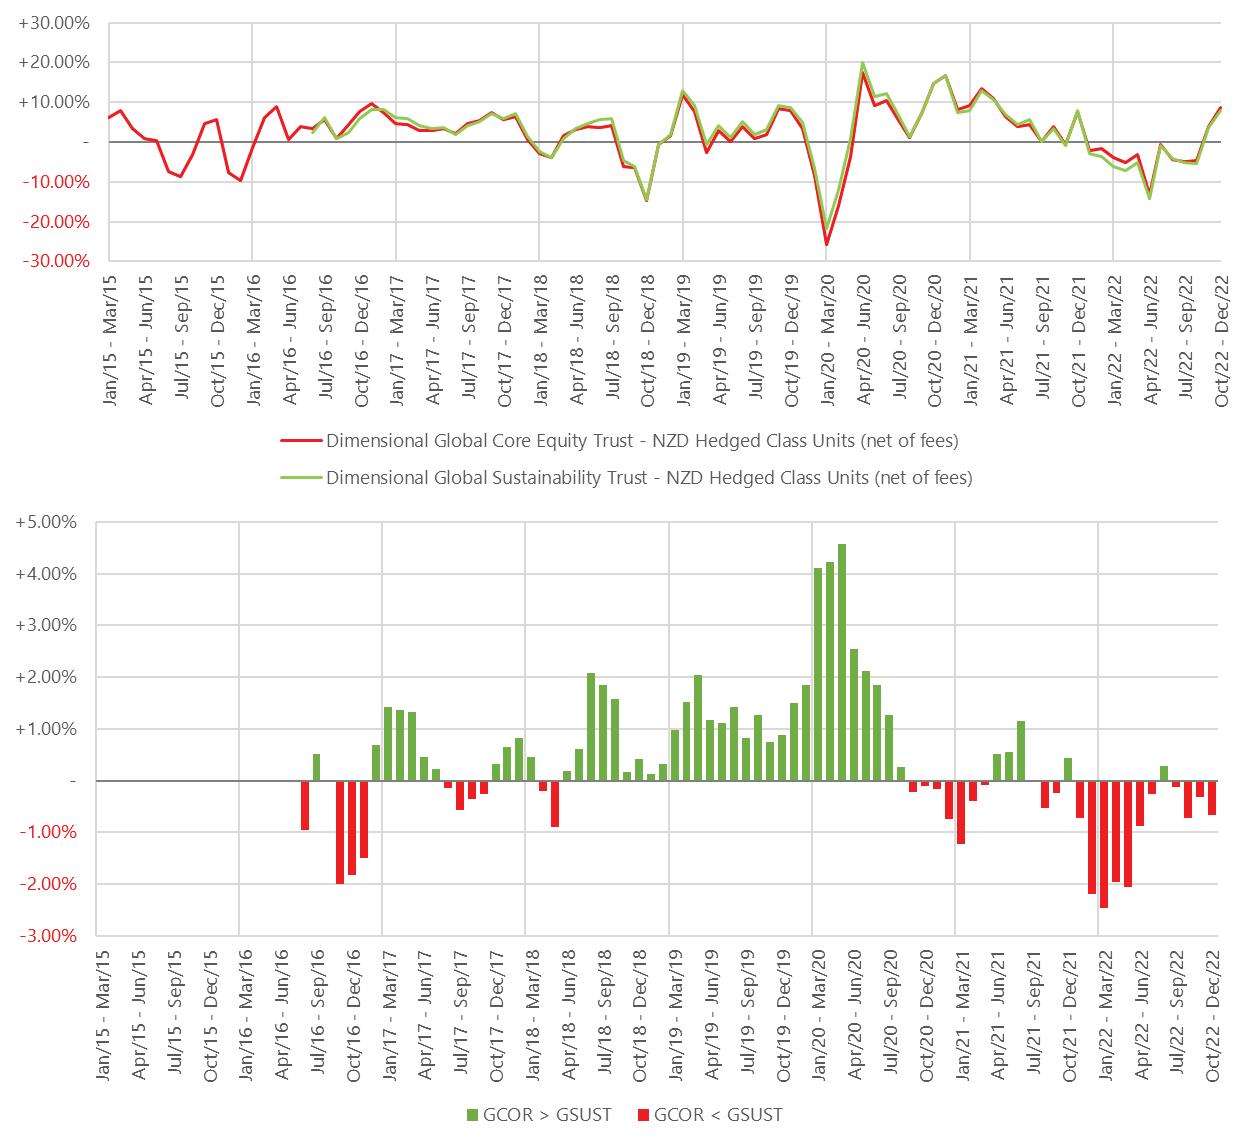
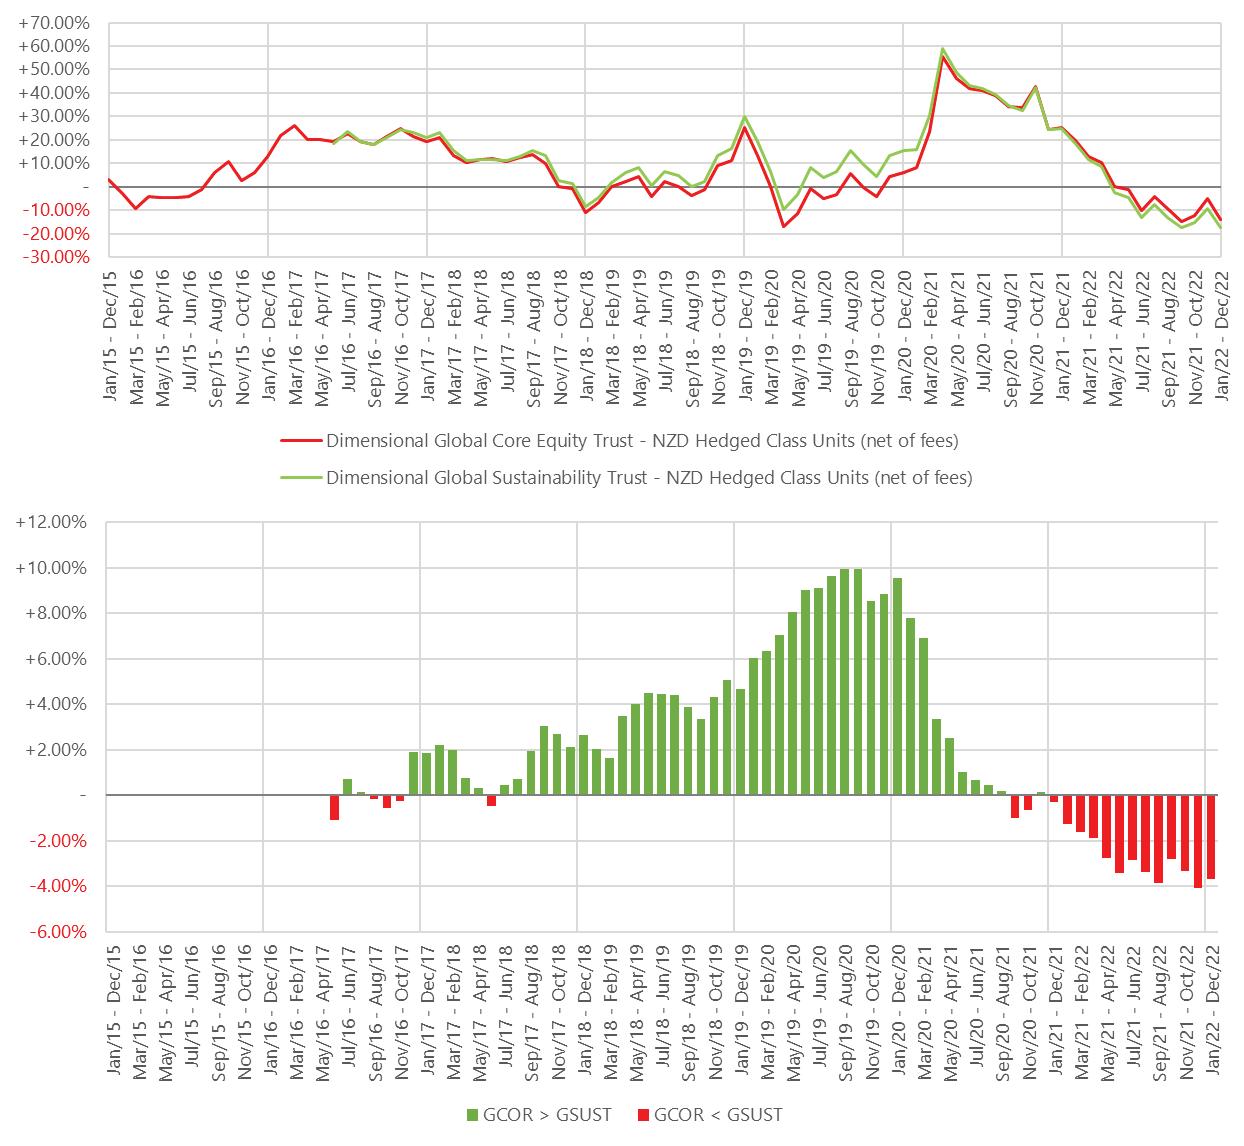
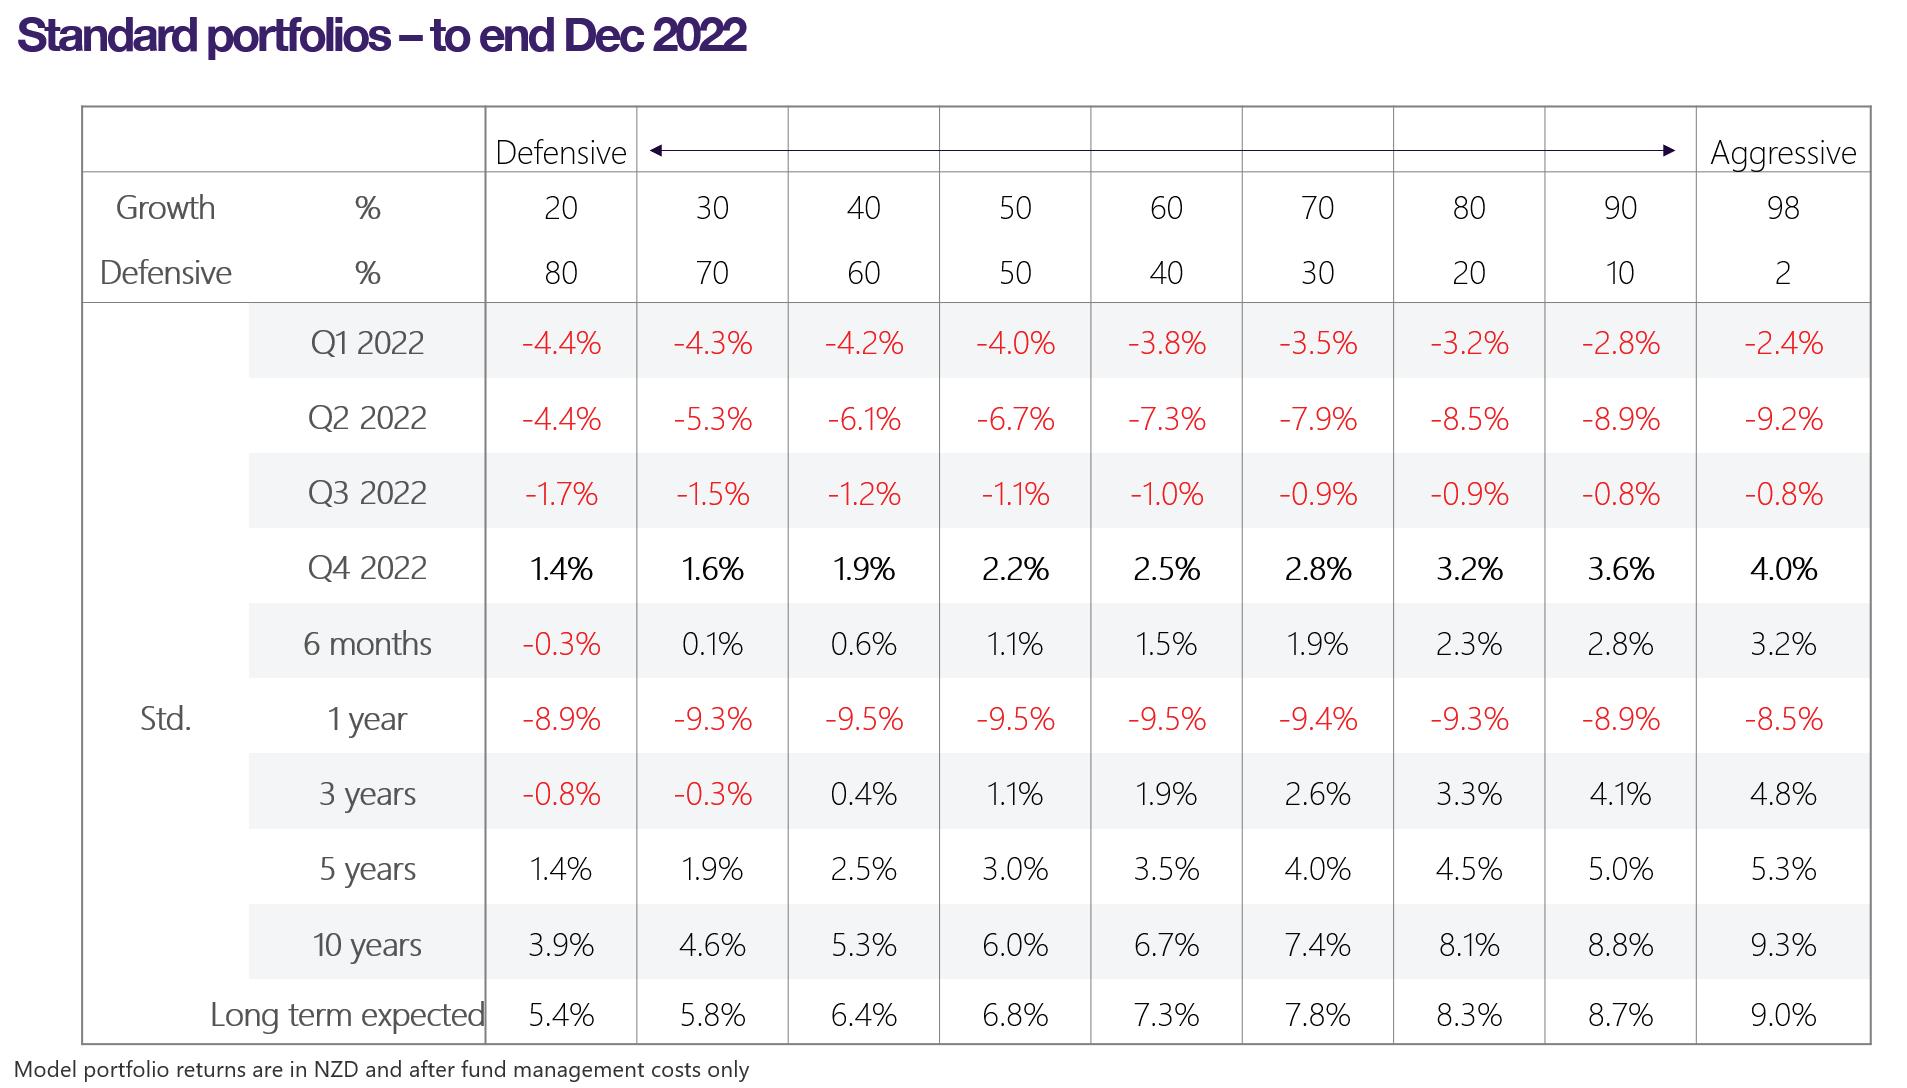
Rolling 3m returns
Rolling 12m returns
Aust sustainability overlay negative through quarter, lagging over last 12m
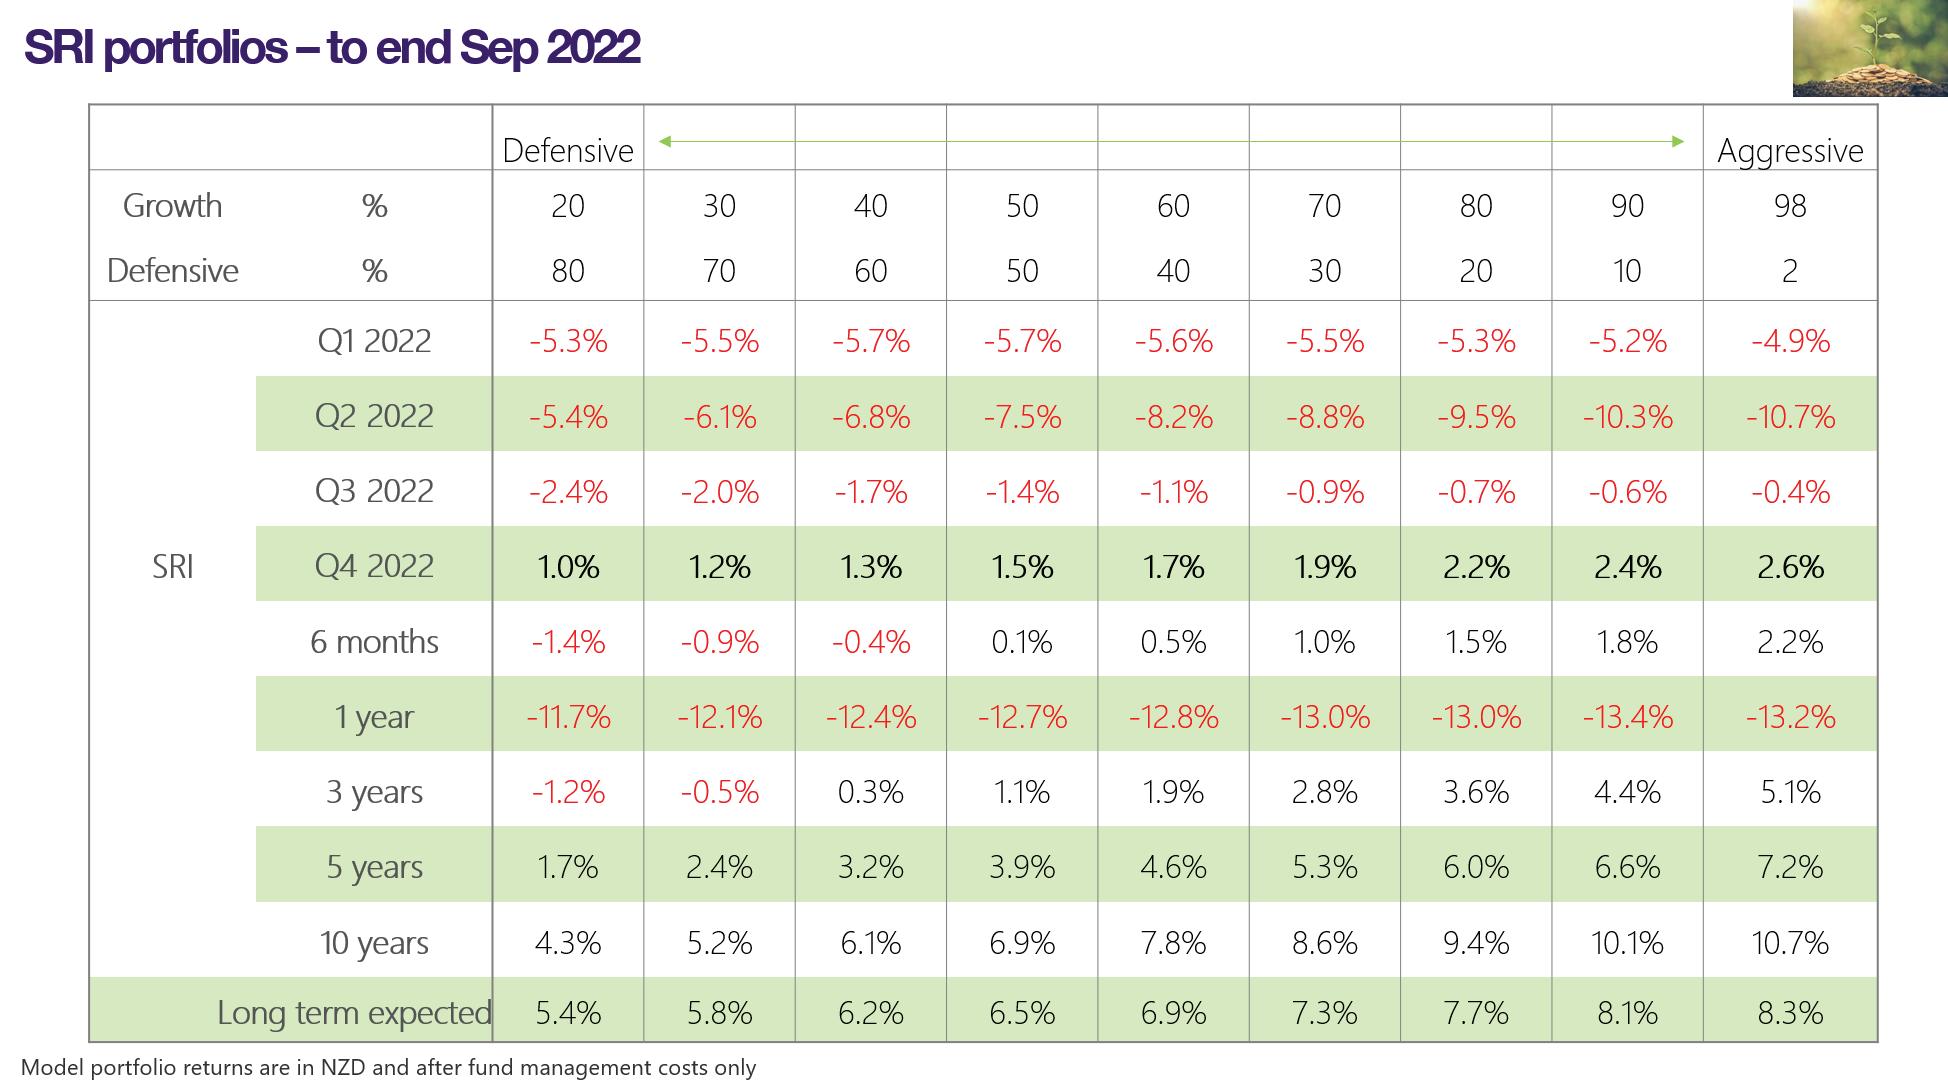
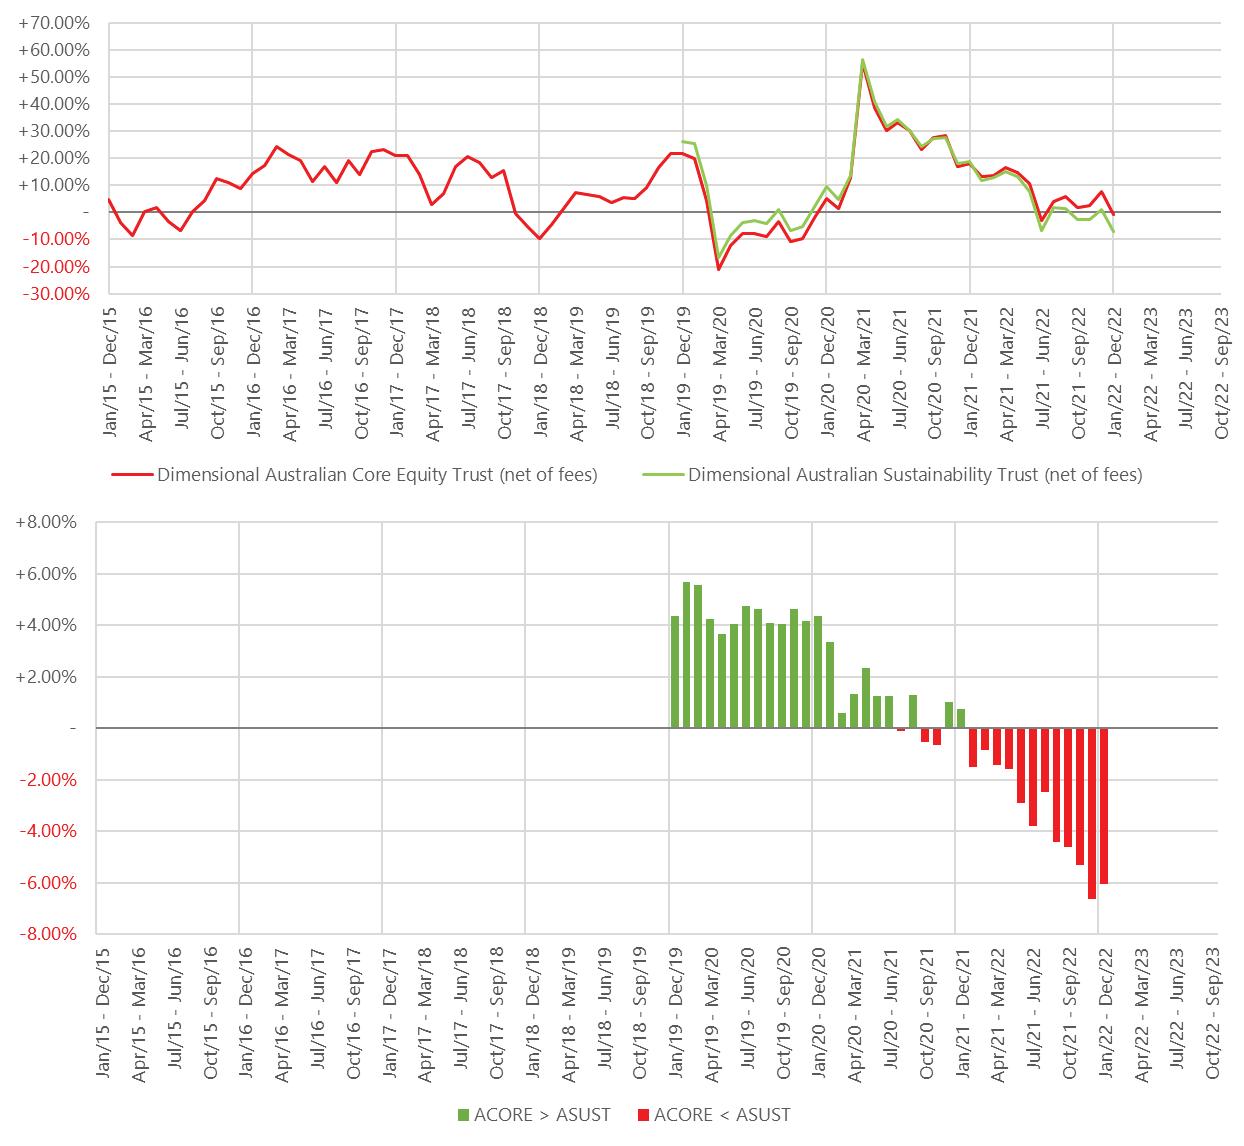
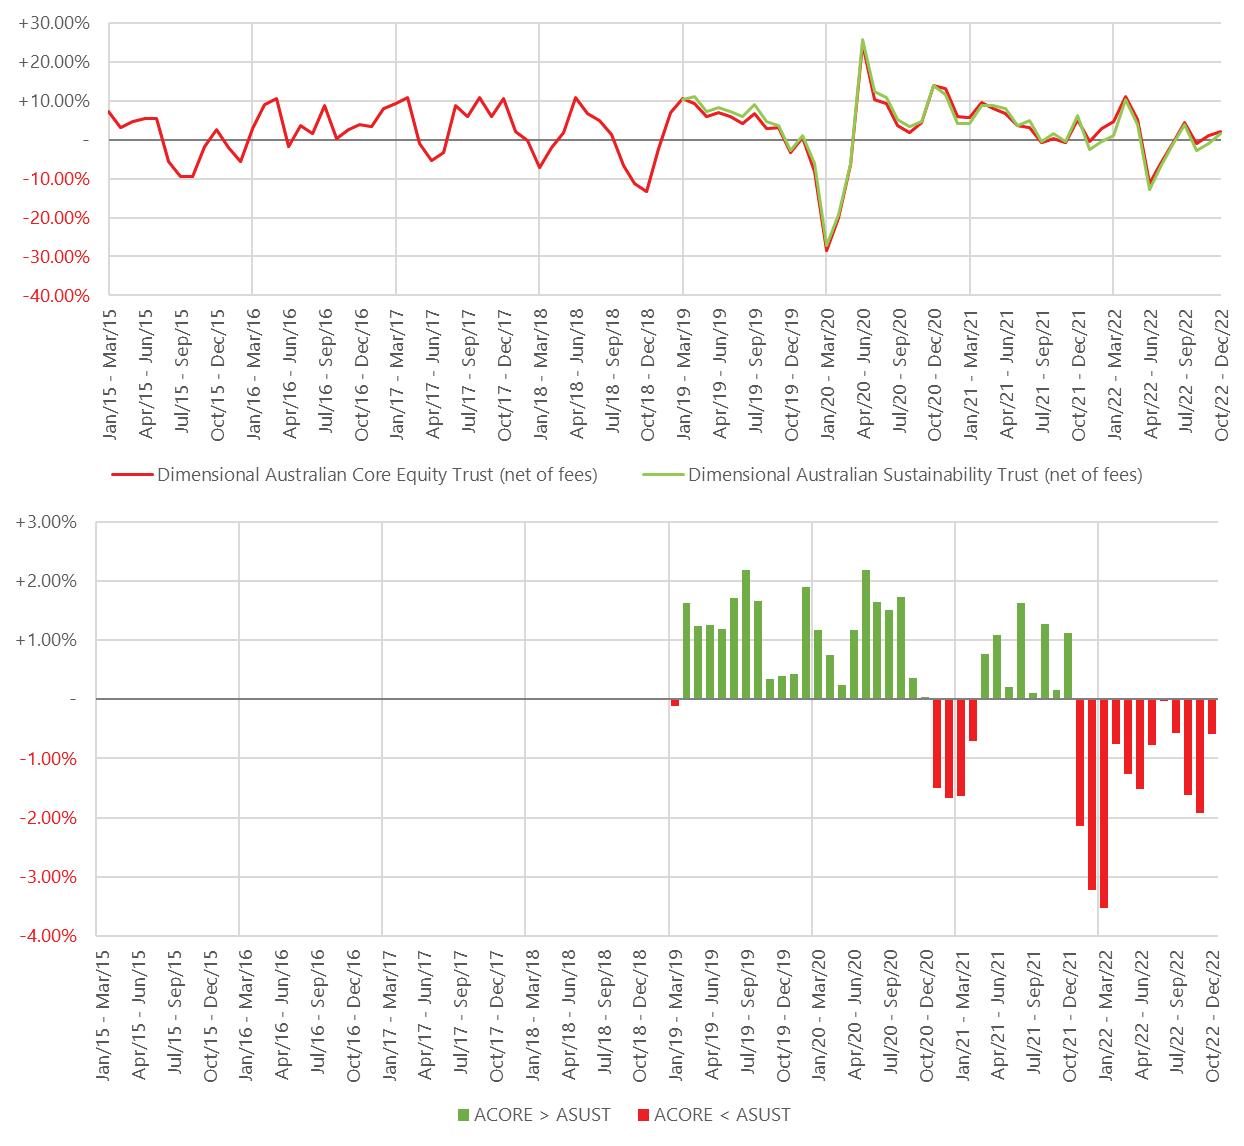
Phase One models lost less
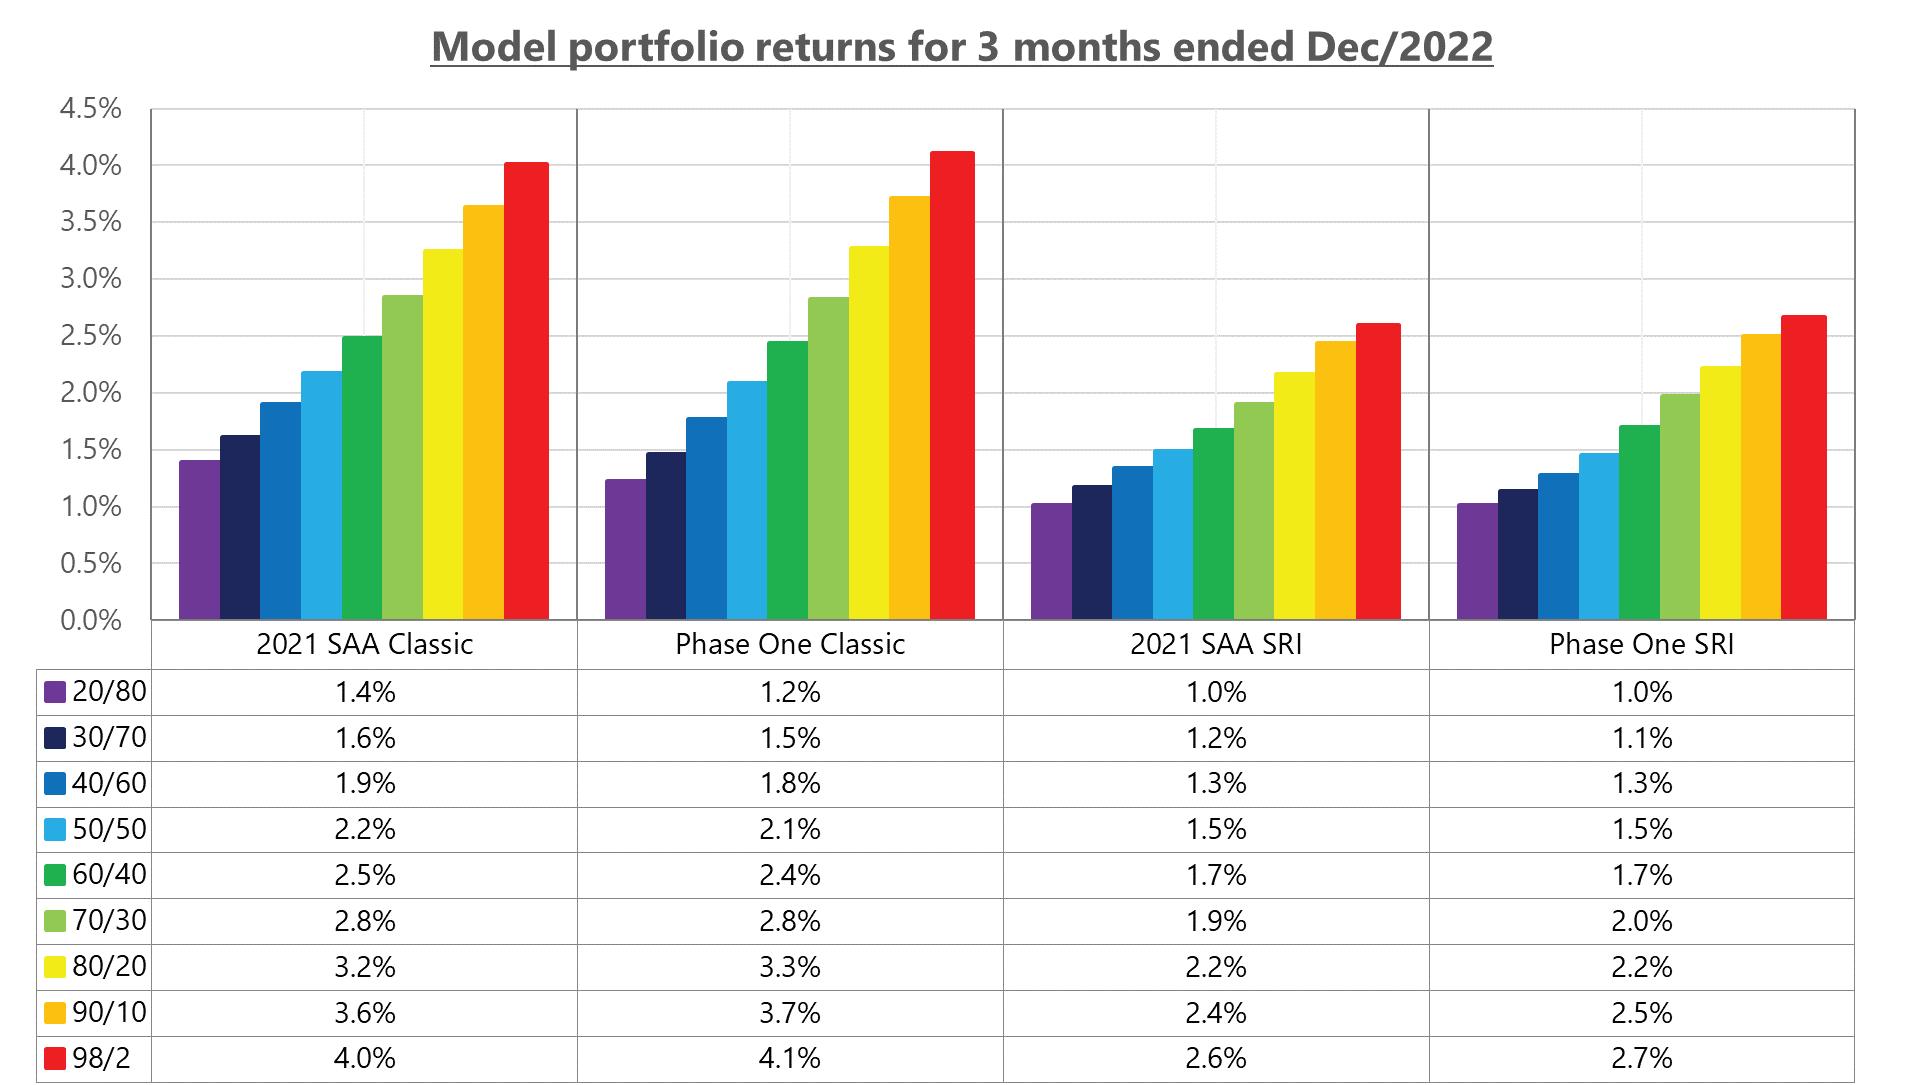
Key: Positive risk tilt
Negative risk tilt
Positive tracking error
Negative tracking error
Enhanced due diligence for the quarter ended 31 December 2021
Enhanced due diligence trigger
An enhanced due diligence (EDD) on a fund may be required for any number of reasons. Please refer to the CIC Policy and Procedures Manual for more detail.
Fund: Dimensional Global Core Equity Trust NZD Hedged Class (“the trust”)

Custom Benchmark: Consilium GCOR Expectation (NZD) (“the benchmark”)
The trigger for this analysis was short term tracking error (Appendix 2)
Fund return: 7.57%, Custom Benchmark return: 5.24%, Deviation: +2.33%, Tolerance: ±1.16%
Has the investment mandate changed? (Appendix 2)
relative performance attributable to known risk tilts and/or exclusions? (Appendix 3, 4)
Our analysis highlighted that the outperformance in the December quarter relative to the custom benchmark was attributable to structural elements of the trust in particular the reduced exposure to small companies since 2020 This change occurred when the 5th factor in the Fama/French 5 factor model –reinvestment – was implemented The custom benchmark has not been reflecting this reduced exposure and needs to be modified
The attribution analysis shows that against the MSCI World ex Australia Index the fund underperformed the market, with this underperformance resulting from the size and value tilts taken by the trust
We remain satisfied the identified risk exposures are consistent with the latest trust mandate, and we identified no unexpected or unexplained risks.
Based on all the above, the committee was satisfied that the Dimensional Global Core Equity Trust passed this EDD review While the CIC will review the custom benchmarks with their latest findings following the completion of the 2022 Phase One SAA review.
For further information please see the appendix on the following pages
Custom benchmark
The style benchmark used to measure this trust’s expected quarterly returns is a custom index created by the CIC. This custom index includes consideration of the expected risk tilts from the trust rather than just a broad market return which was assumed when previously using the MSCI World ex Australia Index (NZD)
The factor exposures to construct the custom index have been evaluated from a multiple regression performed in May 2020. For this trust, the custom index is specified in table 1 below
Risk Free 1.00x Ken French Risk Free Rate
Market 1.00x Ken French Market factor minus Ken French Risk Free Rate
Size 0.15x Ken French Developed Market Size Factor
Value 0.15x Ken French Developed Market Value Factor
Profitability nil
Source: Consilium calculations, Ken French Five Factor Model
This is the average return on the three Ken French small portfolios minus the average return on the three Ken French big portfolios.
This is the average return on the two Ken French value portfolios minus the average return on the two Ken French growth portfolios.
Using a custom index for attribution analysis or analysis of relative fundamentals such as aggregate price to book or weighted average market capitalisation poses a difficulty. As the custom index is not maintained by an index provider there is no average underlying company exposures for the custom index and so attribution analysis or analysis of relative fundamentals is impossible.
When performing these analyses, we instead employ the closest benchmark available for which these analyses can be completed. For this trust that is the MSCI World ex Australia Index (NZD).
Upon review the CIC propose to update the Custom benchmark expectation following recent findings in the 2021 Strategic Asset Allocation Review.
The Dimensional product disclosure statement (PDS) applicable to Q1 2021 was dated 26 May 2020. The stated objective of the trust is:
The investment objective of the Trust is to provide long-term capital growth by gaining exposure to a diversified portfolio of securities associated with approved developed markets (excluding Australia), with increased exposure to small companies and Value Companies relative to a Market Capitalisation Weighted portfolio.
The Trust is not managed with the objective of achieving a particular return relative to a benchmark index. However, to compare the performance of the Trust with a broad measure of market performance, reference may be made to the MSCI World ex Australia Index (net div.), (for unhedged class units), net div., hedged to AUD (for AUD class units), or net div., hedged to NZD (for NZD class units).
The CIC has frequent dialogue with the fund manager, and we are satisfied there has been no change to the strategy/mandate without our knowledge.
The trusts performance commentary (NZD class) for the prior 12 months states:
The trust returned 30.6% over the year, leading the MSCI World ex Australia Index by 1.0%. The portfolio’s emphasis on value stocks, particularly small cap value stocks, drove outperformance.
Global equities had a strong year, with the MSCI All Country World IMI Index rising 25% in 2021. Compared to 2020, equity investors had a fairly smooth ride in 2021. The standard deviation of returns was just 7% compared to over 15% in 2020. Headline themes in 2021 included meme stocks, economic reopening, inflation, and new regulations and priorities from Chinese authorities. Australian stocks returned 17.5% for the year, outperforming emerging markets, but underperforming other developed markets. Globally, small caps lost to large caps, but value beat growth, and stocks with high profitability outperformed those with low profitability.

The interaction of premiums was particularly impactful this year. While small caps underperformed large caps, the underperformance was driven by poor returns to small cap growth stocks with low profitability. Small value stocks and small cap stocks with high profitability generally outperformed their growth and low profitability counterparts, benefitting the Dimensional portfolios invested in small caps. The portfolio was overweight small cap value stocks by 13%. These stocks were the best performers in developed markets ex Australia and returned 32.3% for the year. The portfolio also held greater weight than the index in small cap growth stocks, which underperformed the index overall. However, the performance of small cap value stocks dominated, and the portfolio outperformed.
–
Source: Dimensional Fund Advisors and Consilium calculations
*Relative to the total index return of +8.70%
Allocation attribution by size finds a cumulative impact of -137bps against the market benchmark
Source: Dimensional Fund Advisors and Consilium calculations
*Relative to the total index return of +8.70%
Allocation attribution by price to book (value tilt) finds a cumulative impact of -65bps against the market benchmark.
Figure 2 – Aggregate price to book ratio of trust and benchmark
DFA Global Core Equity Trust NZD Hedged Class MSCI World ex Australia Index (net div., hedged to NZD)
Source: Consilium
Figure 3 – Aggregate price to book ratio of trust relative to benchmark
Source: Consilium
The Aggregate price to book ratio of trust has been consistently 15%-25% less expensive relative to benchmark and we are satisfied the degree of the value tilt is still consistent.
The weighted average total market capitalisation of trust has historically been 30-50% smaller than the MSCI index, however since the start of 2020 this metric has been less negative, more consistently registering around -30%. Given the performance of small companies were poor through the quarter, a reduced exposure helped relative outperformance and contributed to this EDD flag.
This observation represents a reduction in the level of the size tilt within the trust which began in 2020 when the trust started implementing the reinvestment factor, a change we reviewed and accepted at the time. The missing step however has been modification of the custom benchmark to reflect this change in the level of small company exposure. Now we have enough observations to measure this reduced small company exposure we will implement a modified custom benchmark in time for Q2 2022 monitoring.
Disclaimer: The material contained in or attached to this report has been prepared based upon information that Consilium NZ Limited believes to be reliable but may be subject to typographical or other errors. Consilium has taken every care in preparing this information, which is for client education purposes only. Although the data has been sourced from publicly available information and/or provided by the investment managers, we are not able to guarantee its accuracy. Past performance, whether actual or simulated, is no guarantee of future performance. This document does not disclose all the risks of any transaction type described herein, and the recipient should understand any terms including relevant risk factors and any legal, tax and accounting considerations applicable to them.
One or more of the authors of this report invest in the analysed security. The author(s) do not know of the existence of any conflicts of interest that might bias the content or publication of this report. Compensation of the author(s) of this report is not based on any outcome of this report.
An enhanced due diligence (EDD) on a fund may be required for any number of reasons. Please refer to the CIC Policy and Procedures Manual for more detail.
Fund: Dimensional Global Small Company Trust (“the trust”)
Benchmark: MSCI World ex Australia Small Cap Index (net div.) (“the benchmark”)
The trigger for this analysis was short term tracking error (Appendix 1)
Fund return: 4.76%, Benchmark return: 2.90%, Deviation: 1.85%, Tolerance: ±1.69%
Has the investment mandate changed? (Appendix 2)
Was relative performance attributable to known risk tilts and/or exclusions? (Appendix 3, 4)
Were the risk levels acceptable? (Appendix 5)
Were there any special considerations?
Our analysis highlighted that the outperformance in the December quarter was attributable to structural elements of the trust The attribution analysis shows that against the MSCI World ex Australia Small cap Index, we can see that the fund outperformed the market, with this outperformance resulting from the value tilts taken by the trust. We also note that the outperformance was primarily delivered by compositional differences compared to the benchmark, with allocations taken to companies not within the benchmark leading to the bulk of the outperformance. An example is Devon Energy Corp; the trust holds a small 0.28% holding in this company, compared to 0.0% in the benchmark. This holding alone generated 6bps of relative outperformance throughout the quarter.
We remain satisfied that the aggregate risk exposures are consistent with the trust mandate, and we identified no unexpected or unexplained risks.
As part of our SAA review we will consider widening the tolerance bands of this trust, to reflect the profitability tilts taken within the trust which were introduced throughout 2020.
Based on all the above, the committee was satisfied that the Dimensional Global Small Company Trust passed this EDD review
For further information please see the supporting analysis appendix on the following pages
April 2022

The Dimensional product disclosure statement (PDS) applicable to Q4 2021 was dated 26 May 2020. The stated objective of the trust is:
The investment objective of the Trust is to provide long-term capital growth by gaining exposure to a diversified portfolio of small companies associated with approved developed markets (excluding Australia).
The Trust is not managed with the objective of achieving a particular return relative to a benchmark index. However, to compare the performance of the Trust with a broad measure of market performance, reference may be made to the MSCI World ex Australia Small Cap Index (net div.).
The CIC has frequent dialogue with the fund manager, and we are satisfied there has been no change to the strategy/mandate without our knowledge.
The trusts performance commentary (NZD class) for the quarter states:
The trust returned 26.7% over the year, leading the MSCI World ex Australia Small Cap Index by 3.8%. The exclusion of stocks with the lowest profitability and highest relative prices and high asset growth drove outperformance.
Global equities had a strong year, with the MSCI All Country World IMI Index rising 25% in 2021. Compared to 2020, equity investors had a fairly smooth ride in 2021. The standard deviation of returns was just 7% compared to over 15% in 2020. Headline themes in 2021 included meme stocks, economic reopening, inflation, and new regulations and priorities from Chinese authorities. Australian stocks returned 17.5% for the year, outperforming emerging markets, but
underperforming other developed markets. Globally, small caps lost to large caps, but value beat growth, and stocks with high profitability outperformed those with low profitability.
The interaction of premiums was particularly impactful this year. While small caps underperformed large caps, the underperformance was driven by poor returns to small cap growth stocks with low profitability. Small value stocks and small cap stocks with high profitability generally outperformed their growth and low profitability counterparts, benefitting the Dimensional portfolios invested in small caps.
Small cap stocks with high asset growth were down more than 12%. Further, small cap stocks with the lowest profitability and highest relative prices were down over 5%. Other small caps returned 27.1%. The exclusion of these two sets of small caps from the portfolio drove outperformance.
Once again, this highlights the key drivers of relative performance were stock specific allocations where the main positive attribution is spread over potentially dozens of companies – the underweights to high asset growth and low profitability small companies resulting in overweights to a number of better performing companies not represented in the benchmark. Accordingly, the following size and price to book attributions, do not explain a high proportion of the performance difference.
Allocation attribution by size finds a cumulative impact of 0 bps
Table 3
Allocation attribution by price to book for the Global Small Company Trust relative to MSCI World ex Australia Small Cap Index
Allocation attribution by price to book (value tilt) finds a cumulative impact of +9
We note the change in relative price to book during the December quarter, as at the end of December, this marks the point where the trust had the greatest relative price to book ratio compared to the benchmark. The CIC will monitor this throughout 2022, if a clear trend emerges we will discuss this with Dimensional. However, we expect this month to be a blip and for this measure to return to the -5% range.
Source: Consilium
Source: Consilium
As noted with the relative price to book, the relative market capitalisation of the trust compared to the benchmark increased significantly in the month of December. As with the relative price to book, we will continue to monitor this in 2022, and if we identify any trends we will discuss the findings with Dimensional.
Disclaimer: The material contained in or attached to this report has been prepared based upon information that Consilium NZ Limited believes to be reliable, but may be subject to typographical or other errors. Consilium has taken every care in preparing this information, which is for client education purposes only. Although the data has been sourced from publicly available information and/or provided by the investment managers, we are not able to guarantee its accuracy. Past performance, whether actual or simulated, is no guarantee of future performance. This document does not disclose all the risks of any transaction type described herein, and the recipient should understand any terms including relevant risk factors and any legal, tax and accounting considerations applicable to them.
One or more of the author(s) of this report invest in the analysed security. The author(s) do not know of the existence of any conflicts of interest that might bias the content or publication of this report. Compensation of the author(s) of this report is not based on any outcome of this report.
An enhanced due diligence (EDD) on a fund may be required for any number of reasons Please refer to the CIC Policy and Procedures Manual for more detail.
Fund: Dimensional Global Value Trust (“the trust”)
Benchmark: Consilium GVAL Expectation (“the benchmark”)
The trigger for this analysis was long term tracking error (Appendix 2)
Fund return: 12.36% (p.a.), Benchmark return:15.49% (p.a.), Deviation: -3.13% (p.a.), Tolerance: ±2.71% (p.a.)
Has the investment mandate changed? (Appendix 3)
Was relative performance attributable to known risk tilts and/or exclusions? (Appendix 4, 5)
Were the risk levels acceptable? (Appendix 6)
Were there any special considerations?
Our analysis highlighted that the three year relative underperformance of the trust to end December 2021, was largely attributable to the incumbent factor loadings of the custom benchmark setting the relative return expectations for this trust at an artificially high level, particularly in a period where the underlying performance of the market factor was so strong at almost 20.0% p.a.
Following the CIC’s updated expected returns analysis in late 2021, the factor loadings of the custom benchmark were reviewed to bring these into line with the current CIC estimates Once the relevant adjustments were made to the custom benchmark, the initial three year underperformance flag disappeared
As the CIC had already reviewed and accepted a change to the custom benchmark (although had not fully implemented it at the time of the Q4 monitoring review), the committee were satisfied that the three yearly flag was largely a result of the outdated factor loadings in the custom benchmark. Once these factor loadings were brought into line with the CICs own updated expected returns research, the revised custom
benchmark exhibited greater alignment with the observed performance of the fund including a significant reduction in the unexplained return for the fund over the prior three years
The CIC were satisfied with this outcome and accordingly the Dimensional Global Value Trust passed this three yearly EDD review
For further information please see the appendix on the following pages
August 2022
The style benchmark used to measure this trust’s expected quarterly returns is a custom index created by the CIC. This custom index includes consideration of the expected risk tilts from this trust rather than just a broad market return which was assumed when previously using the MSCI World ex Australia Value Index (NZD).
The factor exposures to construct the custom index were initially evaluated from a multiple regression performed in May 2020 and are summarised in table 1 below
Factor Factor loading Factor definition Notes
Risk Free 1.00x
Ken French Risk Free Rate
Market 1.10x Ken French Market factor minus Ken French Risk Free Rate
Size 0.10x
Value 0.50x
Profitability nil
Ken French Developed Market Size Factor
Ken French Developed Market Value Factor
Source: Consilium calculations, Ken French Five Factor Model
This is the average return on the three Ken French small portfolios minus the average return on the three Ken French big portfolios.
This is the average return on the two Ken French value portfolios minus the average return on the two Ken French growth portfolios.
Note: using a custom index for attribution analysis or analysis of relative fundamentals such as aggregate price to book or weighted average market capitalisation poses a difficulty. As the custom index is not maintained by an index provider there is no average underlying company exposures for the custom index and so attribution analysis or analysis of relative fundamentals is impossible. When performing these analyses, we instead employ the closest benchmark available for which these analyses can be completed. For this trust that is typically the MSCI World ex Australia Value Index (NZD).
Upon completion of the CIC’s updated expected returns analysis as part of the 2021 Strategic Asset Allocation Review, the CIC undertook a review of all Custom monitoring benchmarks including the custom benchmark for the DFA Global Value Trust
Factor exposures to construct the revised custom index were evaluated from a multiple regression performed in December 2021 (although they relate to expected return estimates form Q4 2021 onwards) and are summarised in table 2 below
Risk Free 1.00x Ken French Risk Free Rate
Market 1.05x Ken French Market factor minus Ken French Risk Free Rate
Size -0.10x Ken French Developed Market Size Factor
Value 0.55x Ken French Developed Market Value Factor (LargeHML)
Profitability nil
Source: Consilium calculations, Ken French Five Factor Model
This is the average return on the three Ken French small portfolios minus the average return on the three Ken French big portfolios.
This is the return of the Ken French big value portfolio.
Key changes in the revised custom benchmark loadings were:
1. A reduction in market loading from 1.1x to 1.05x
2. A change in the sign of the size loading from +0.10x to -0.10x
3. A change in the value factor definition (considering only large caps) moving from 0.50x the traditional Ken French developed market value factor to 0.55x the Ken French big value factor
All of these changes (both individually and in aggregate) have the effect of reducing the expected level of fund outperformance versus the custom benchmark. This is particularly relevant in respect of the original 3 year tracking error flag generated by the incumbent benchmark methodology in Q4 2021 (see below)
Figure 1 – Original three year deviation from the benchmark
Source: Consilium
The three year deviation chart (using the incumbent benchmark loadings) flagged for a performance related EDD in Q4 2021.

This triggered because with a three year market return of 20.0% p.a. and three year SMB and HML factors respectively returning -3.26% and -9.83%, the custom benchmark was “expecting” a fund performance of approximately:
Expected return (after fund fees) = (19.99% x 1.1) + (-3.26% x 0.10) + (-9.83% x 0.50) – fund fees = 15.49%
The actual fund return after fees was 12.36%, and it was the -3.13% deviation between these figures which triggered the EDD flag.
In hindsight, the factor loadings were setting the performance expectations for this trust at an artificially high level and, over time, this was eventually reflected in a long term EDD trigger due to relative underperformance.
This is intuitive The three year period in question had such a high market return (19.99%), that our incumbent expected loading on the market factor implied the fund would deliver 1.1 x this market return (or an additional 2.0 percentage points over the three years). This is clearly too much extra performance to expect simply due to excluding REITs.
When we reran an analysis of the three yearly tracking error of the fund returns versus the (revised, 8 factor) custom benchmark returns, we found significantly less underperformance as is displayed in Figure 2 below.

The incumbent factor loadings resulted in the original Q4 flag (Figure 3), while the revised factor loadings based on our 2021 expected returns analysis (Figure 2) show that the deviation is no longer outside tolerance thresholds.

This revised benchmark loading (amongst several that relate to Dimensional style funds) was presented to the CIC for adoption at its meeting in July and was approved for adoption.
The committee considered that since the revised benchmark loadings are clearly a better reflection of the current fund characteristics than the incumbent loadings from May 2020, that the original three year EDD flag from Q4 2021, be considered “satisfied” by updating the benchmark loadings as per our updated research
Disclaimer: The material contained in or attached to this report has been prepared based upon information that Consilium NZ Limited believes to be reliable but may be subject to typographical or other errors. Consilium has taken every care in preparing this information, which is for client education purposes only. Although the data has been sourced from publicly available information and/or provided by the investment managers, we are not able to guarantee its accuracy. Past performance, whether actual or simulated, is no guarantee of future performance. This document does not disclose all the risks of any transaction type described herein, and the recipient should understand any terms including relevant risk factors and any legal, tax and accounting considerations applicable to them.
One or more of the author(s) of this report invest in the analysed security. The author(s) do not know of the existence of any conflicts of interest that might bias the content or publication of this report. Compensation of the author(s) of this report is not based on any outcome of this report.
An enhanced due diligence (EDD) on a fund may be required for any number of reasons. Please refer to the CIC Policy and Procedures Manual for more detail.
Fund: Dimensional Global Sustainability Trust (NZD) (“the trust”)
Custom Benchmark: Consilium GSUT Expectation (NZD) (“the benchmark”)
The trigger for this analysis was long term tracking error (Appendix 2)
Fund return: 23.31%, Custom Benchmark return: 20.68%, Deviation: +2.64%, Tolerance: ±2.04%
Has the investment mandate changed? (Appendix 3)
Was relative performance attributable to known risk tilts and/or exclusions? (Appendix 4) Yes ✓
Were the risk levels acceptable? (Appendix 5) Yes ✓
Were there any special considerations? No ✓
Our analysis highlighted that the outperformance in the three years to December 2021 was attributable to the trust’s compositional differences compared to the benchmark The trust’s sustainability considerations led to significant outperformance, with a deliberate overweight to Tech giant Apple, combined with the exclusion of Energy companies, such as Exxon Mobil and BP, leading to outperformance across the threeyear period.
There is currently insufficient evidence for us to be able to expect a positive premium from SRI investing, so this feature does not impact the expected returns of our custom benchmark.
We remain satisfied the identified risk exposures are consistent with the trust mandate, and we identified no unexpected or unexplained risks.
Based on all the above, the committee was satisfied that the Dimensional Global Sustainability Trust passed this EDD review
For further information please see the appendix on the following pages
April
The style benchmark used to measure this trust’s expected quarterly returns is a custom index created by the CIC. This custom index includes consideration of the expected risk tilts from this trust rather than just a broad market return which was assumed when previously using the MSCI World ex Australia Index (NZD)
The factor exposures to construct the custom index have been evaluated from a multiple regression performed in May 2020. For this trust, the custom index is specified in table 1 below
Factor Factor loading Factor definition Notes
Risk Free 1.00x Ken French Risk Free Rate
Market 1.00x Ken French Market factor minus Ken French Risk Free Rate
Size 0.15x
Value 0.15x
Profitability nil
Ken French Developed Market Size Factor
Ken French Developed Market Value Factor
Source: Consilium calculations, Ken French Five Factor Model
This is the average return on the three Ken French small portfolios minus the average return on the three Ken French big portfolios.
This is the average return on the two Ken French value portfolios minus the average return on the two Ken French growth portfolios.
Using a custom index for attribution analysis or analysis of relative fundamentals such as aggregate price to book or weighted average market capitalisation poses a difficulty. As the custom index is not maintained by an index provider there is no average underlying company exposures for the custom index and so attribution analysis or analysis of relative fundamentals is impossible.
When performing these analyses, we instead employ the closest benchmark available for which these analyses can be completed. For this trust that is the MSCI World ex Australia Index (NZD).
The Dimensional product disclosure statement (PDS) applicable to Q4 2021 was dated 26 May 2020. The stated objective of the trust is:
The investment objective of the Trust is to provide long-term capital growth by gaining exposure to a diversified portfolio of securities associated with approved developed markets (excluding Australia), with increased emphasis on higher expected return securities, and adjusted to take into account certain environmental and sustainability impact and social considerations.
The Trust is not managed with the objective of achieving a particular return relative to a benchmark index. However, to compare the performance of the Trust with a broad measure of market performance, reference may be made to the MSCI World ex Australia Index (net div.) hedged to NZD
The CIC has frequent dialogue with the fund manager, and we are satisfied there has been no change to the strategy/mandate without our knowledge.
The trusts performance commentary (in AUD) for the quarter states: The trust returned 23.3% (per annum) over three years, leading the MSCI World ex Australia Index by 2.7%. Our analysis found that the outperformance was led by the trust’s compositional differences against the benchmark, as opposed to its allocation differences.
trust’s
Looking specifically at the trust’s top contributors and detractors across the three year period, we can see that due to the trust’s sustainability considerations, an overweight to Apple resulted in 1.63% relative outperformance against the benchmark.

While Apple is considered as a mega-cap, growth, highly profitable company, there’s an overweight in the portfolio given the higher sustainability rating compared to other stocks in the Information Technology sector
Other exclusions also led to significant outperformance, with the exclusion of Energy companies
Exxon Mobil, BP and Royal Dutch Shell each contributing 0.41%, 0.23% and 0.22% respectively to the trust’s outperformance
We note that the change in relative price to book since the first half of 2020, this is consistent with the trust’s strategy migrating away from its initial large cap positioning, moving towards a core (size and value tilted) strategy.
DFA Global Sustainability Trust NZD Hedged Class MSCI World ex Australia Index (net div., hedged to NZD)
Source: Consilium
Source: Consilium
Disclaimer: The material contained in or attached to this report has been prepared based upon information that Consilium NZ Limited believes to be reliable, but may be subject to typographical or other errors. Consilium has taken every care in preparing this information, which is for client education purposes only. Although the data has been sourced from publicly available information and/or provided by the investment managers, we are not able to guarantee its accuracy. Past performance, whether actual or simulated, is no guarantee of future performance. This document does not disclose all the risks of any transaction type described herein, and the recipient should understand any terms including relevant risk factors and any legal, tax and accounting considerations applicable to them.
One or more of the author(s) of this report invest in the analysed security. The author(s) do not know of the existence of any conflicts of interest that might bias the content or publication of this report. Compensation of the author(s) of this report is not based on any outcome of this report.
Enhanced due diligence trigger
An enhanced due diligence (EDD) on a fund may be required for any number of reasons. Please refer to the CIC Policy and Procedures Manual for more detail.
In the fourth quarter of 2021, the Dimensional Emerging Markets Value Trust flagged for enhanced due diligence (EDD). The EDD flag was due to receiving notification of a greater than 25 percent reduction in the AUM (excluding market performance) over a 12-month period
The fund experienced a decrease in Net Assets of 30% throughout 2021

We contacted Dimensional to discuss the nature of this flag. Dimensional informed the CIC that this flag was due to the cannibalisation of the introduction of the Dimensional Emerging Markets Sustainability Trust. With the introduction of this fund in July 2021, assets from the incumbent Dimensional Emerging Markets Value Trust transferred to the new sustainable suite.
Assets within the Dimensional Emerging Markets Value Trust remain in excess of AUD 500m as of December 2021, falling from over AUD 700m in early 2021
The purpose of the AUM monitoring is twofold:
1) We need to be certain the fund can meet withdrawals from any investor without impacting the remaining unit holders.
2) We need to be comfortable the trust can continue to operate given this reduced AUM base.
Dimensional provided comfort that remaining investors were not affected by the processing of the redemption, nor will they be impacted in the future as a result of this reduction in AUM. The remaining AUM of over AUD 500m gives us considerable comfort that the strategy can continue to be managed efficiently despite its now lower base.
The following section quantitatively examines whether we can independently verify Dimensional’s assurance that processing the redemption had no detrimental impact on the remaining investors.
In the following analysis, we assess the performance of the trust during the quarter to determine if the returns to remaining investors were acceptable.
The official reference index for the Dimensional Emerging Markets Value Trust is the MSCI Emerging Markets Index, however for our analysis we are using the MSCI Emerging Markets Value Index because this index better reflects the trust’s underlying style characteristics The index explains 90.0% of the fund’s variability of returns. We are therefore able to apply a linear regression model to this relationship for Q4 2021 and to use this model to evaluate whether the returns generated during the redemption months were in line with expectations
We use daily returns for both the fund and the index to determine any variation between the two throughout the fourth quarter of 2021. All but five of the observed returns from the fourth quarter were inside the 90% confidence interval, illustrated below. Of these five data points, three were on the positive side, meaning the fund outperformed the benchmark on these days, while on the other two occasions the fund underperformed the benchmark. Given this is a 90% confidence interval we do expect 1 in 10 observations will fall outside of these ranges Accordingly, having only five out of 66 days (7.58%) outside this range is acceptable
Ultimately this due diligence is to determine if remaining investors were negatively impacted as a result of the fund outflows. These results demonstrate that this is not the case, with fund returns generally in line with the benchmark returns, aside from the five highlighted days in which returns exceeded the benchmark on three out of the five occasions
Accordingly, the committee is satisfied the trust managed this large outflow without compromising the remaining investors.
Jan-17toSep-21
Oct-21toDec-21
Lowerbound
Upperbound
Linear(Jan-17toSep-21)
y=0.9689x +0.0057 R²=0.9016
Following our analysis of the fund, the CIC is satisfied that the reduction in the fund’s AUM had no detrimental impact on the performance received by the remaining fund investors and it is also not expected to impact Dimensional’s ability to efficiently manage the fund on an ongoing basis
Therefore, the CIC assesses that the funds pass this enhanced due diligence flag
March 2022
Disclaimer: The material contained in or attached to this report has been prepared based upon information that Consilium NZ Limited believes to be reliable but may be subject to typographical or other errors. Consilium has taken every care in preparing this information, which is for client education purposes only. Although the data has been sourced from publicly available information and/or provided by the investment managers, we are not able to guarantee its accuracy. Past performance, whether actual or simulated, is no guarantee of future performance. This document does not disclose all the risks of any transaction type described herein, and the recipient should understand any terms including relevant risk factors and any legal, tax and accounting considerations applicable to them.
One or more of the author(s) of this report invest in the analysed security. The author(s) do not know of the existence of any conflicts of interest that might bias the content or publication of this report. Compensation of the author(s) of this report is not based on any outcome of this report.
An enhanced due diligence (EDD) on a fund may be required for any number of reasons. Please refer to the CIC Policy and Procedures Manual for more detail.
Fund: Dimensional Two-Year Sustainability Fixed Interest Trust (“the trust”)
Benchmark: Bloomberg Global Aggregate Bond Index 1-3 Years (hedged to NZD) (“the benchmark”)
The trigger for this analysis was persistent underperformance during the December 2021 quarter (specifically for the 3 years ended 31 October 2021)
Fund return: 1 28% pa, Benchmark return: 1.96% pa, Deviation: -0.68% pa net of retail fees, -0.43% pa gross of fees. Tolerance: +/- 0.42%
Our analysis highlighted that the persistent underperformance was attributable to compositional differences between the trust and the benchmark, in particular the overweights to sources of higher expected return such as the steeper yield curves of different nations.
While the flag was for a three-yearly window, analysis of two particular quarters explained the three-year flag. The analysed quarters were extremely volatile and delivered a wide range of outcomes in the short term investment grade fixed income space and the tilts taken by the fund were generally detrimental. The risks taken during these two quarters were consistent with the mandated strategy to tilt to sources of higher expected return and were inside the trust’s risk limits.
Based on all the above,the committee was satisfied that the Dimensional Two-Year Sustainability Fixed Interest Trust is not taking any unknown risks and the fund remains our preferred vehicle to gain access to short term international fixed interest risk factors
For further information please see the appendix on the following pages
September 2022
The Dimensional product disclosure statement (PDS) applicable to Q4 2021 was dated 2 August 2021. The stated objective of the trust is:
Within the risk constraints of investing in eligible short-term, Investment Grade securities, and adjusted to take into account certain environmental and sustainability impact and social considerations, the objective of the Trust is to maximise the return of a broadly diversified portfolio of domestic and global fixed interest securities.
The Trust is not managed with the objective of achieving a particular return relative to a benchmark index. However, to compare the performance of the Trust with a cash index, reference may be made to the Bloomberg AusBond Bank Bill Index (AUD class units) or the Bloomberg NZBond Bank Bill index (NZD class units).
Investors should note that the index is referred to for comparison purposes only. The index is not intended to represent the current or targeted asset allocation of the Trust. The performance of the Trust may differ significantly from the index
The Trust may suit those investors seeking a liquid, low risk, diversified portfolio that provides exposure to the returns of short-term global fixed interest securities. In particular, the Trust may suit those investors who seek to have certain environmental and sustainability impact and social considerations taken into account in the investment decision making process of the Trust.
Dimensional’s fixed interest portfolios are based on dimensions of expected returns that have been identified by academic research. Relative performance in fixed interest is largely driven by two dimensions: bond maturity and credit quality. Bonds that mature further in the future are subject to higher risk of unexpected changes in interest rates. Bonds with lower credit quality are subject to higher risk of default. Extending bond maturities and reducing credit quality increases potential returns.
Ordinarily the Trust invests in a diverse portfolio of Investment Grade corporate and government, domestic and global fixed interest securities, with an overall maximum weighted average
maturity of two years and, for any individual security, a maximum maturity of three years from the date of settlement. Dimensional generally changes the portfolio’s exposure to term premiums and credit premiums in response to changes in security prices.
During the three yearly analysis that this enhanced due diligence applies to the trust has undertaken a change in mandate; implementing a sustainability overlay in August 2021. This change triggered an EDD1 and we concluded the overlay should not have any significant impact on the manager’s ability to continue to deliver the strategy. Otherwise, the CIC has frequent dialogue with the fund manager, and we are satisfied there has been no further change to the strategy/mandate without our knowledge. The CIC also notes our chosen benchmark for monitoring purposes is not cash, but the Bloomberg Barclays Global Aggregate Bond Index 1-3 Years (hedged to NZD).
Although this is a flag for underperformance over three years, shorter term observations, and previously completed EDDs are insightful. In particular the March 2020 quarter and the December 2021 quarters are the dominant sources of underperformance that have contributed to this 3-yearly flag.
The March 2020 quarter underperformance occurred during the significant market dislocation during the initial market impact of the Covid-19 pandemic and this event was flagged1 in our monitoring process at the time. The subsequent analysis found the trust had been managed in line with its mandate and the significant market dislocation had resulted in wide dispersion in fixed income market returns The trust was targeting sources of higher expected return which at the time included on overweight in corporate bonds, an underweight in USD denominated securities and significantly shorter duration. We evaluated the funds exposure levels relative to historical levels and relative to risk levels and found these were fine. Ultimately, the fund passed the EDD and remained the recommended vehicle to gain access to short term bonds in developed markets
Given this event has been explained we turn our attention to the December 2021 quarter to make a similar assessment.
1 Prior enhanced due diligence papers are available on the Consilium adviser portal or on request
The December 2021 quarter marked sharp increases in some yield curves as central banks began to signal intentions to enter a phase of rapidly tightening monetary policy. In such a volatile environment there was a wide dispersion of returns, and even modest over or underweights had a significant impact on relative performance. Attribution analysis showed us where the differences in exposure were which translated to the main differences in performance
The fund takes significantly different exposure than the index when we look at the breakdown by currency, duration and credit quality.
Source: Dimensional
Looking first at the index we see it is dominated by USD and Euro underlyings with variable investment grade credit (as represented by the colour), large allocations to A rated (government) securities denominated in Yen and Yuan and a close to even split between the 1-2 years, and 2-3 years duration buckets with very little allocation to anything below 1 years (as represented by the lack of palest shaded bars)

Source: Dimensional

Looking at the trust we see a very different breakdown The highest currency exposure is to the Australian dollar followed by the Canadian dollar. The New Zealand dollar and Norwegian Krone are also far higher than the index weight, while the Yen and Yuan exposures are both at zero, with Euro also very low
We also see, as represented by the colour coding, a very different credit profile. American AAA bonds (ie government bonds) are underweight, and within CAD and AUD, the AA and A rated bonds hold a higher than market weight (ie the fund tilts towards lower credit quality bonds) Finally, we also observe a shorter duration as represented by the palest shaded bars. 25% of the fund is in bonds with 12 months or less duration (in particular AUD and GBP bonds), while the US exposure is predominantly longer than 2 years. With bond yields moving higher in the period, in particular the USD, AUD & NZD yield curves, the majority of these tilts were detrimental
These selected allocation differences account for almost the entire underperformance of the strategy in the December 20211 quarter.
Every one of these relative positionings is consistent with tilting towards higher expected returns. The Australian, Canadian and New Zealand dollar yield curves were steep through this quarter, especially relative to the JPY and Euro curves.
Further exposures by currency are presented on the following page
This analysis highlights the significant difference in currency exposures between the fund and the benchmark. This quarter again reinforced the significant impact that variations in positioning can have on relative performance in volatile environments

As we have established the source of the relative underperformance, we need to check the risks taken are acceptable. We first look at the historical relative exposures of the trust to the index by currency. This is illustrated in figure 6 below.


We note a very stable exposure in the benchmark, but a far more variable exposure for the trust as per its strategy. This leads to high relative over and under weights as illustrated by the last chart
This trust has no relative risk limits for either currency or issuing country, rather, the absolute limits are as follows:
- an unlimited exposure to the locally domiciled Australian dollar curve,
- a 75% maximum to the US dollar yield curve,
- a 50% maximum limit to the European Euro yield curve,
- a 30% maximum limit to the Japanese Yen yield curve,
- a 25% maximum the UK or Canada curves, and
- For smaller markets like Singapore, New Zealand and other European curves like Sweden there is a 10% portfolio limit.
- Chinese securities are not eligible.
Checking these limits versus the exposure levels provided, the committee is satisfied the trust was invested within its investment guidelines and there was no persistent relative exposure by currency that was precluded by the fund mandate
Next, we look at credit risk. The historical relative exposures by security type is summarised below in figure 7
Source: Dimensional Fund Advisors
Again, we observe a far more variable exposure level for the fund including a far greater allocation to corporate bonds. We also note that there are no relative security type constraints for the trust. The increasing exposure to corporate bonds in late 2021 and early 2022 is consistent with the mandate as credit spreads have widened during this period

Overall, both the relative and absolute positioning by security type is consistent with historical observations and mandate and the committee finds no evidence of unacceptable exposure.

The risk limits of the trust allow a duration of up to 2 years. The trust has consistently been managed within this limit, and the trusts relative duration through the three year analysis period (shortening duration in 2019, remaining relatively short in 2020, and then lengthening again in 2021) is consistent with the mandate. This change in duration exposure was due to the flattening of yield curves around the world in 2020 reducing the expected return from increased duration, in line with the fund’s strategy.

Overall, the committee is satisfied the trust was taking acceptable currency, security type and duration risk tilts.
The latest Approved Products List contains no approved alternative international fixed interest funds hedged to New Zealand dollars with a focus on bonds with short term duration.
Accordingly, having passed this enhanced due diligence review, the fund remains our preferred short duration vehicle to gain access to global fixed interest risk factors.
Disclaimer: The material contained in or attached to this report has been prepared based upon information that Consilium NZ Limited believes to be reliable, but may be subject to typographical or other errors. Consilium has taken every care in preparing this information, which is for client education purposes only. Although the data has been sourced from publicly available information and/or provided by the investment managers, we are not able to guarantee its accuracy. Past performance, whether actual or simulated, is no guarantee of future performance. This document does not disclose all the risks of any transaction type described herein, and the recipient should understand any terms including relevant risk factors and any legal, tax and accounting considerations applicable to them.
One or more of the author(s) of this report invest in the analysed security. The author(s) do not know of the existence of any conflicts of interest that might bias the content or publication of this report. Compensation of the author(s) of this report is not based on any outcome of this report.
An enhanced due diligence (EDD) on a fund may be required for any number of reasons. Please refer to the CIC Policy and Procedures Manual for more detail.
Fund: Dimensional Global Sustainability Trust (NZD) (“the trust”)
Custom Benchmark: Consilium GSUT Expectation (NZD) (“the benchmark”)
The trigger for this analysis was short term tracking error (Appendix 2)
Fund return (Net of fee): -6.28%, Custom Benchmark return: -3.46%, Deviation (Gross): -2.73%, Tolerance: ±2.33%
Has the investment mandate changed? (Appendix 2)
Was relative performance attributable to known structural elements? (Appendix 3, 4)
Were the risk levels acceptable? (Appendix 5)
Were there any special considerations?
Our analysis highlighted that the underperformance in the quarter ended 31 March was mainly attributable to the trust’s compositional differences compared to the benchmark that are driven by the trust’s sustainability exclusions. The sustainability exclusions in aggregate contributed to significant underperformance in the quarter with the exclusion of high emitters in particular being the main drivers. The attribution analysis shows that the size premia was mildly negative and the value premia strongly positive, but the overwhelming impact of specific company exclusions resulted in the relative underperformance overall.
While we do not expect a negative (or positive) premium from SRI investing, we do anticipate additional tracking error to result from the company exclusions, and this was certainly the case in this quarter. We remain satisfied the identified risk exposures are consistent with the trust mandate, and we identified no unexpected or unexplained risks.
Based on all the above, the committee was satisfied that the Dimensional Global Sustainability Trust passed this EDD review.
For further information please see the appendix on the following pages.
June 2022
The style benchmark used to measure this trust’s expected quarterly returns is a custom index created by the CIC. This custom index includes consideration of the expected risk tilts from this trust rather than just a broad market return which was assumed when previously using the MSCI World ex Australia Index (net Div, NZD)
The factor exposures to construct the custom index have been evaluated from a multiple regression performed in May 2020. For this trust, the custom index is specified in table 1 below
Factor Factor loading Factor definition Notes
Risk Free 1.00x
Ken French Risk Free Rate
Market 1.00x Ken French Market factor minus Ken French Risk Free Rate
Size 0.15x
Value 0.15x
Profitability nil
Ken French Developed Market Size Factor
Ken French Developed Market Value Factor
Source: Consilium calculations, Ken French Five Factor Model
This is the average return on the three Ken French small portfolios minus the average return on the three Ken French big portfolios.
This is the average return on the two Ken French value portfolios minus the average return on the two Ken French growth portfolios.
Using a custom index for attribution analysis or analysis of relative fundamentals such as aggregate price to book or weighted average market capitalisation poses a difficulty. As the custom index is not maintained by an index provider there is no average underlying company exposures for the custom index and so attribution analysis or analysis of relative fundamentals is impossible.
When performing these analyses, we instead employ the closest benchmark available for which these analyses can be completed. For this trust that is the MSCI World ex Australia Index (net div, NZD).
The Dimensional product disclosure statement (PDS) applicable to Q1 2022 was dated 26 May 2020. The stated objective of the trust is:
The investment objective of the Trust is to provide long-term capital growth by gaining exposure to a diversified portfolio of securities associated with approved developed markets (excluding Australia), with increased emphasis on higher expected return securities, and adjusted to take into account certain environmental and sustainability impact and social considerations.
The Trust is not managed with the objective of achieving a particular return relative to a benchmark index. However, to compare the performance of the Trust with a broad measure of market performance, reference may be made to the MSCI World ex Australia Index (net div.) hedged to NZD
The CIC has frequent dialogue with the fund manager, and we are satisfied there has been no change to the strategy/mandate without our knowledge.
Commentary from Dimensional in relation to the quarterly performance of the unhedged trust was as follows:
The trust returned -10.0% for the quarter, lagging the MSCI World ex Australia Index by 1.6%. A positive value premium benefitted performance, but the emphasis on low-emissions companies offset this benefit and drove underperformance.
Globally, equities fell in the first quarter with the MSCI All Country World IMI Index dropping 8%. Russia’s invasion of Ukraine provoked consequences from governments and financial markets. Meanwhile, crude oil spiked and energy stocks rose 19%. While equities fell broadly, value stocks outperformed, with the MSCI All Country World IMI Value Index beating the growth index by 9%. Low profitability growth stocks were particularly hard hit. Despite a negative size premium, value stocks offered some respite for small cap investors as value paid off within small caps as it did within large caps.

The portfolio was overweight value stocks by 10%, which contributed to relative performance, as value stocks outperformed growth stocks in non-Australian developed markets. The portfolio was underweight growth stocks like Shopify, which returned -52% and underperformed the overall market. However, the exclusion of high-emitting companies detracted from performance; for example, the portfolio excluded Exxon Mobil, which returned 32%. A negative size premium was also a headwind to relative performance, and the profitability premium was mixed. Ultimately, the portfolio’s sustainability considerations dominated the positive value premium and the portfolio underperformed.
The allocation attribution of selected industries shows a cumulative impact of -77bps This is consistent with Dimensional’s fund commentary highlighting a negative contribution due to sustainability considerations
The allocation attribution by size finds a cumulative impact of -62bps This is consistent with Dimensional’s fund commentary highlighting a negative contribution due to the size premium.
The allocation attribution by book to market ratio shows a cumulative impact of +72bps. This is consistent with Dimensional’s fund commentary highlighting a positive contribution due to the value premium.

Ultimately, by far the largest aggregate contribution to differences in relative performance was generated by single stock exclusions which we are unable to identify/verify on a company by company basis.
The mandated exclusion of a number of high emissions companies caused a considerable detraction from performance; a notable example being the exclusion of Exxon Mobil which returned +32% over the quarter, contributing to 15bps of underperformance by itself
Due to the profitability premium being mixed, it was the portfolio’s sustainability overlay which swamped the positive value premium and the portfolio underperformed.
This observation is reinforced by the other factor tilts delivering attribution contributions consistent with Dimensional’s fund commentary.
Source: Consilium
We note that the change in relative price to book since the first half of 2020, this is consistent with the trust’s strategy migrating away from its initial large cap positioning, moving towards a core (size and value tilted) strategy. Whilst this has reduced a little further during the first quarter of 2022, we do not currently consider this to be a significant incremental change.

Source: Consilium


Source: Consilium
We note, post the trust moving to a more traditional core allocation in early 2020, the relative weighted average market capitalisation has remained relatively stable.
Disclaimer: The material contained in or attached to this report has been prepared based upon information that Consilium NZ Limited believes to be reliable but may be subject to typographical or other errors. Consilium has taken every care in preparing this information, which is for client education purposes only. Although the data has been sourced from publicly available information and/or provided by the investment managers, we are not able to guarantee its accuracy. Past performance, whether actual or simulated, is no guarantee of future performance. This document does not disclose all the risks of any transaction type described herein, and the recipient should understand any terms including relevant risk factors and any legal, tax and accounting considerations applicable to them.
One or more of the author(s) of this report invest in the analysed security. The author(s) do not know of the existence of any conflicts of interest that might bias the content or publication of this report. Compensation of the author(s) of this report is not based on any outcome of this report.
Consistent with its written policies and procedures, the Consilium Investment Committee (CIC) reviews all recommended investments on a quarterly basis against a combination of investment performance, quantitative fund metrics, and other qualitative factors
During the first quarter of 2022, several fund managers were flagged for enhanced due diligence under the following criteria:
1. An extraordinary event which has resulted in the exclusion of Russian securities from Emerging Market Funds and Index Funds as Russia proceeded to invade Ukraine.
The management of Dimensional and iShares were directly impacted by this throughout the quarter.
On 24 February 2022 Russia invaded Ukraine in a major escalation of the Russo-Ukrainian conflict that began in 2014. The invasion triggered unparalleled sanctions on Russia from the West and since February there has been a growing number of international corporations divesting their Russian businesses and fund managers reducing/removing their exposure to Russia. The U.S. have led the effort to isolate Russia’s economy, especially by hindering Russia’s ability to use the U.S. dollar, bringing it closer to an official default on its foreign currency debt.
The war has produced a supply-side shock for Europe and put extreme price pressures on a range of commodities and significantly increased fears of prolonged shortages, further supply-chain issues, and greater inflation feeding into the idea of an economy facing stagflation Europe’s ability for a sustained economic recovery after the pandemic is now waning as the ECB looks to follow the Federal Reserve in tightening monetary policy at a faster than anticipated pace to curb inflationary pressures that has been hindering business and household confidence, increasing the risk of a recession.
Russia’s stock market partially reopened to foreign investors on the 1st of April after closing on the 28th of February The majority of managers around the globe have effectively marked down their Russian holdings to zero and plan to offload the relevant securities as market functionality permits them to do Currently, the majority of market participants see the Russian equity market as un-investable and the selling of Russian securities by managers will be an ongoing process as they face severe liquidity and currency risk
Russia’s invasion of Ukraine is a grim reminder that geopolitical risk is a part of investing in global markets.
We contacted each of our recommended fund managers as part of our regular quarterly monitoring to see if the Russian invasion of Ukraine had any impact on their ability to maintain their fund mandate(s), and if so, what steps they took to mitigate this impact.
On 2 March 2022, Dimensional announced that their Investment Committee had removed Russia from their list of approved markets for investment.
Dimensional’s Investment Committee considers a variety of factors when evaluating a market’s eligibility for investment, which include, among others: government regulation, restrictions on foreign investors in that market, and market liquidity.
Dimensional noted they had previously reduced their weight to Russian securities in their emerging markets and global equity portfolios after sanctions were imposed in 2014 after the annexation of Crimea. In January 2022, Dimensional halted further purchases of Russian equities in response to rising risks of sanctions on Russia from the United States and other nations. After their Investment Committee’s 2 March decision, Dimensional is now divesting all Russian securities from portfolios as market liquidity allows.
As the Emerging Markets Value Trust is not managed with the objective of achieving a particular return relative to a benchmark index, during Q1 2022 Russian equities represented just 1.0% of the Trust compared to 2.73% in the MSCI Emerging Markets Value Index (net div. AUD).
We are satisfied that the exclusion of Russian securities in the Dimensional Emerging Markets Value Trust has had no material impact on the fund managers ability to maintain the fund mandate, which is to provide long-term capital growth by gaining exposure to a diversified portfolio of Value Companies associated with approved emerging markets.
Blackrock communicated that they have kept closely engaged with index providers and identified three primary objectives when managing index funds in accordance with their investment objective:
1) maintain tight tracking relative to the benchmark index;
2) minimize market impact around the index change event; and
3) minimize transaction costs
Blackrock advised they will continue to assess the best methods to manage impacted securities in their funds in accordance with these best practices.
On 2 March 2022 MSCI announced that the MSCI Russia Indexes will be reclassified from Emerging Markets to Standalone Markets status. This reclassification decision would be implemented in one step across all MSCI Indexes at a price that is effectively zero as of the close 9 March 2022.
MSCI noted that:
“During the consultation, MSCI received feedback from a large number of global market participants including asset owners, asset managers, broker dealers and exchanges with an overwhelming majority confirming that the Russian equity market is currently uninvestable.”
It added the current crisis has led to a “material deterioration” in the accessibility of the Russian equity market to institutional investors to the point where it no longer meets the market accessibility requirements.
At the time, iShares MSCI EM SRI UCITS ETF had exposure to three Russian securities in the materials sector totalling 1,590,555 shares outstanding and as the Fund seeks to track the performance of an index composed of EM ESG screen companies it seeks to comply with index construction decisions implemented by the index provider (MSCI). As such, the three Russian securities were subsequently marked down and effectively held no weight in the portfolio as of 20 June 2022 and will be disposed of as soon as materially possible
We are satisfied that the exclusion of Russian securities in the iShares MSCI EM SRI UCITS ETF has had no material impact on the managers ability to maintain the funds mandate of tracking the performance of their respective indices
We believe the Russian invasion of Ukraine can correctly be considered an extraordinary event and, as such, is an appropriate catalyst for this broad EDD review
However, the nature of this event – being confined to a relatively small proportion of emerging market securities – has been such that fund managers (and index providers) exposed to these securities have been able to continue to manage their funds and indexes effectively throughout the period (albeit requiring enhanced investor communications and, for many, a reclassification of the investibility of Russian securities)
The ability for recommended fund managers to be able to continue to deliver strategies in line with their published mandates was reinforced by their responses to our quarterly due diligence checklist When given the option to do so, each fund manager chose not to flag the Russian Invasion and their subsequent divestment from Russian Securities as an extraordinary event that would otherwise interfere with their ability to maintain the respective fund mandate.
Based on our analysis summarised above, we agree that despite the event itself being extraordinary, each manager has been able to demonstrate they have been able to act appropriately and in line with their respective fund mandates and indices they may follow.
June 2022
Disclaimer: The material contained in or attached to this report has been prepared based upon information that Consilium NZ Limited believes to be reliable, but may be subject to typographical or other errors. Consilium has taken every care in preparing this information, which is for client education purposes only. Although the data has been sourced from publicly available information and/or provided by the investment managers, we are not able to guarantee its accuracy. Past performance, whether actual or simulated, is no guarantee of future performance. This document does not disclose all the risks of any transaction type described herein, and the recipient should understand any terms including relevant risk factors and any legal, tax and accounting considerations applicable to them.
One or more of the author(s) of this report invest in the analysed security. The author(s) do not know of the existence of any conflicts of interest that might bias the content or publication of this report. Compensation of the author(s) of this report is not based on any outcome of this report.
An enhanced due diligence (EDD) on a fund may be required for any number of reasons. Please refer to the CIC Policy and Procedures Manual for more detail.
Fund: Dimensional Emerging Markets Value Trust (“the trust”)
Benchmark: MSCI Emerging Markets Value Index (net div AUD) (“the benchmark”)
The trigger for this analysis was long term tracking error (Appendix 1)
Fund return (Net of fee): 5.84% (p.a.), Benchmark return: 2.51% (p.a.), Deviation (Gross): +4.03% (p.a.), Tolerance: ±3.08% (p.a.)
Has the investment mandate changed? (Appendix 2)
Was relative performance attributable to known risk tilts and/or exclusions? (Appendix 3, 4)
Were the risk levels acceptable? (Appendix 5)
Were there any special considerations?
Conclusion
Our findings conclude that the outperformance is largely attributable to the same compositional factors that explain the recent positive quarterly deviations of performance The trusts structural elements tilting towards value companies with small capitalisations, along with selective regional exposure, were the primary drivers of the 3-year outperformance and they more than offset the impact of the highly disparate sectoral returns which, in aggregate, contributed negatively over the three-year period These elements are consistent with our previous quarterly flags, which has now resulted in an additive effect providing our 3-year outperformance.
We remain satisfied the identified risk exposures are consistent with the trust mandate, and we identified no unexpected or unexplained risks.
Based on all the above, the committee was satisfied that the Dimensional Emerging Markets Value Trust passed this EDD review. For further information please see the appendix on the following pages.
June 2022
Figure 1: 3-year (annualised) deviation from benchmark
Source: Consilium
The Dimensional product disclosure statement (PDS) applicable to Q1 2022 was dated 02 August 2021. The stated objective of the trust is:
The investment objective of the Trust is to provide long-term capital growth by gaining exposure to a diversified portfolio of Value Companies associated with approved emerging markets.
The Trust is not managed with the objective of achieving a particular return relative to a benchmark index. However, to compare the performance of the Trust with a broad measure of market performance, reference may be made to the MSCI Emerging Markets Index (net div.).

The CIC has frequent dialogue with the fund manager, and we are satisfied there has been no change to the strategy/mandate without our knowledge.
The trusts performance commentary (in AUD) for the quarter states:
The trust returned -1.3% for the quarter (or 5.84% (per annum) over three years), leading the MSCI Emerging Markets Value Index by 3.32% (per annum) over the period The focus on value stocks, particularly those with higher profitability, drove outperformance
While equities fell broadly, value stocks outperformed, with the MSCI All Country World IMI Value Index beating the growth index by 9%. Low profitability growth stocks were particularly hard hit. Despite a negative size premium, value stocks offered some respite for small cap investors as value paid off within small caps as it did within large caps.
In emerging markets, value stocks with higher profitability gained 1.1%, outperforming growth stocks by over 16%. The portfolio held 24% more weight in value stocks with higher profitability than the MSCI Emerging Markets Value Index. Additionally, as Russian stocks plummeted, the portfolio’s 2% underweight to Russian stocks further contributed to outperformance.
The stated Portfolio Structure for the trust is as follows:
Dimensional’s Emerging Markets Value Trust is designed to capture the returns associated with the value premium in emerging markets by investing in stocks with relative prices in the lowest 33% when ranked by price to book across all market capitalisations. Within this universe, the trust is designed to target higher expected return securities by overweighting smaller market capitalisations, lower relative price stocks, and higher profitability stocks The trust uses information in market prices every day to systematically pursue higher expected returns while managing risks and controlling costs.
Allocation attribution of all regional exposure shows a cumulative impact of +625bps A reduced exposure to China, reduced allocations to Russia and a sizable overweight allocation to Taiwan all contributed to a strongly positive regional attribution over the period.
Allocation attribution of all industry exposure shows a cumulative impact of -266bps This analysis demonstrates that the value tilt contributed to an overweight allocation to energy and an underweight allocation to IT companies, both of which delivered significant negative attribution over the period in question.
Allocation attribution by size finds a cumulative impact of +364bps. This analysis helps explain majority of the trusts outperformance relative to the index and is consistent with Dimensional’s fund commentary highlighting a positive small cap premium.
Allocation attribution by book to market ratio shows a cumulative impact of +90bps This is consistent with the value tilt (or more noticeably the underweight exposure to unprofitable growth companies) delivering a small positive performance over the three years.
Tables 3 and 4 ultimately demonstrate the stated portfolio structure was able to deliver positive premia from investments in smaller market capitalisation, lower relative priced, high profitability companies.
Collectively, the attributions explain significantly more outperformance than the gross EDD flag of 4.03% implies. However, this is due to an element of double counting between the various attributions and the fact that this three-year attribution required particularly volatile average returns be attributed to a simple average of segment weights. Any differences in timing between when the weights were held and the volatile returns were delivered, magnifies the likelihood of distortions in the attribution outputs (particularly when segment weights are small).

Source: Consilium
Source: Consilium
We note the fund’s relative price to book ratio remains low in comparison to previous periods, however the deeper value allocation while still within the funds mandate has been a source of outperformance in recent quarters.


Source: Consilium

Source: Consilium
Aside from some Covid related volatility, we note the weighted average market capitalisation of the trust versus the benchmark has otherwise been relatively stable since 2018.
Disclaimer: The material contained in or attached to this report has been prepared based upon information that Consilium NZ Limited believes to be reliable, but may be subject to typographical or other errors. Consilium has taken every care in preparing this information, which is for client education purposes only. Although the data has been sourced from publicly available information and/or provided by the investment managers, we are not able to guarantee its accuracy. Past performance, whether actual or simulated, is no guarantee of future performance. This document does not disclose all the risks of any transaction type described herein, and the recipient should understand any terms including relevant risk factors and any legal, tax and accounting considerations applicable to them.
One or more of the author(s) of this report invest in the analysed security. The author(s) do not know of the existence of any conflicts of interest that might bias the content or publication of this report. Compensation of the author(s) of this report is not based on any outcome of this report.
Enhanced due diligence trigger
An enhanced due diligence (EDD) on a fund may be required for any number of reasons. Please refer to the CIC Policy and Procedures Manual for more detail.
Fund: Harbour Corporate Bond Fund (“the fund”)
Benchmark: S&P/NZX A-Grade Corporate Bond Index (“the benchmark”)
The trigger for this analysis was long term tracking error (Appendix 1)
Fund return (Net of fee): 0.17% (p.a.), Benchmark return: 0 21% (p.a.), Deviation (Gross): +0.40%,
Tolerance: ±0.40%
Has the investment mandate changed? (Appendix 2) No ✓
Were the risk levels acceptable and within mandate (Appendix 3)? Yes ✓
Were there any special considerations (Appendix 4)? No ✓
From 2020 Q3 to 2021 Q1 the fund exhibited three straight quarters of material outperformance which were attributable to the fund’s compositional differences relative to the benchmark. Our findings concluded that the aggregation of outperformance exhibited during these three quarters created an additive effect that resulted in this 3-year outperformance flag
Relative duration, diversification of sectors, exposure to government inflation-linked securities and credit risk were some of the primary drivers which lead to the three straight quarters of material outperformance. Please see appendix 3 for further details. In each of these quarters, the CIC were satisfied the fund was managed within its mandate and the additional performance was adequately explained by these allowable exposures.
Given the additive nature of this three yearly flag, we equally remain satisfied that the fund’s exposure levels remained within mandate and broadly in line with historical observations. We also identified no unexpected or unexplained risks. This has been a volatile period for the asset class and the increase in volatility has been the primary source of increased tracking error over the recent quarters.
Based on all the above, the committee was satisfied that the Harbour Corporate Bond Fund passed this EDD review. For further detail please see the appendix on the following pages.
The Harbour product disclosure statement (PDS) applicable to Q1 2022 was dated 21 March 2021. The stated objective of the trust is:
The Fund provides access to favourable income yields through a diversified portfolio of primarily investment grade corporate bond fixed interest securities.
The CIC has frequent dialogue with the fund manager, and we are satisfied there has been no change to the strategy/mandate without our knowledge.
During Q3 of 2020 the fund produced 28bps of outperformance relative to the benchmark After discussions with Harbour, we were able to satisfactorily conclude the outperformance was attributable to observable factors. Stock selection for the quarter contributed 31bps, with its largest contributor being an early position in the 2050 Auckland council bond The fund’s position in government inflation-linked securities positively contributed 8bps, it also experienced diversification benefits from holding exposure greater than 5% to six sectors, compared to the benchmarks three. Please see here for further details.
During Q4 of 2020 the fund produced 42bps of outperformance relative to the benchmark Again, after discussions with Harbour we were able to largely attribute this outperformance to the following factors The fund held 0.25 (years) less duration than the benchmark over the quarter, contributing to 14bps of outperformance. This duration positioning was well within its allowable ±0.5 years duration (vs benchmark), however, given sharp market movements it resulted in meaningful attribution. During the quarter, credit also tightened resulting in some lower grade credit outperformance, this benefited the fund as compared to

the benchmark it has held on average 10.3% exposure to BBB rated securities. Please see here for further details.
During Q1 of 2021 the fund produced 51bps of outperformance relative to the benchmark Harbour acknowledged that the fund signalling for three consecutive quarters may be of concern to the CIC but were able to show it was directly proportional to the increased volatility in markets and their compositional differences to the benchmark. Significant contributors to outperformance this quarter were again duration positioning and exposure to both government inflation-linked securities and BBB rated securities. Please see here for further details.
The additive effect of these three quarterly outperformances (all explained and within mandate) can clearly be seen by comparing the 3 year annualised deviation of the fund from its benchmark (Figure 2, top chart), with the quarterly deviations (Figure 2, bottom chart). These three quarters explain almost the entire aggregate three yearly outperformance.
Harbour Corporate Bond Fund 3 year (annualised) gross deviation from benchmark
Harbour have a very strong internal fund compliance process and it is highly unusual for the fund to ever be in breach of its investment guidelines. Certificates confirming mandate compliance are supplied to Consilium each quarter. Historically, instances of any mandate breaches have been very rare, generally very minor, and always remediated promptly (ensuring no disadvantage to investors in the fund). No significant breaches were reported over this three year period.
We are in regular communication with Harbour and monitor a range of different fundamental data as part of our ongoing monitoring process. In some ways, the most restrictive constraint within the investment guidelines relates to the allowable duration, as the fund is required to maintain duration at ±0.5 years of the underlying duration of the S&P/NZX A Grade Corporate Bond Index.
As per Figure 3 (next page), we can confirm this particular guideline has not been breached.
Source: Consilium
Whilst the Harbour Corporate Bond Fund is not an index tracking fund (i.e. it has some discretion around various entity and credit exposures) the broad aim is to deliver a broadly comparable investment outcome to anyone with a theoretical exposure to the S&P/NZX A Grade Corporate Bond Index.
The granular verification of this would require a significant and detailed deconstruction of individual holdings over time (which we believe is unnecessary in this case when we are already clear about the source of the current three year performance flag). However, a much simpler comparison we can provide is a comparison of the relative yield to maturity of the fund versus the S&P/NZX A Grade Corporate Bond Index.
As highlighted in Figure 4 (below), the fund has consistently maintained an average yield to maturity of around 10 - 25bps higher than the index over the last decade.
Source: Consilium
Quite clearly, although the composition of the fund holdings will usually be different (by design), the historical duration and yield characteristics of the fund both confirm the fund mandate is being managed consistently in line with the index.
Disclaimer: The material contained in or attached to this report has been prepared based upon information that Consilium NZ Limited believes to be reliable but may be subject to typographical or other errors. Consilium has taken every care in preparing this information, which is for client education purposes only. Although the data has been sourced from publicly available information and/or provided by the investment managers, we are not able to guarantee its accuracy. Past performance, whether actual or simulated, is no guarantee of future performance. This document does not disclose all the risks of any transaction type described herein, and the recipient should understand any terms including relevant risk factors and any legal, tax and accounting considerations applicable to them.
One or more of the author(s) of this report invest in the analysed security. The author(s) do not know of the existence of any conflicts of interest that might bias the content or publication of this report. Compensation of the author(s) of this report is not based on any outcome of this report.
Enhanced due diligence for the quarter ended 31 March 2022
Enhanced due diligence trigger
An enhanced due diligence (EDD) on a fund may be required for any number of reasons. Please refer to the CIC Policy and Procedures Manual for more detail.
Fund: Dimensional Five-Year Diversified Fixed Interest Trust – NZD Class (“the trust”)
Benchmark: FTSE World Government Bond Index 1-5 Years (Hedged) (“the benchmark”)
The trigger for this analysis was short term tracking error (Appendix 1)
Fund return (Net of fee): -4.48%, Benchmark return: -2.24%, Deviation (Gross): -2.17%, Tolerance: ±1.59%
Enhanced due diligence checklist
Conclusion
Following our analysis of the trust – specifically, the performance attribution – the CIC is satisfied the trust’s underperformance through the quarter ended 31 March was due to structural elements of the trust relative to its benchmark The trusts corporate bond exposure, duration profile and compositional differences within each currency allocation were the primary sources of underperformance.
The compositional analysis of this report was insightful, and we remain satisfied the identified risk exposures are consistent with the trust mandate, and we identified no unexpected or unexplained risks.
Based on all the above, the committee was satisfied that the Dimensional Five-Year Diversified Fixed Interest Trust passed this EDD review.
For further information please see the appendix on the following pages.
August 2022

The Dimensional product disclosure statement (PDS) applicable to Q1 2022 was dated 26 May 2020. The stated objective of the trust is:
Within the risk constraints of investing in eligible short to intermediate-term, high credit quality instruments, the objective of the Trust is to maximise the return of a broadly diversified portfolio of domestic and global fixed interest and money market securities.
The Trust is not managed with the objective of achieving a particular return relative to a benchmark index. However, to compare the performance of the Trust with a cash index, reference may be made to the Bloomberg AusBond Bank Bill Index (AUD class units) or the Bloomberg NZBond Bank Bill Index (NZD class units).
The CIC has frequent dialogue with the fund manager, and we are satisfied there has been no change to the strategy/mandate without our knowledge.
It should be noted that although Dimensional has referenced the cash index we elect to use the FTSE World Government Bond Index 1-5 Years (hedged to NZD) which better reflects the duration risk the fund takes better than cash does.
The trusts performance commentary (in AUD) for the quarter stated:
The trust underperformed the Bloomberg AusBond Bank Bill Index by 4.61%.
Interest rates broadly increased across global developed markets for the quarter. For example, for government bonds, the Australian five-year yield increased by 124 basis points (bps) to 2.56%.
The Canadian five-year yield increased by 114 bps to 2.39%. The German five-year yield
increased by 84 bps to 0.34%. The Japanese five-year yield increased by 12 bps to 0.03%. The UK five-year yield increased by 67 bps to 1.43%. The US five-year yield ended the period at 2.50%, an increase of 123 bps.
Realized term premiums were negative across global developed markets as longer-term bonds underperformed their shorter-term counterparts. As a result, the trust’s longer duration detracted from performance relative to the bank bill index.
The trusts positioning commentary (in AUD) for the quarter states:
The yield curves in global developed markets began the quarter generally upwardly sloped, indicating positive expected term premiums. During the quarter, eligible yield curves steepened in the short-term segment and flattened in the intermediate term segment, with the two- to three-year maturity segment generally providing the highest expected returns. As a result, the trust began to focus on bonds in the two- to three-year maturity range. However, the duration of the trust remained longer than that of the Bloomberg AusBond Bank Bill Index over the quarter. At the end of the quarter, the trust’s duration was 3.57 years, while the reference index’s duration was 0.13 year.
Bonds denominated in the Australian dollar, Canadian dollar, New Zealand dollar, and US dollar generally exhibited some of the highest currency-hedged expected returns globally. As such, the trust generally focused on bonds denominated in these currencies.
Due to the volatile events of the quarter, funds experienced a wide dispersion of returns and even a modest over or underweight will have had a material impact on relative performance The following attribution analysis versus the benchmark, FTSE World Government Bond Index 1-5 Years (Hedged), show us where the differences in exposure lie and where the sources of performance were.
Table 1
Allocation Attribution by security type for trust relative to benchmark, Q1 2022
We observe that the trusts relative overweighting to Corporate Bonds lead to 0.37% of allocation underperformance, this is consistent with Dimensional’s commentary of widening credit spreads through the quarter.
Overall allocation by credit rating accounted for a positive 7bps of relative fund outperformance. This analysis found mixed results. There was positive allocation performance from being overweight to AAAs, and underweights to AAs, however this was largely offset by the underweight position to the outperforming A and BBB rated securities.
We look closer at the exposure levels by security type and credit rating later in the paper.
The aggregate allocation by duration attributed -102bps of relative fund underperformance.
The trust held bonds of longer average duration than the benchmark (weighted average of 3.57 years vs 2.70 years) and we see the relative positioning in aggregate detracted from the performance through the quarter The result is consistent with Dimensional’s fund commentary highlighting a steepening of the shortterm yield curve through the quarter and a flattening of the intermediate yield curve
There was wide dispersion of the average return of currencies, which was driven by each currency groups make up (duration and quality), and their position at the start of the period.
The quarter’s changing inflationary expectations were a contributing factor in rising yield curves as illustrated in figure 2. Central banks generally changed their signalling from an expectation that inflation would be transitory to a concession that it would in fact be more persistent. The Federal Reserve shifted in
March to raise their benchmark interest rate for the first time since 2018, while also providing guidance that more rate hikes were to come
With the yield curves shifting upward, we see negative performance from the government bond holdings of the benchmark Figure 2 and Table 4 shows the negative performance can largely be attributable to the sharp increase in yields which led to negative term premium. Japanese Yen was the only positive currency return, seen to be attributable to the Bank of Japan’s unwavering commitment to low interest rates,


In aggregate, attribution by currency resulted in -75bps of underperformance relative to the benchmark Dimensional communicated they expected the AUD, CAD, NZD and USD to exhibit the highest currencyhedged expected returns globally and table 5 provides consistency with this. The trust is intentionally allocating higher than benchmark weights to steeper yield curves which give a higher expected roll down return.
Data source: Dimensional Fund Advisors and Consilium calculations
The compositional attribution by currency highlights sources of relative underperformance within currency allocation As the trust intentionally allocates higher than benchmark weights to securities with higher expected returns, we will see differences between currency allocations duration and credit profile
To provide an example of this we present below the relative holdings of just USD bonds on figures 3 and 4. Figure 3 shows us the average weight by credit rating (the columns) and by duration of the underlying bond (the rows) for the benchmark (the blue bubbles, bigger bubbles mean larger allocations), and the trust (purple bubbles). These are presented across a matrix of returns for each segment
Looking closely at the AA rated, 4–5-year cell, we see a negative segment return of -4.7% The trust took 15% exposure to this allocation in comparison to the benchmarks 9%
From also looking across the whole matrix, we see a high density of the trust’s allocation to poor performing bonds with relatively longer duration. The benchmark on the other hand has a high density of allocations to relatively better performing bonds of shorter duration, accordingly, for Q1 2022, the trusts relative USD positions were a source of underperformance.
Figure 4 presents these average exposures again and further highlights the difference in composition of USD exposure. The benchmark takes a large exposure across the currency group, with density in the 1-3 year region, while the trust has far less exposure across the board. We also observe the benchmark only allocated to quality AA bonds (specifically US treasuries)
This particular analysis highlights the significant difference between how exposure can be taken within the currency allocations, further snapshots by currency are presented in Appendix 2 below
Figure 3: Average trust and benchmark weights within USD with segment performance, Q1 2022

Data source: Dimensional Fund Advisors and Consilium calculations
Figure 4: Average trust and benchmark weights within USD by duration and credit quality, Q1 2022


Data source: Dimensional Fund Advisors and Consilium calculations
Generally, over short time periods (such as one quarter) there is not significant variation in performance across close ratings or duration buckets. But given the extraordinary events that occurred during the quarter it has resulted in different compositions having an unusually substantial impact on relative performance. Overall, the attribution analysis has identified that the underperformance during the quarter is largely explained by the trust’s higher relative exposure to corporate bonds, higher exposure to yield curves that moved the most, and compositional duration and credit differences within each currency allocation. However, understanding the sources of relative underperformance is only the first part of the EDD, the second part is to ascertain whether the trust consistently operated within its mandate during Q1 2022

First, we look at the historical relative exposures of currency between the trust and index
Data source: Dimensional Fund Advisors, FTSE
We note relative overweights/underweights have changed significantly over the historical observations, specifically the variation in relative USD and EUR exposures The chart clearly depicts Dimensional’s aggressiveness in positioning where they expect the highest returns The latest positioning of the trust is being driven by the steepness seen in the AUD and USD yield curves as communicated by Dimensional
Discussions with Dimensional have confirmed the trust has no relative limits for either, currency or issuing country, given the use of a cash benchmark. Rather, the absolute limits are a 75% maximum to the USD yield curve, a 50% maximum limit to the Euro, and 30% max to GBP, CAD and JPY. For smaller markets like Singapore, New Zealand and other European curves like the Swedish Krone there is a 10% portfolio limit. Dimensional’s variable maturity strategies allow up to 100% in the base currency of the account which means there is no limit on the trust’s allocation to Australian dollar securities
Next, we look at credit risk. The historical relative exposures by security type are summarised below in figure 6, followed by the relative exposures by credit rating in figure 7
Data source: Dimensional Fund Advisors
Data source: Dimensional Fund Advisors
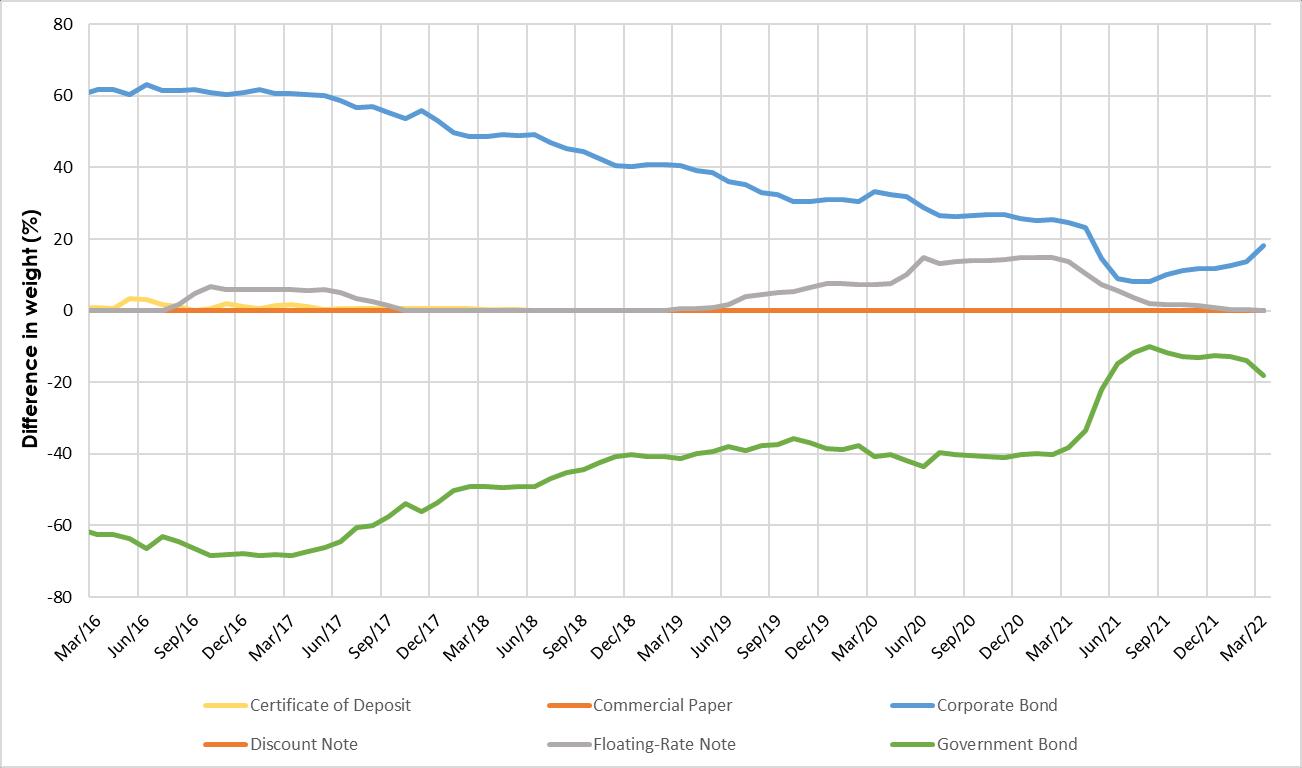
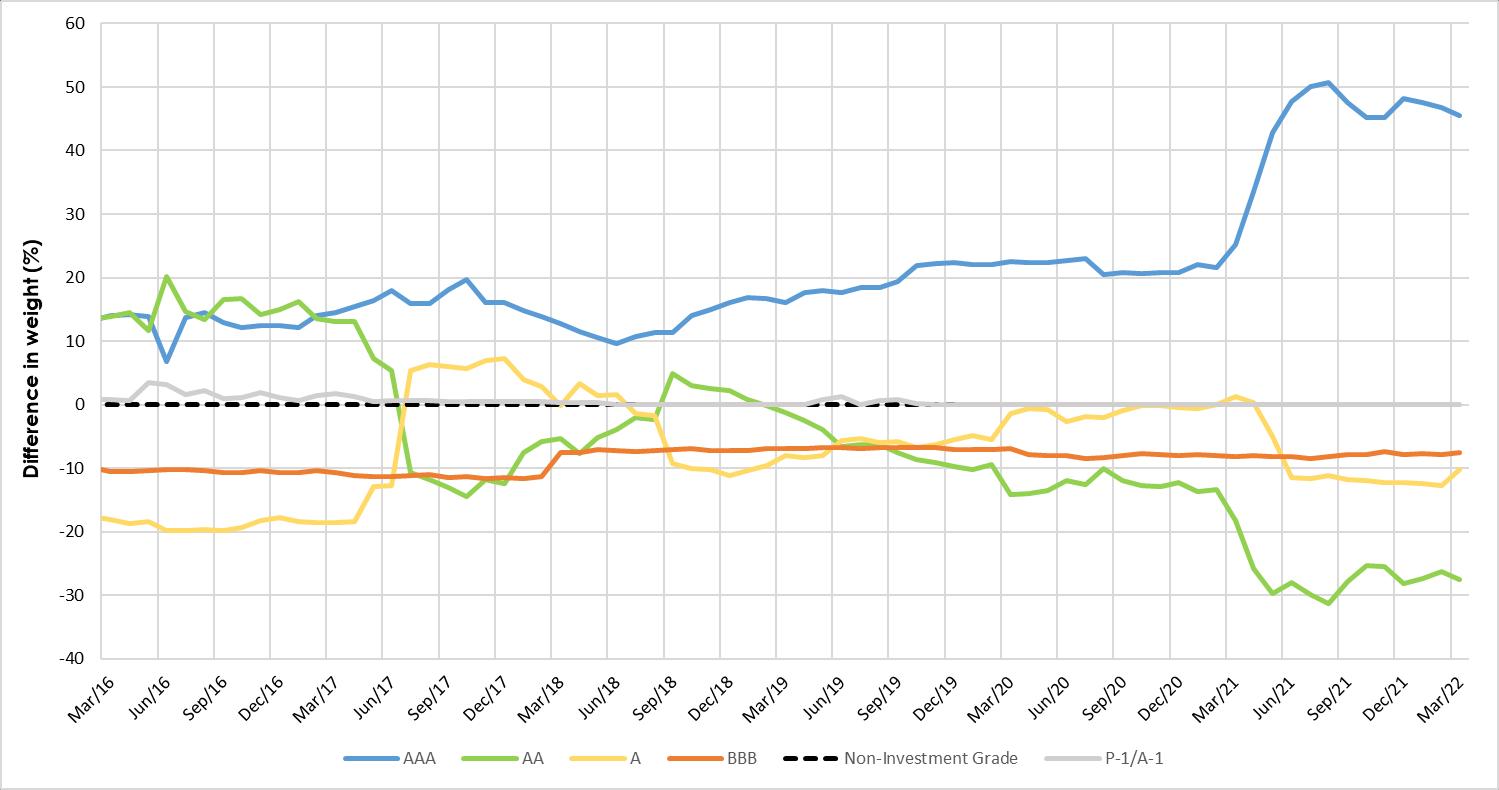
We observe a persistent overweight to corporate bonds being achieved through an underweight to government bonds. We also observe an overweight to AAA bonds achieved by underweighting to all other investment grade bonds This chart does not illustrate it, but we can confirm the trust has not taken any exposure to bonds rated below A as per its mandate
The Q1 2022 relative positioning by both security type and credit rating is consistent with the previous year The committee finds no evidence of unacceptable exposure, although we do note its current exposures are among the most extreme relative to historical observations (in particular the USD and AAA overweights) in response to the current environment.
The historical duration is summarised below.
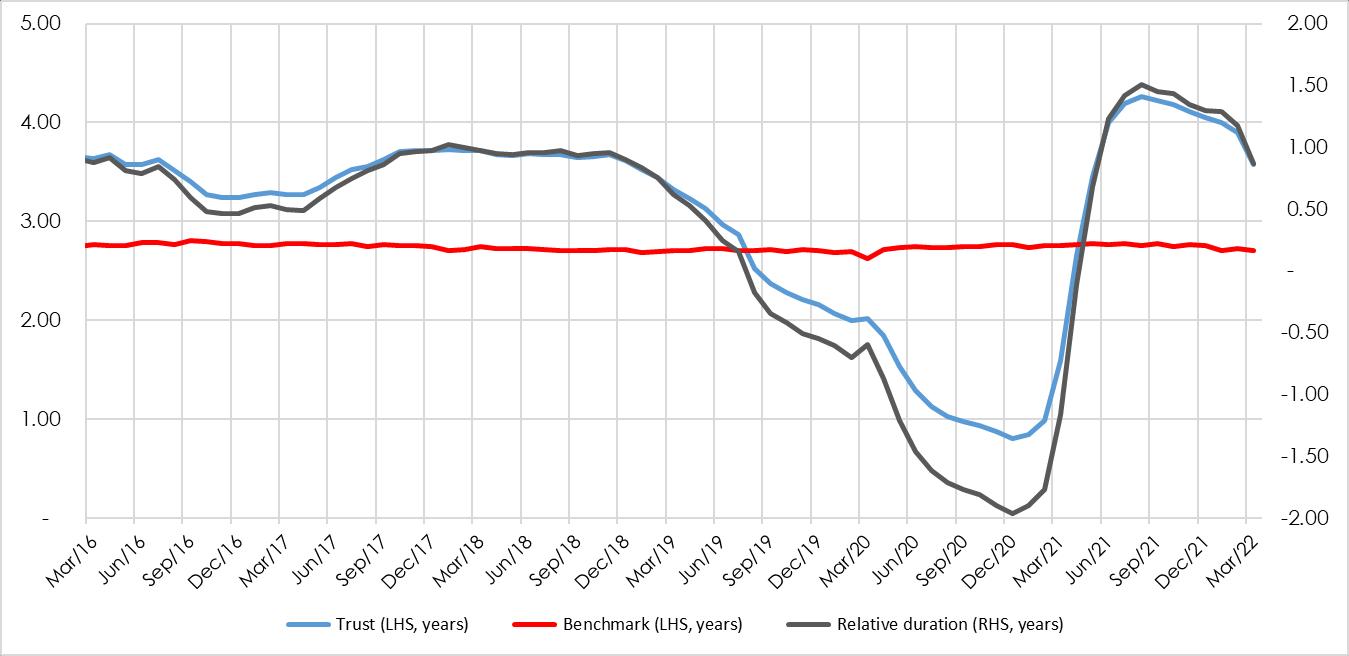
The CIC notes that the relative exposure is consistent with the trust’s strategy, which is to reduce duration exposure as yield curves flatten. However, during the previous two years, the trust’s strategy has led it to take unfortunate duration positioning. It decreased duration in 2019 and so missed out the benefits of the surprise rate cuts and yield compression following the outbreak of COVID-19. Subsequently, the trust has increased duration before the negative impacts of a faster than expected interest rate hike cycle during 2022
We held discussions with Dimensional in regard to all of their international fixed income trusts’ relative underperformance through these two contrasting events. Dimensional detailed their ongoing research into fixed income and the risk premiums available in this asset class. Examples of recent research include
- Other signals of expected return of bonds such as the equity profile of an issuer1 ,
1 See The Cross-Section of Global Corporate Bond Returns, Lee, Rizova, Wang 2022
All of these studies have found negligible (if any) improvement available to the existing strategies and they have not elected to make any change following these two somewhat exceptional periods.
This is reasonable. We should not and do not aim to build portfolios that are optimal during market corrections. Such portfolios would be of very low risk and thus never collect the risk premia we are intentionally and strategically seeking to collect over the long term. Nor is there any reliable way of predicting when such corrections will occur. We remain satisfied Dimensional’s approach to systematic fixed income investing is the best available to New Zealand investors at this time.
We also discussed the high allocation to Australia. In Dimensional’s similar mandates around the world there is generally not a maximum exposure to the locally domiciled bonds. In this case that is the Australian Dollar which is among the steepest yield curves available to the Trust. The unintended consequence for New Zealand investors is a large overweight to our trans-Tasman neighbours.
Although discussions of the strategy uncovered the less than perfect structure New Zealand investors receive which has contributed to underperformance during this quarter, the committee is ultimately satisfied the trust has at all times been invested within its investment guidelines and was taking mandated currency, security type and duration risk tilts. We accept the performance for the quarter ended 31 March 2022 and continue to recommend the fund as part of our supported model portfolios.
Disclaimer: The material contained in or attached to this report has been prepared based upon information that Consilium NZ Limited believes to be reliable, but may be subject to typographical or other errors. Consilium has taken every care in preparing this information, which is for client education purposes only. Although the data has been sourced from publicly available information and/or provided by the investment managers, we are not able to guarantee its accuracy. Past performance, whether actual or simulated, is no guarantee of future performance. This document does not disclose all the risks of any transaction type described herein, and the recipient should understand any terms including relevant risk factors and any legal, tax and accounting considerations applicable to them.
One or more of the author(s) of this report invest in the analysed security. The author(s) do not know of the existence of any conflicts of interest that might bias the content or publication of this report. Compensation of the author(s) of this report is not based on any outcome of this report.
United States Dollar: 2.16% underweight to the underperforming currency meant 2bps positive allocation attribution. Trust return within currency of -4.86% relative to -3.11% for benchmark meant -88bps negative compositional attribution.
Australian Dollar: 40.34% overweight to the underperforming currency meant -30bps negative allocation attribution. Trust return within currency of -4.33% relative to -2.99% for benchmark meant -55bps negative compositional attribution.


New Zealand Dollar: 4.80% overweight to the underperforming currency mean -2bps negative allocation attribution. Trust return within currency of -2.75% relative to 0.00% for benchmark meant -13bps negative compositional attribution.


Canadian Dollar: 1.65% overweight to the currency that performed as benchmark meant 0 bps of allocation attribution. Trust return within currency of -4.18% relative to -2.24% for benchmark meant -7bps negative compositional attribution.


Euro: 28.04 underweight to the outperforming currency meant -18bps negative allocation attribution. Trust does not allocate to this currency so no compositional attribution.
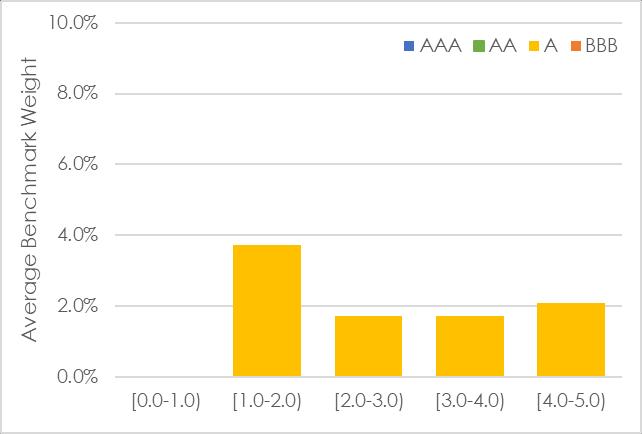
Japanese Yen: 9.26% underweight to the outperforming currency meant -21bps negative allocation attribution. Trust does not allocate to this currency so no compositional attribution.
British Pound: 2.64% underweight to the outperforming currency meant -2bps negative allocation attribution. Trust does not allocate to this currency so no compositional attribution.
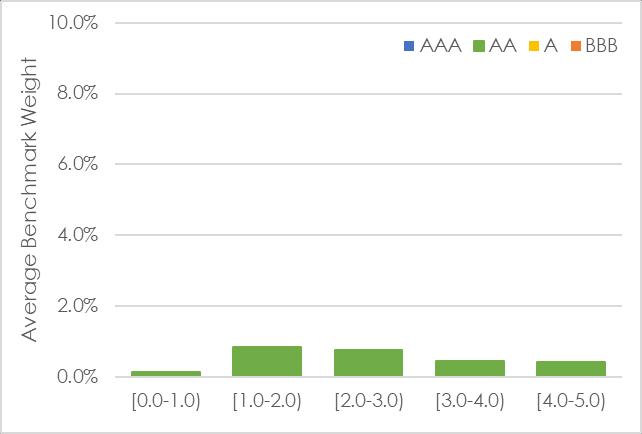
Consistent with its written policies and procedures, the Consilium Investment Committee (CIC) reviews all recommended investments on a quarterly basis against a combination of investment performance and quantitative fund metrics.
In the first quarter of 2022, the below named Dimensional trusts (“the trusts”) were flagged for enhanced due diligence (EDD) due to an advised change in fund mandate
▪ Dimensional Global Bond Trust (NZD)
▪ Dimensional Global Bond Sustainability Trust (NZD)
On 16 February 2022, Dimensional Fund Advisers (DFA) announced a change in the mandate of the two trusts The specific change in relation to the underlying trust strategy(s) was that “the upper limit of the maturity range of bonds that the trusts will primarily invest in will increase from 15 years to 20 years”.
Through our regular monitoring discussions with Dimensional we were able to confirm that the investment strategies are entirely unchanged, this is merely a widening of the investable universe and has been introduced in response to the increased issuance of long duration bonds over the last few years.
Although both trusts hold exposures to long duration bonds, their investment mandates prevent Dimensional from introducing significant additional duration tilts into the trusts because trust duration must be maintained within the limits of -0.5 years to +1.5 years of the duration of the underlying index. Having an ability to allocate to bonds with maturities of up to 20 years (as opposed to the previous maximum of 15 years) will simply allow Dimensional fund managers a greater choice of security combinations as they look to deliver these mandates.
Whilst individual bonds that mature further in the future are exposed to a higher risk of unexpected changes in interest rates, within the diversified bond trusts these longer duration bonds will be blended with shorter duration bonds to ensure the overall trust duration guidelines continue to be met
And, as these trust guidelines are not changing and we do not anticipate any change in the way the mandates will be managed, we also do not anticipate any change in the expected risk and return of the trusts to result from this widening of the investible universe
These expectations are reinforced when we review the respective duration histories of the two trusts versus their benchmark over time (as per Figures 1 and 2 on the following page)
Figures 1 and 2 below illustrate that both trusts have closely tracked the duration of the benchmark Bloomberg Global Aggregate Bond Index, and we do not expect this to change.


The CIC are satisfied that the DFA Global Bond Trust and DFA Global Bond Sustainability Bond Trust have both passed this EDD review.
August 2022
Disclaimer: The material contained in or attached to this report has been prepared based upon information that Consilium NZ Limited believes to be reliable but may be subject to typographical or other errors. Consilium has taken every care in preparing this information, which is for client education purposes only. Although the data has been sourced from publicly available information and/or provided by the investment managers, we are not able to guarantee its accuracy. Past performance, whether actual or simulated, is no guarantee of future performance. This document does not disclose all the risks of any transaction type described herein, and the recipient should understand any terms including relevant risk factors and any legal, tax and accounting considerations applicable to them.
One or more of the author(s) of this report invest in the analysed security. The author(s) do not know of the existence of any conflicts of interest that might bias the content or publication of this report. Compensation of the author(s) of this report is not based on any outcome of this report.
An enhanced due diligence (EDD) on a fund may be required for any number of reasons. Please refer to the CIC Policy and Procedures Manual for more detail.
In the second quarter of 2022, the below Vanguard fund (the fund) was flagged for enhanced due diligence (EDD)
The EDD flag was due to receiving notification of a change to the funds’ key personnel. Vanguard notified us via their quarterly checklist that they had experienced a change in key fund management personnel James Chatfield has been promoted to Senior Portfolio Manager, Ian Campbell has been promoted to Portfolio Manager, and Victoria Chai has been promoted to Equity Trader/Index Analytics. All three personnel work within the Australian Equity Index Investment Group.
Vanguard provided the CIC with an organisational chart outlining the senior management within the equity team and gave a detailed summary of the three individuals presented below Victoria Chai is an Equity Trader/Index Analyst within Vanguard’s Australian Equity Index Investment Group. In this role, Victoria is responsible for the daily management of equity trades, monitoring index changes and corporate actions. Prior to this Victoria Chai was an Investment Data Analyst within the Global Data Management (GDM) team for Vanguard Asia Pacific. In this role, Victoria was responsible for the delivery and maintenance of start of day and proforma benchmarks, security set-up, risk models, portfolio positions, corporate actions treatment and ETF baskets Prior to joining Vanguard in 2016, Victoria worked in performance and risk analytics in the Asset Servicing department of National Australia Bank (NAB), as well as in Quality Assurance at MLC/NAB Wealth. Victoria holds a Bachelor of Commerce (Accounting and Finance) from the University of Melbourne and has completed all three levels of the CFA program.
James Chatfield is a Senior Portfolio Manager and Team Leader within Vanguard’s Australian Equity Index Investment Group. In this role, James is responsible for the daily management of equity trades, monitoring index changes, corporate actions and market micro-structure for the Asia-Pacific region on behalf of Vanguard’s global funds. Prior to joining Vanguard Australia in March 2016 as an Assistant Portfolio Manager and Senior Equity Trader, James gained more than 20 years’ experience in the finance industry, serving for four years as
Director and Head of APAC sales for Liquidnet, and more than 15 years at Lazard Asset Management in a number of roles including trading institutional equities across all APAC markets. James holds a Bachelor of Science in Economics from Loughborough University.
Ian Campbell is a Portfolio Manager within Vanguard’s Australian Equity Index Investment Group. In this role, Ian is responsible for the daily management of equity & derivative trades, monitoring index changes, corporate actions, and market microstructure the Asia-Pacific region on behalf of Vanguard’s global funds. Prior to his current role, Ian spent several years as an Equity Trader within the same team, and prior to that Ian was as a Senior Data analyst in Vanguards Global Data Management team, spending the majority of 2013 on secondment to the US head office in Malvern, as part of a global data management project. Ian holds a BA in Economics from University College Dublin and a MAppFin from Macquarie University.
Vanguard has substantial depth within their organisation with many in their team being CFA members, combined with years of experience within Vanguard across both fixed income and equity groups.
Vanguard confirmed the personnel changes do not impact the day-to-day management of the fund and noted that they take a team-based approach to investment management, avoiding a star manager system. Each portfolio manager is cross-trained and can carry out investment management responsibilities across all relevant portfolios. Their approach ensures fund management continuity and consistency over the long term.
Although a change in personnel can create many challenges within a business, we are satisfied that the ongoing management and support of the fund will not be materially affected by this change, due to:
1. The fact that the funds mandate is stable, well established and unchanged
2. The investment mandate follows an index replication investment process which significantly minimises the degree of discretion any individual portfolio manager can have in the funds’ allocation
3. At any point in time, the Head of Equity indexing is well supported by a large team of portfolio managers with many years’ experience within Vanguard
Given all the above, the CIC assesses that the fund has passed this enhanced due diligence flag in relation to a change in the key personnel
August 2022
Disclaimer: The material contained in or attached to this report has been prepared based upon information that Consilium NZ Limited believes to be reliable but may be subject to typographical or other errors. Consilium has taken every care in preparing this information, which is for client education purposes only. Although the data has been sourced from publicly available information and/or provided by the investment managers, we are not able to guarantee its accuracy. Past performance, whether actual or simulated, is no guarantee of future performance. This document does not disclose all the risks of any transaction type described herein, and the recipient should understand any terms including relevant risk factors and any legal, tax and accounting considerations applicable to them.
One or more of the author(s) of this report invest in the analysed security. The author(s) do not know of the existence of any conflicts of interest that might bias the content or publication of this report. Compensation of the author(s) of this report is not based on any outcome of this report.
Enhanced due diligence trigger
An enhanced due diligence (EDD) on a fund may be required for any number of reasons. Please refer to the CIC Policy and Procedures Manual for more detail.
Fund: Dimensional Five-Year Diversified Fixed Interest Trust – NZD Class (“the trust”)
Benchmark: FTSE World Government Bond Index 1-5 Years (Hedged) (“the benchmark”)
The trigger for this analysis was long term tracking error (Appendix 1)
Fund return (Net of fee): -1.78% (p.a.), Benchmark return: 0.01% (p.a.), Deviation (Gross): -1.51% (p.a.),
Tolerance: ±1.51% (p.a.)
Following our analysis of the trust – specifically, the performance attribution – the CIC is satisfied the trust’s underperformance for the three years ended 30 June was due to structural elements of the trust relative to its benchmark The trusts overweights to sources of higher expected returns such as the steeper yield curves of different nations and the trust’s small corporate bond exposure, duration profile and compositional differences within each currency allocation have been the primary sources of underperformance
The compositional analysis of the analysed period in this report was insightful, and we remain satisfied the identified risk exposures are consistent with the trust mandate, and we identified no unexpected or unexplained risks.
We note that the trust is nimble and has the ability to quickly adjust to currencies with the highest expected return, which results in significant tracking error to the trust’s imperfect benchmark Due to this strategy the CIC have set wider tolerance bands, however the compounded effects of recent quarterly underperformance (highlighted in figure 2) have resulted in a long-term flag.
Based on all the above, the committee was satisfied that the Dimensional Five-Year Diversified Fixed Interest Trust passed this EDD review For further information please see the appendix on the following pages.
October 2022
Figure 1 – 3 year deviation from benchmark


Source: Consilium
Source: Consilium
The Dimensional product disclosure statement (PDS) applicable to Q2 2022 was dated 26 May 2020. The stated objective of the trust is:
Within the risk constraints of investing in eligible short to intermediate-term, high credit quality instruments, the objective of the Trust is to maximise the return of a broadly diversified portfolio of domestic and global fixed interest and money market securities.
The Trust is not managed with the objective of achieving a particular return relative to a benchmark index. However, to compare the performance of the Trust with a cash index,
reference may be made to the Bloomberg AusBond Bank Bill Index (AUD class units) or the Bloomberg NZBond Bank Bill Index (NZD class units).
Investors should note that the index is referred to for comparison purposes only. The index is not intended to represent the current or targeted asset allocation of the Trust. The performance of the Trust may differ significantly from the index.
The Trust may suit those investors seeking a liquid, low risk, diversified portfolio that provides exposure to the returns of short to intermediate-term domestic and global fixed interest securities.
Dimensional’s fixed interest portfolios are based on dimensions of expected returns that have been identified by academic research. Relative performance in fixed interest is largely driven by two dimensions: bond maturity and credit quality. Bonds that mature further in the future are subject to higher risk of unexpected changes in interest rates. Bonds with lower credit quality are subject to higher risk of default. Extending bond maturities and reducing credit quality increases potential returns.
Ordinarily the Trust invests in a diverse portfolio of high credit quality, domestic and global fixed interest and money market securities, with a maximum maturity of five years from the date of settlement.
In making purchase decisions, if the anticipated term premium is greater for longer-term securities in the eligible maturity range, Dimensional will generally seek to focus investment in that longer-term area, otherwise, Dimensional will generally seek to focus investment in short to intermediate-term securities.
The CIC has frequent dialogue with the fund manager, and we are satisfied there has been no change to the strategy/mandate without our knowledge.
It should be noted that although Dimensional has referenced the cash index we elect to use the FTSE World Government Bond Index 1-5 Years (hedged to NZD) which better reflects the average duration risk and the investment universe of the fund better than cash does.
Due to the volatile events over the past 3 years, fixed income funds experienced a wide dispersion of returns and even a modest over or underweight will have had a material impact on relative performance. Due to this volatile period being the dominant source of underperformance our analysis will be focussed on the 12 months ended 30 June 2022
The following attribution analysis of the trust versus the benchmark show us where the differences in exposure lie and where the sources of performance were
Analysis 1a - attribution analysis by security type and credit rating
Table 1 – Allocation Attribution by security type for trust relative to benchmark, Q3 2021 - Q2 2022
Allocation by security type accounts for an aggregate -51bps of relative fund underperformance
We observe that the trusts relative overweighting to Corporate Bonds lead to -0.57% of allocation underperformance
Analysis 1b - attribution analysis by duration
Table 2 – Allocation Attribution by duration for trust relative to benchmark, Q3 2021 - Q2 2022
The aggregate allocation by duration attributed -180bps of relative fund underperformance.
The trust held bonds of longer average duration than the benchmark over the past year (average weighted average duration of 3.87 years vs 2.73 years) and we see the relative positioning in aggregate detracted from the performance through the period The result is consistent with Dimensional’s fund commentary highlighting a steepening of the short-term yield curve throughout the year and a flattening of the intermediate to long-term yield curve
Currencies experienced reasonable dispersion of average returns, driven by each currency group’s make up (duration and quality) throughout the period. The Japanese Yen is the standout over the period, helped by the Bank of Japan’s unwavering commitment to keeping interest rates low while their monetary counterparts around the globe have undergone the fastest tightening cycle in recent history.
Table 3 –Allocation Attribution by currency for trust relative to benchmark, Q3 2021 - Q2 2022
Data source: Dimensional Fund Advisors and Consilium calculations
In aggregate, attribution by currency resulted in -138bps of underperformance relative to the benchmark.
Dimensional have consistently communicated they expected AUD, CAD, NZD and USD to exhibit the highest currency-hedged expected returns globally, as evidenced by the positioning in table 3 This expectation is consistent with markets as illustrated by figure 3 below.

Data source: Dimensional Fund Advisors and Consilium calculations
Data source: Dimensional Fund Advisors and Consilium calculations
The compositional attribution by currency highlights sources of relative underperformance within currency allocation As the trust intentionally allocates higher relative weights to securities with steeper yield curves to capture greater yield and harness the higher expected roll down return, it will exhibit relative differences in currency allocations, credit profile, and duration
Table 6 provides insight into the primary sources of underperformance exhibited by the strategy over the analysis period
The following analysis and example help to further highlight the strategies current positioning and depicts the trusts full relative holdings of USD bonds. Figure 4 shows us the average weight by credit rating (the columns) and by duration of the underlying bond (the rows) for the benchmark (the blue bubbles, bigger bubbles mean larger allocations), and the trust (purple bubbles). These are presented across a matrix of returns for each segment
By looking across the whole matrix, we see a high density of the trust’s allocation to poor performing bonds with relatively longer duration. The benchmark on the other hand has a higher density of allocations to relatively better performing bonds of shorter duration, accordingly, for Q3 2021 - Q2 2022, the trusts relative USD positions were a source of underperformance.
Figure 5 presents these average exposures again and further highlights the difference in composition of USD exposure. The benchmark takes a large exposure across the currency group, with density in the 1-3 year region, while the trust has less duration diversification exposure. We also observe the benchmark only allocated to quality AA bonds (specifically US treasuries)

This particular analysis highlights the significant difference between how exposure can be taken within the currency allocations, further snapshots by currency are presented in Appendix 2 below
Overall, the attribution analysis section has identified that the underperformance during the one year period has contributed significantly to the three year performance flag. The underperformance is also able to be explained by the trust’s higher relative exposure to corporate bonds, higher exposure to the steepest yield curves, and compositional duration and credit differences within each currency allocation. However, understanding the sources of relative underperformance is only the first part of the EDD, the second part is


to ascertain whether the trust consistently operated within its mandate during the three years ended 30 June 2022
First, we look at the historical relative exposures of currency between the trust and index
Figure 6
Historical relative exposure of trust versus benchmark by currency
Data source: Dimensional Fund Advisors, FTSE
We note that the relative overweights/underweights have experienced significant variation over the historical observations, specifically the variation in relative AUD (yellow dashed line), EUR (grey line) and USD exposures (green dashed line)

Figure 7 illustrates Dimensional’s aggressiveness in positioning where they expect the highest returns, which shown, results in far more variable exposure of the trust as per its strategy, sitting in stark contrast to the stability of the benchmarks currency exposure.
With Dimensional we discussed the high allocation to Australia and similar to other mandates managed by Dimensional around the world there is generally not a maximum exposure to the locally domiciled bonds. In this case that is the Australian Dollar which is among the steepest yield curves available to the trust. The unintended consequence for New Zealand investors is a large overweight to our trans-Tasman neighbours
Dimensional have also confirmed the trust has no relative limits for either, currency or issuing country, given the use of a cash benchmark. Rather, the absolute limits are a 75% maximum to the USD yield curve, a 50% maximum limit to the Euro, and 30% max to JPY and 25% max to GBP, CAD. For smaller markets like Singapore, New Zealand and other European curves like the Swedish Krone there is a 10% portfolio limit. We note that Chinese securities are not eligible. Dimensional’s variable maturity strategies allow up to 100% in the base currency of the account which means there is no limit on the trust’s allocation to Australian dollar securities
Checking these limits versus the exposure levels provided, the committee is satisfied the trust was invested within its investment guidelines and there was no persistent relative exposure by currency that was precluded by the fund mandate
Next, we look at credit risk. The historical relative exposures by security type are summarised below in figure 8, followed by the relative exposures by credit rating in figure 9


Data source: Dimensional Fund Advisors
Data source: Dimensional Fund Advisors

We observe a persistent overweight to corporate bonds being achieved through an underweight to government bonds. We also observe an overweight to AAA bonds achieved by underweighting to all other

investment grade bonds This chart does not illustrate it, but we can confirm the trust has not taken any exposure to bonds rated below A as per its mandate
The three-year relative positioning of security type has been relatively consistent, and we are now seeing a slight uptick back in weighting to corporate bonds over the analysed period which has been a driver of underperformance.
The three-year relative positioning of the trusts credit rating has varied considerable from the previous years of relatively stable exposure. The uptick in positioning to AAA bonds beginning in March 2021 has been a material driver of underperformance
The committee finds no evidence of unacceptable exposure, although we do note its current exposures are among the most extreme relative to historical observations (in particular the USD and AAA overweights) in response to the current environment.
The historical duration is summarised below.
Figure 10 - Historical duration of trust versus benchmark
Data source: Dimensional Fund Advisors
The CIC notes that the relative exposure is consistent with the trust’s strategy, which is to reduce duration exposure as yield curves flatten. However, during the previous two years, the trust’s strategy has led it to take unfortunate duration positioning. It decreased duration in 2019 and so missed out the benefits of the surprise rate cuts and yield compression following the outbreak of COVID-19. Subsequently, the trust has increased duration before the negative impacts of a faster than expected interest rate hike cycle during 2022
Although discussions of the strategy uncovered the less than perfect structure New Zealand investors receive which has contributed to underperformance during the three-year period, the committee is ultimately satisfied the trust has at all times been invested within its investment guidelines and was taking mandated currency, security type and duration risk tilts We remain satisfied Dimensional’s approach to systematic fixed income investing is the best available to New Zealand investors at this time and we accept

the performance for the three years ended 30 June 2022 and continue to recommend the fund as part of our supported model portfolios.
Disclaimer: The material contained in or attached to this report has been prepared based upon information that Consilium NZ Limited believes to be reliable, but may be subject to typographical or other errors. Consilium has taken every care in preparing this information, which is for client education purposes only. Although the data has been sourced from publicly available information and/or provided by the investment managers, we are not able to guarantee its accuracy. Past performance, whether actual or simulated, is no guarantee of future performance. This document does not disclose all the risks of any transaction type described herein, and the recipient should understand any terms including relevant risk factors and any legal, tax and accounting considerations applicable to them.
One or more of the author(s) of this report invest in the analysed security. The author(s) do not know of the existence of any conflicts of interest that might bias the content or publication of this report. Compensation of the author(s) of this report is not based on any outcome of this report.
United States Dollar: 3.07% underweight to the underperforming currency meant 3bps positive allocation attribution. Trust return within currency of -7.11% relative to -4.43% for benchmark meant -132bps negative compositional attribution.
Australian Dollar: 39.89% overweight to the underperforming currency meant -73bps negative allocation attribution. Trust return within currency of -7.63% relative to -5.38% for benchmark meant -92bps negative compositional attribution.


New Zealand Dollar: 4.32% overweight to the underperforming currency meant -17bps negative allocation attribution. Benchmark does not allocate to this currency so no compositional attribution.


Canadian Dollar: 1.93% overweight to the underperforming currency meant 0 bps of allocation attribution. Trust return within currency of -6.00% relative to -3.64% for benchmark meant -10bps negative compositional attribution.


Euro: 28 31% underweight to the outperforming currency meant -13bps negative allocation attribution. Trust return within currency of 0.64% relative to -3.07% for benchmark meant 1 bp of positive compositional attribution.


British Pound: 2.61% underweight to the outperforming currency meant -1 bp of negative allocation attribution. Trust return within currency of 0.34% relative to -3.01% for benchmark meant 0 bps positive compositional attribution.


Japanese Yen: 9.29% underweight to the outperforming currency meant -39bps negative allocation attribution. Trust does not allocate to this currency so no compositional attribution.


Enhanced due diligence trigger
An enhanced due diligence (EDD) on a fund may be required for any number of reasons. Please refer to the CIC Policy and Procedures Manual for more detail.
In the third quarter of 2022, the below Dimensional trusts (the trusts) were flagged for enhanced due diligence (EDD)
▪ Dimensional Global Core Equity Trust NZD Hedged Class
▪ Dimensional Global Sustainability Trust NZD Hedged Class
▪ Dimensional Five-Year Diversified Fixed Int. Trust NZD Class
▪ Dimensional Global Bond Sustainability Trust NZD Class
▪ Dimensional Global Bond Trust NZD Class
▪ Dimensional Two-Year Sustainability Fixed Int. Trust NZD Class
The EDD flag was due to receiving notification from Dimensional via their quarterly checklist that they have engaged with BNP Paribas as an FX Hedge Counterparty.
BNP Paribas is a French international banking group, founded in 2000 from the merger between Banque Nationale de Paris and Paribas, formerly known as the Banque de Paris et des Pays-Bas. The full name of the group's parent entity is BNP Paribas S.A. They have 190,000 employees worldwide and manage 2.6 trillion Euros as of 2021. BNP Paribas is also the ninth largest banking group in the world.
We have previously made contact with Dimensional Fund Advisers (DFA) via our scheduled monthly calls to discuss how they undertake due diligence on counterparties before introducing them to their funds. DFA confirmed by email as follows:
• The addition of new FX counterparties requires approval by the Investment Committee. All FX counterparties are reviewed and approved at least annually by the Investment Committee.
• We require that all approved 3rd party FX counterparties have an active IFEMA or ISDA contract signed on the account. These contracts provide legal protection for counterparties in the case there is a default.
• A daily process is run to identify if the net currency exposure with any counterparty is greater than 1% of Assets on an account-by-account basis. This exposure represents the total unrealized gain on any outstanding FX trade. When an account’s exposure is over 1%, we will stop entering into new FX trades with this counterparty until the number goes back under 1%. If we have a net exposure to a counterparty that begins to show signs of significant financial issues, we will look to close out our existing exposure to the counterparty.
• From a counterparty monitoring standpoint, two daily credit checks are performed:
• We have an internal tool created to aggregate market data, a report is generated to check the market implied credit quality of each counterparty. This report is continuously updated with market pricing which is then charted to look for potential signs of credit issues represented by widening credit spreads. An internal credit rating is then estimated based on this data for each individual pricing source. Any significant changes in credit quality are immediately passed along and used to discontinue/suspend trading relationships (This process has caused us to stop trading with multiple banks in the past and was later used to reinstate those same banks). All FX/derivative counterparties currently used by Dimensional are represented on this list.
• For accounts with a true minimum ratings requirement, a daily check is run in order to look for changes in the stated ratings (not the implied ratings) to determine eligible counterparties
Overall, Dimensional have a thorough process in place to manage a change in key party and we believe that this process mitigates any risk as a key party is introduced to Dimensional funds.
Conclusion
Dimensional’s approach to undertaking due diligence on counter parties is thorough. This is not limited to the initial DD, and due diligence on counterparties is an ongoing process. Overall exposure to any single counterparty is capped, significantly limiting single counterparty risk.
We remain satisfied that DFA are taking thorough measures to ensure that the funds will be managed appropriately, minimising risks for all parties.
Given all the above, the CIC assesses that the funds have passed this enhanced due diligence flag in relation to the engagement of BNP Paribas as an FX Hedge Counterparty
December 2022
Disclaimer: The material contained in or attached to this report has been prepared based upon information that Consilium NZ Limited believes to be reliable but may be subject to typographical or other errors. Consilium has taken every care in preparing this information, which is for client education purposes only. Although the data has been sourced from publicly available information and/or provided by the investment managers, we are not able to guarantee its accuracy. Past performance, whether actual or simulated, is no guarantee of future performance. This document does not disclose all the risks of any transaction type described herein, and the recipient should understand any terms including relevant risk factors and any legal, tax and accounting considerations applicable to them.
One or more of the author(s) of this report invest in the analysed security. The author(s) do not know of the existence of any conflicts of interest that might bias the content or publication of this report. Compensation of the author(s) of this report is not based on any outcome of this report.
The likely effect of a company’s Environmental, Social and Governance (ESG) characteristics on its investment returns is the subject of considerable debate.
For instance, Dillian (2020, p.1) suggests that “ESG investing looks just like another stock bubble”, while Kynge (2017, p.2) states, “The outperformance of ESG strategies is beyond doubt”.
They can’t both be right.
Unfortunately, like the seemingly endless ‘passive versus active’ debate, there are entrenched views on both sides.
Investment theory implies that shares are priced according to their risk and return characteristics as well as investors’ preferences for these characteristics.
1. there was certainty regarding the extent to which good ESG improves company value (or bad ESG harms company value), and
2. the market was perfectly efficient at reflecting this information, and
3. investor views about the impact of ESG on company value did not change, then Company returns should not vary based on their ESG characteristics.
Rather, the price of good ESG companies would instantly rise and the price of bad ESG companies would instantly fall such that company ESG performance would be correctly reflected in the current share price and have no impact on its future price.
Proponents of the theory of completely efficient markets would assert there is no relation between company ESG and investment returns.
Under this scenario, investors would be worse off, in terms of risk-adjusted returns, by incorporating ESG criteria into their portfolios as ESG acts as a constraint on the optimal portfolio, but with no incremental benefit.
However, in the real world it seems that –
1. the exact impact of ESG on company value is not perfectly known,
2. there is evidence that investors do not always instantly incorporate known value-relevant information into price (e.g. Cohen and Frazinni, 2008), and
3. views towards ESG change through time
Therefore, forming an expectation regarding the returns of companies with different approaches to ESG becomes an exercise in estimating the extent to which ESG exposure is reflected in current prices, and anticipated changes in this level of compensation in the future.
Pedersen, Fitzgibbons, and Pomorski (2021) suggest that investors can be classified into three categories - ESG unaware, ESG aware, and ESG motivated.
The first group is unaware of ESG information.
The second group is aware of ESG scores and incorporates this information into their expectations of company risk and return.
The third group has a preference for companies with high ESG scores beyond the implications of these on risk and return.
This work, together with that of Pastor, Stambaugh, and Taylor (2021), has important implications for the long run relationship between ESG characteristics and a company’s share returns.
If investors are ESG unaware or if they under-price the benefits of positive ESG and the costs of negative ESG, then positive ESG companies will be under-priced and negative ESG companies will be over-priced.
Under this scenario, the realisation of the impact of ESG on share prices will lead to the prices of positive ESG companies increasing more than expected and the prices of negative ESG companies decreasing more than expected. This implies that there are risk-adjusted returns or “alpha” on offer for investing based on ESG. However, if investors are aware of the benefits to companies of positive ESG and the risks of negative ESG, they can be expected to pay more for positive ESG companies (and less for negative ESG companies) than they would for equivalent firms.
This implies that negative ESG companies will have higher expected returns as investors require additional compensation for the risk of holding them, while positive ESG companies will have lower expected returns.
The relationship documented for ESG aware investors is in the same direction but even stronger for ESG motivated investors.
As authors such as Hong and Kacperczyk (2009) point out, if investors prefer to avoid certain companies (such as those with poor ESG characteristics) for reasons other than their risk and return characteristics, the prices of these shares will be lower, and the expected returns will be higher.
If ESG preferences are strong enough, there will be risk-adjusted returns on offer for investors willing to invest in bad ESG companies, against the prevailing view of most investors.
While the studies discussed so far have focused on share prices, the same line of reasoning applies equally to bonds. If investors are ESG unaware or underreact to issuer ESG characteristics, the yields of positive ESG companies will be too high and the yields of negative ESG companies will be too low.
However, with ESG aware investors and/or ESG motivated investors, the yields of negative ESG companies will be higher than those of their positive ESG company counterparts. This risk premium is required to entice investors to invest in them.
Based on the above, the long run pricing of, and returns from, ESG companies will depend on whether ESG unaware, ESG aware, or ESG motivated investors are the predominant investor type.
It seems reasonable to assume that the predominant investor type will increasingly comprise at least ESG aware, if not ESG motivated, investors and, as noted, these can both be expected to lead to the same long run relationship between ESG and share returns.
According to the Global Sustainable Investment Review, by the beginning of 2020 the amount of assets allocated to global sustainable investment strategies had reached $US 35.3 trillion or 36% of total assets under management (AUM). This dollar amount had increased 55% in just a four year period and the surge in demand for sustainable strategies can be seen everywhere.
Bauer, Ruof, and Smeets (2021) surveyed members of a pension fund that gives its members a vote on sustainable investment policy. They found that most survey respondents preferred their pension money to be invested sustainability, even if this resulted in lower returns.
This finding is consistent with Riedl and Smeets (2017), who find that socially responsible investors expect to earn lower returns and pay higher management fees.
Companies have also responded to the ESG concerns of investors. Chang, Chu, Tu, Zhang, and Zhou (2021) note that as of July 2020, 90% of the S&P 500 companies now publish annual ESG reports, a significant increase from a decade earlier.
Taken together, this all suggests that in the long run there will be an equilibrium where negative ESG companies have lower current prices and higher expected returns to compensate investors for the risks incurred in holding them.
Furthermore, positive ESG companies will have higher current prices and lower expected returns due to a segment of society investing in them for social rather than financial reasons.
While this long run equilibrium relationship appears relatively clear, there is more debate about the short run relationship.
If the repricing of companies based on ESG characteristics has already fully occurred then the long run relationship can also be expected to be the short run relationship.
As Pastor, Stambaugh, and Taylor (2021) note, if share repricing based on ESG is still underway then negative ESG companies can be expected to have lower returns as investors sell them and their prices decline, while positive ESG companies are expected to have higher returns as investors purchase them and their prices increase.
The evidence of a large proportion of global AUM now being invested based on ESG metrics suggests that a substantial amount of repricing has already occurred. However, the actual impact of ESG characteristics on share returns is ultimately an empirical question.
A company’s value is a function of its expected future cash flows and its cost of capital. It therefore follows that ESG needs to impact either or both if it is to influence firm value.
There is growing evidence that firm ESG does influence cash flows. For instance, Fombrun, Gardberg, and Barnett (2000) suggest that ESG helps enhance firm reputation and allows it to charge premium prices for its products.
On balance, theory suggests that the existence of strong investor preferences favouring positive ESG companies and avoiding negative ESG companies would imply that shares with unfavourable ESG characteristics should have higher expected returns to attract investors.
There is some important early work that provides evidence of this. Hong and Kacperczyk (2009) considered companies involved in the production of alcohol, gaming, and tobacco or what they referred to as “sin stocks”. They found that these companies were less owned by pension funds and were also less followed by analysts, which would naturally follow from less institutional demand for information about these companies. They found that sin stocks outperform other companies from a returns perspective, even after controlling for known risk factors.
However, the evidence is not universally consistent with positive ESG companies underperforming their negative ESG counterparts. Edmans (2011) shows that a value-weighted portfolio of the “100 Best Companies to Work for in America” generated an alpha of 3.5% p.a. after controlling for the market, size, value, and momentum factors. The outperformance persisted even when comparing with firms in the same industry. These results suggest that employee satisfaction is correlated to share returns.
However, the observation that ESG can enhance value in a firm does not necessarily imply that investors will receive superior returns from investing in that firm. As noted earlier, investment returns are influenced by the degree to which ESG benefits are already factored into current share prices.
It also implies the market doesn’t fully and accurately value these intangible factors because, if it did, prices would adjust immediately, and future return outperformance would not persist.
More recently, In, Park, and Monk (2019) considered the relationship between CO2 emissions and US share returns over the 2005–2015 period. Their results indicate that a portfolio that takes a long position in the most CO2-efficient firms and a short position in the least CO2-efficient firms earns abnormal returns of 3.5–5.4% per year. This result is consistent with investors earning superior returns by investing in positive ESG companies with low CO2 emissions. This is also consistent with the Edmans (2011) finding that alpha can be earned by investing in positive ESG companies. However, the weight of evidence supports the position that larger returns are generated from investing in companies that emit more CO2 and have lower ESG ratings.
For instance, Bolton and Kacperczyk (2021a) find there is evidence that the prices of US companies that are high CO2 emitters have been marked down in recent periods such that these companies generate higher returns to compensate investors for the risks involved in holding them.
While investors did not include CO2 emissions in share pricing back in the 1990s, they do now.
While there has been an increasing investor focus on ESG investing in recent years, there is not currently a weight of evidence to suggest better investment returns should be expected. Different studies find evidence of outperformance, underperformance, and no difference in performance, of ESG mutual funds and ETFs depending on the sample and period considered.
Whether ESG investing is “just like another stock bubble” or “the outperformance of ESG strategies is beyond doubt” remains open to interpretation.
To date, the mainstream studies into ESG risk premia and expected returns, include findings supporting both sides of this debate. However, as ESG investing continues to move from infancy to adulthood, the weight of this evidence might settle more clearly on one side.
Considering the current evidence in aggregate, we find it difficult, from a theoretical perspective, to support the view that companies with positive ESG characteristics will continue to outperform other companies over the long run.
However, this does not imply these companies should not be invested in. There is growing evidence that a greater ESG focus can improve company value even if that may not equate to superior returns to investors.
For example, Climent and Soriano (2011) showed that ‘green’ mutual funds underperformed ‘non-green’ funds in the 1987–2009 period, but there was no difference in performance the 2001–2009 period.
As ESG returns data continues to grow, we expect a clearer signal to emerge. But for now at least, the jury is still out.
Many investors are already in agreement that seeking to maximise investment returns is only one potential goal amongst many and, for some, not the most important one.
In a world grappling with global warming, beset with scarcity issues, and awash with geopolitical and other tensions, businesses that embody greater consideration of stakeholders, society and the environment are to be celebrated.
And, regardless of the investment thesis behind it, many investors are currently doing just that.
Where’s the evidence...? is a series of articles produced by the Consilium Investment Team that draws on a regular review of current academic literature provided by Professor Ben Marshall, Consilium’s Independent Academic Consultant.
www.consilium.co.nz
support@consilium.co.nz
+64 3 353 1007

Introduction
Asness, Frazinni, Israel, and Moskowitz (2014) suggest that “anything that deviates from the market portfolio, which weights assets in proportion to their market values is, by definition, active”.
In that context, a portfolio that deviates from market weights must be balanced by other investors that are willing to take the other side of those active bets.
This definition is intuitive and well accepted. However, while the definition of passive investing is easily understandable as a consistent approach to capturing the performance of a defined market index, there is a spectrum of what can be considered active investing.
Active investing is not limited to a single, uniform approach or to only one investment structure.
For many investors, active investing involves stock picking based on information such as a pending new product announcement or involvement in an industry that is perceived to have desirable attributes. This approach often also involves frequent buying and selling.
For the purposes of this paper, we’ll call this “ad hoc active investing”.
Under the standard definition of active investing (Asness, et al), it follows that factor investing is also “active”. However, factor investing is very different to ad hoc active investing.
With factor investing, shares are purchased based on a measurable unbiased characteristic (e.g. a book-to-market ratio) irrespective of the news flow around the company. In this sense, there is a similarity to passive investing where shares are purchased in relation to their size relative to other companies.
Therefore, factor investing could be characterised as “systematic active investing”.
Factor investing does not mean buying and holding a share forever. If value investing was being followed and a company’s book-to-market ratio declined materially, the company would be sold. Again, this is similar to what occurs in passive investing. A company that has a material decline in market capitalisation and receives a lower index weight may be sold by funds tracking the index.
Not all ETFs are passive investments; in fact some are very active. Of course, any ETF that follows an index other than the market index is technically active, but we are talking about a degree of activeness above and beyond this. This additional activeness can take several forms.
Firstly, the ETF may offer returns that are similar to the index in form but different in substance. Cheng, Massa, and Zhang (2019) documented that ETFs often engage in ‘synthetic replication’ of an index.
This involves investing in a portfolio of shares and entering a swap arrangement with a financial institution where the returns from this portfolio are “swapped” with the returns on the index. The ETF investors achieve the index return (adjusted for a small tracking error) less a fee, and the ETF provider receives some benefit from any outperformance of the portfolio of shares held. The issue here is that investors are exposed to a new risk - default risk on the part of the swap counterparty.
Secondly, as noted by Easley, Michayluk, O’Hara, and Putnins (2021), ETFs may intentionally invest in a manner that involves taking active positions based on factors or ad hoc active investing approaches.
Although managed funds can offer passive or active investment options, the vast majority of funds market themselves as ad hoc active investors. Interestingly, in spite of that positioning, many of these funds may actually be quite near to their passive competitors. Cremers, Ferreira, Matos, and Starks (2016) found that approximately 20% of worldwide managed fund assets are owned by ‘closet’ indexers. They also found that when there were more low-cost explicitly indexed funds to provide competition, actively managed funds charged lower fees and were more active.
Most funds that implement an ad hoc active investment approach will generally look to engage in market timing (across regions, industries or individual companies). In-house fund analysts compare their own valuations and forecasts with current market pricing, with significant differences often acting as a catalyst for the fund’s buy or sell decisions.
The degree of activeness of a fund or strategy is often measured using the concept of “Active Share”, developed by Cremers and Petajisto (2009).
They proposed a formula which calculates the cumulative differences between the weights of a portfolio of securities and the weights of these securities in the corresponding benchmark. The Active Share of the portfolio is 0 if the portfolio holdings are identical to the market benchmark and 1 if the portfolio holds only non-benchmark securities.
If Active Share is calculated using the market index as the benchmark, it captures the commonly accepted definition of activeness. However, Active Share can also be calculated versus a non-market index benchmark, such as a small company index. In this case it would be understating the activeness versus the market as it is not capturing the fact that the small company index itself has an active component.
In ‘The Arithmetic of Active Management’ (1991, p7), William Sharpe stated that –
“It must be the case that:
1. before costs, the return on the average actively managed dollar will equal the return on the average passively managed dollar, and
2. after costs, the return on the average actively managed dollar will be less than the return on the average passively managed dollar
These assertions will hold for any time period. Moreover, they depend only on the laws of addition, subtraction, multiplication and division. Nothing else is required.”
This observation is a useful way of making the point that active investors who “win” generally require there to be other active investors who “lose”. However, there are some nuances to this argument.
Sharpe’s (1991) observation was dependent on an assumption highlighted in his footnote four:
“We assume here that passive managers purchase their securities before the beginning of the period in question and do not sell them until after the period ends. When passive managers do buy or sell, they may have to trade with active managers. At such times, the active managers may gain from the passive managers, because of the active managers’ willingness to provide desired liquidity (at a price).”
Pedersen (2018) points out that, in reality, this assumption is violated in a nontrivial way. New companies are added to market indices, others are removed, and companies issue more shares and engage in buy backs. Each of these events creates an opportunity for active management to add value. While this reasoning does not imply that active management will add value (empirical tests are required to address that question), it refutes the suggestion that it cannot add value. It should also be noted that not all passive managers neglect the opportunities presented in respect of index rebalancing, share issuances and buybacks. Some passive managers utilise these events to generate performance above the index through efficient trading.
Berk and van Binsbergen (2015) also highlighted the point made by Pedersen (2018) about passive investors providing opportunities for active investors to add value in aggregate. They noted the observations that many make about active managed funds competing solely against each other are too simplistic. In reality, there are also large numbers of active individual investors in the marketplace. These individual investors display numerous behavioural biases so it may be possible that active managed funds could add value from trading against these active individual investors.
Eugene Fama (1970) proposed that security markets are fully efficient, but this leads to two paradoxes.
As Grossman and Stiglitz (1980) point out, in a perfectly efficient market, no one has the incentive to collect information on which to trade, which raises the question of how markets become efficient.
Furthermore, if markets are fully efficient, then the fees paid to active managers represent an inefficiency in the market for asset management (discussed by Garleanu and Pedersen, 2018).
Even if markets are only partially efficient there is still a paradox. The evidence suggests that markets reflect available information to varying degrees and varying speeds, which implies that either all investors are partially rational or there are enough fully rational investors to move markets towards efficient pricing.
Either way, it is difficult to reconcile the widespread investment in active managed funds and partially rational investors with a situation of all active managed funds consistently destroying value.
Rather, it seems there must be a credible reason for partially rational individuals investing in active managed funds. There are several possibilities:
a) All active managed funds consistently add value
b) Some active managed funds consistently add value
c) All or some active managed funds add a lot of value in certain time periods
d) Investors reach a credible view on value creation that miss certain nuances that, if known, would change their perspective
In short, there is no evidence that active managed funds consistently add value. Some funds have delivered extended periods of observed outperformance, but there is debate regarding whether this has more to do with chance than reliable manager skill. With thousands of global funds attempting to outperform the market, the law of large numbers dictates that a few of this group will repeatedly ‘win’, even if purely by chance.
It seems most likely that c) and/or d) are the explanations.
Many active funds add value in different periods and, from a behavioural perspective, there is considerable investor focus on these periods. This could create the impression of more outperformance than there actually is.
Allied to this, Pastor, Stambaugh, and Taylor (2015) found that active fund performance typically declines over a fund’s lifetime. This may go some way to explaining the widespread notion among investors that active management adds value. If they have invested in an active mutual fund that has performed well initially, it is possible that they will remain focused on this early success during subsequent years of underperformance. Whilst global investor flows into passive investment vehicles have increased substantially over the last two decades, the majority of assets held by individual investors still remain in active managed funds. Many may continue to be attracted to the idea that active managed funds offered by professional money management firms, offer the best opportunity to “beat the market.”
This perception is relentlessly argued by the aggregate marketing efforts of the large (and vocal) active funds management industry. It is not, however, well supported by the weight of evidence, nor by the simple mathematical logic outlined in Sharpe’s 1991 paper.
Due to the size of this topic, part two of this ‘Active versus passive’ analysis (to be released next quarter) will focus on performance measurement, benchmarking and returns analysis.
Where’s the evidence...? is a series of articles produced by the Consilium Investment Team that draws on a regular review of current academic literature provided by Professor Ben Marshall, Consilium’s Independent Academic Consultant.
www.consilium.co.nz
support@consilium.co.nz
+64 3 353 1007


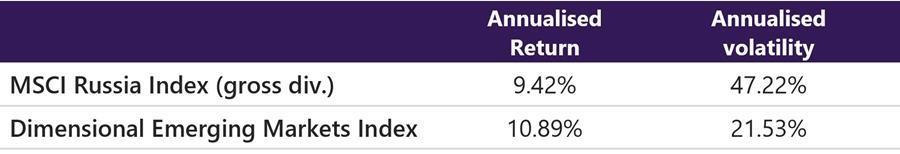

However, the Russian invasion has led fund managers to quickly review their investment approach. Below we summarise each manager's response to this unfolding situation. Bear in mind, this is still a very fluid situation, and we expect each approach to be subject to further change, as more information emerges.
Will divest Russian exposures as soon as materially possible
Will divest Russian exposures as soon as materially possible
Vanguard is still deliberating but the CIC will divest from this fund in our next SAA implementation
AMP is still deliberating but with MSCI removing Russia from its broad indices, it is now very likely that AMP will be divesting from, or writing off, their Russian exposures
For a more detailed overview of the individual fund strategies, along with a snapshot of the relevant communications received from fund managers regarding how their treatment of Russian investment exposures is likely to change, please refer to the articles on the portal.


KiwiSaver:
• ThepeergroupcomprisesKiwiSaverfundsrepresentingatotalofNZD94.2billionassetsundermanagement(asof30Nov 2022).

• FundswithNZD50millionoroverrepresent97%oftheoverallKiwiSavermarket.
• TheweightedaverageassetallocationacrossallKiwiSaverrisklevelsis59%growthassetsto41%incomeassets(amaterial increase fromthe51%growthto41%incomeassetslastyear).
• TheweightedaveragecashholdingwithinKiwiSaverremainsveryhighat9.1%(adecreasesincelastyear).
1 year performance:
• Overthe12monthstotheendofSeptember,wesawportfolios40/60andaboveoutperformtheriskadjustedpeergroup
• New Zealandequitieswerethesecondworstperformingequityassetclass.Ourmoreaggressiveportfolioswereboostedby our relativeunderweightingandourstrategywithintheassetclass(iethesmallcaptilt)contributedpositivelytoallportfolios.
• Australian equitieswerethebestperformingequityassetclass.Hereourportfolioswererelativelyoverweight,andthis, combined withpositiveriskpremiawithintheassetclass,ledtooutperformanceinallportfolios.
• International equitiesoutperformedthepeergroupaveragereturn.The relativeoverweight'sinouraggressiveportfolioswere a positivefactor,andourfundselectionexperiencedpositiveriskpremiaforallportfolioswhichledtorelativeoutperformance.
• Azeroallocationtodirectproperty assetclasseswaspositivedomestically,whileinternationallypropertyallocationwasnegative.
• International fixedinterestwaspredominatelyanunderperforming assetclassrelativetothepeergroupaverage.Ourfund selection strategywithintheassetclasswastheprimarynegativecontributoracrosstheportfoliosuite.

• Arelativeunderweightincash wasalsoanegative,withpeersbeingboostedbytheirmoresizablecashholdings.
Longer periods
• Portfolioreturnsarebroadlyinlinewiththepeergroupaverageover5and10years.
• New Zealandequityallocationsoverthelongtermhaveagainbeenslightlyunderweightinouraggressiveportfolios. This positioninghasgeneratedsomeslightnegativeperformancewithdomesticequitiesenjoyingastrongdecade.
• Australian equityallocationsweresimilartothepeergroupaverage overthelongtermandthushavebeenimmaterialtothe relative performanceoftheportfoliosuite.
• International equityfundselectionstrategyhasbeenadetractortorelativeperformance,attributabletothenegativeriskpremia (ie thevaluetilt)largelyexperiencedoverthepastdecade.
• Directproperty assetclasspositioninghasnotbeenamaterialcontributortoperformanceoverthelongerterm.
• International fixedinteresthasrecentlyexperiencedsignificantyieldcurveexpansion,reversingthebenefitofthepreviouslong-term trendsentirely.Here,comparativelyoverweightpositionsoverthelongtermhavedetractedfromourrelativeperformance.
• Again,therelativelyunderweightpositioningtowardcash wasanegativeattribute,withpeersbenefitingfromtheirsizablecash drag.
Notes and assumpt ons: Peergroupdefinedasportfolioallocationgrowthasset+/-10%,withminimumassetsunder managementofNZD50million. Peerallocationistheassetweightedaverageacrosstheentirepeergroup,asatreportdate. Peerassetclassreturnsareassumed,inaggregate,toequaltotheindexreturn. PeergroupdatasourceisKiwiSaverfundsonMorningstar. KiwiSaverfundsassetallocationsareasat30/09/2022. OnlyfundswithatleastNZD50millioninassetsundermanagementasatreportdateare includedinpeergroup.


Peersmusthaveexistedforacompleteanalysisperiodtobeincludedinthepeer group averagereturncalculation. Growthassetsrefertoinvestmentsinequitiesandproperty. AllreturnsareinNewZealanddollars. Allreturnsarenetofunderlyingmanagementfees,butgrossofcustodialand adviser monitoringfeesandtax. Returnsareannualisedfortimeperiodsgreaterthanoneyear. Pastreturnsdonotguaranteefutureperformance. Allinvestmentsshouldbemadewithconsiderationoftheinvestor’sunderlyingcircumstances


Notes and assumptions: PeergroupdatasourceisKiwiSaverfundsonMorningstar.Peergroupdefinedasportfolioallocationgrowthasset+/-10%withminimumassetsundermanagementofNZD50million.Peer allocation istheassetweightedaverageacrosstheentirepeergroup.Peersassetclassreturnsisassumedtobe,inaggregate,equaltotheindexreturn.Assetallocationsareasatreportdate.OnlyfundswithatleastNZD50million in assetsundermanagementasatreportdateareincludedinpeergroup.Growthassetsrefertoinvestmentsinequitiesandproperty.AllreturnsareinNewZealanddollars,andarenetofunderlyingmanagementfees, but grossofcustodialandadvisermonitoringfeesandtax.Fundsmusthaveexistedforcompleteanalysisperiodtobeincludedinpeergroupaveragereturncalculation.Pastreturnsdonotguaranteefutureperformance. All investmentsshouldbemadewithconsiderationoftheinvestor’sunderlyingcircumstances.


Notes and assumptions: PeergroupdatasourceisKiwiSaverfundsonMorningstar.Peergroupdefinedasportfolioallocationgrowthasset+/-10%withminimumassetsundermanagementofNZD50million.Peer allocation istheassetweightedaverageacrosstheentirepeergroup.Peersassetclassreturnsisassumedtobe,inaggregate,equaltotheindexreturn.Assetallocationsareasatreportdate.OnlyfundswithatleastNZD50million in assetsundermanagementasatreportdateareincludedinpeergroup.Growthassetsrefertoinvestmentsinequitiesandproperty.AllreturnsareinNewZealanddollars,andarenetofunderlyingmanagementfees, but grossofcustodialandadvisermonitoringfeesandtax.Fundsmusthaveexistedforcompleteanalysisperiodtobeincludedinpeergroupaveragereturncalculation.Pastreturnsdonotguaranteefutureperformance. All investmentsshouldbemadewithconsiderationoftheinvestor’sunderlyingcircumstances.


Notes and assumptions: PeergroupdatasourceisKiwiSaverfundsonMorningstar.Peergroupdefinedasportfolioallocationgrowthasset+/-10%withminimumassetsundermanagementofNZD50million.Peer allocation istheassetweightedaverageacrosstheentirepeergroup.Peersassetclassreturnsisassumedtobe,inaggregate,equaltotheindexreturn.Assetallocationsareasatreportdate.OnlyfundswithatleastNZD50million in assetsundermanagementasatreportdateareincludedinpeergroup.Growthassetsrefertoinvestmentsinequitiesandproperty.AllreturnsareinNewZealanddollars,andarenetofunderlyingmanagementfees, but grossofcustodialandadvisermonitoringfeesandtax.Fundsmusthaveexistedforcompleteanalysisperiodtobeincludedinpeergroupaveragereturncalculation.Pastreturnsdonotguaranteefutureperformance. All investmentsshouldbemadewithconsiderationoftheinvestor’sunderlyingcircumstances.


Notes and assumptions: PeergroupdatasourceisKiwiSaverfundsonMorningstar.Peergroupdefinedasportfolioallocationgrowthasset+/-10%withminimumassetsundermanagementofNZD50million.Peer allocation istheassetweightedaverageacrosstheentirepeergroup.Peersassetclassreturnsisassumedtobe,inaggregate,equaltotheindexreturn.Assetallocationsareasatreportdate.OnlyfundswithatleastNZD50million in assetsundermanagementasatreportdateareincludedinpeergroup.Growthassetsrefertoinvestmentsinequitiesandproperty.AllreturnsareinNewZealanddollars,andarenetofunderlyingmanagementfees, but grossofcustodialandadvisermonitoringfeesandtax.Fundsmusthaveexistedforcompleteanalysisperiodtobeincludedinpeergroupaveragereturncalculation.Pastreturnsdonotguaranteefutureperformance. All investmentsshouldbemadewithconsiderationoftheinvestor’sunderlyingcircumstances.


Notes and assumptions: PeergroupdatasourceisKiwiSaverfundsonMorningstar.Peergroupdefinedasportfolioallocationgrowthasset+/-10%withminimumassetsundermanagementofNZD50million.Peer allocation istheassetweightedaverageacrosstheentirepeergroup.Peersassetclassreturnsisassumedtobe,inaggregate,equaltotheindexreturn.Assetallocationsareasatreportdate.OnlyfundswithatleastNZD50million in assetsundermanagementasatreportdateareincludedinpeergroup.Growthassetsrefertoinvestmentsinequitiesandproperty.AllreturnsareinNewZealanddollars,andarenetofunderlyingmanagementfees, but grossofcustodialandadvisermonitoringfeesandtax.Fundsmusthaveexistedforcompleteanalysisperiodtobeincludedinpeergroupaveragereturncalculation.Pastreturnsdonotguaranteefutureperformance. All investmentsshouldbemadewithconsiderationoftheinvestor’sunderlyingcircumstances.


Notes and assumptions: PeergroupdatasourceisKiwiSaverfundsonMorningstar.Peergroupdefinedasportfolioallocationgrowthasset+/-10%withminimumassetsundermanagementofNZD50million.Peer allocation istheassetweightedaverageacrosstheentirepeergroup.Peersassetclassreturnsisassumedtobe,inaggregate,equaltotheindexreturn.Assetallocationsareasatreportdate.OnlyfundswithatleastNZD50million in assetsundermanagementasatreportdateareincludedinpeergroup.Growthassetsrefertoinvestmentsinequitiesandproperty.AllreturnsareinNewZealanddollars,andarenetofunderlyingmanagementfees, but grossofcustodialandadvisermonitoringfeesandtax.Fundsmusthaveexistedforcompleteanalysisperiodtobeincludedinpeergroupaveragereturncalculation.Pastreturnsdonotguaranteefutureperformance. All investmentsshouldbemadewithconsiderationoftheinvestor’sunderlyingcircumstances.


Notes and assumptions: PeergroupdatasourceisKiwiSaverfundsonMorningstar.Peergroupdefinedasportfolioallocationgrowthasset+/-10%withminimumassetsundermanagementofNZD50million.Peer allocation istheassetweightedaverageacrosstheentirepeergroup.Peersassetclassreturnsisassumedtobe,inaggregate,equaltotheindexreturn.Assetallocationsareasatreportdate.OnlyfundswithatleastNZD50million in assetsundermanagementasatreportdateareincludedinpeergroup.Growthassetsrefertoinvestmentsinequitiesandproperty.AllreturnsareinNewZealanddollars,andarenetofunderlyingmanagementfees, but grossofcustodialandadvisermonitoringfeesandtax.Fundsmusthaveexistedforcompleteanalysisperiodtobeincludedinpeergroupaveragereturncalculation.Pastreturnsdonotguaranteefutureperformance. All investmentsshouldbemadewithconsiderationoftheinvestor’sunderlyingcircumstances.


Notes and assumptions: PeergroupdatasourceisKiwiSaverfundsonMorningstar.Peergroupdefinedasportfolioallocationgrowthasset+/-10%withminimumassetsundermanagementofNZD50million.Peer allocation istheassetweightedaverageacrosstheentirepeergroup.Peersassetclassreturnsisassumedtobe,inaggregate,equaltotheindexreturn.Assetallocationsareasatreportdate.OnlyfundswithatleastNZD50million in assetsundermanagementasatreportdateareincludedinpeergroup.Growthassetsrefertoinvestmentsinequitiesandproperty.AllreturnsareinNewZealanddollars,andarenetofunderlyingmanagementfees, but grossofcustodialandadvisermonitoringfeesandtax.Fundsmusthaveexistedforcompleteanalysisperiodtobeincludedinpeergroupaveragereturncalculation.Pastreturnsdonotguaranteefutureperformance. All investmentsshouldbemadewithconsiderationoftheinvestor’sunderlyingcircumstances.


Notes and assumptions: PeergroupdatasourceisKiwiSaverfundsonMorningstar.Peergroupdefinedasportfolioallocationgrowthasset+/-10%withminimumassetsundermanagementofNZD50million.Peer allocation istheassetweightedaverageacrosstheentirepeergroup.Peersassetclassreturnsisassumedtobe,inaggregate,equaltotheindexreturn.Assetallocationsareasatreportdate.OnlyfundswithatleastNZD50million in assetsundermanagementasatreportdateareincludedinpeergroup.Growthassetsrefertoinvestmentsinequitiesandproperty.AllreturnsareinNewZealanddollars,andarenetofunderlyingmanagementfees, but grossofcustodialandadvisermonitoringfeesandtax.Fundsmusthaveexistedforcompleteanalysisperiodtobeincludedinpeergroupaveragereturncalculation.Pastreturnsdonotguaranteefutureperformance. All investmentsshouldbemadewithconsiderationoftheinvestor’sunderlyingcircumstances.


KiwiSaver:
• ThepeergroupcomprisesKiwiSaverfundsrepresentingatotalofNZD94.2billionassetsundermanagement(asof30Nov 2022)
• FundswithNZD50millionoroverrepresent97%oftheoverallKiwiSavermarket
• TheweightedaverageassetallocationacrossallKiwiSaverrisklevelssitsat59%growthassetsto41%incomeassets(a material increasefromthe51%growthto41%incomeassetslastyear)
• TheweightedaveragecashholdingwithinKiwiSaverremainsveryhighat9.1%(adecreasesincelastyear)
1 year performance:
• Overthe12monthstotheendofSeptember,wesawportfolios60/40andaboveoutperformtheriskadjustedpeergroup averages.
• New Zealandequitieswerethesecondworstperformingequityassetclass.Allportfolioswerenegativelyimpactedbyour relatively overweightpositions,howeverthestrategy withintheassetclasswaspositiveacrossallportfolios.Overall,defensiveportfolios saw NZequityhinderperformance,whileourmoreaggressiveportfoliosbenefited.
• Australian equitieswerethebestperformingequityassetclass.Ouraggressiveportfoliosheldoverweightpositions,however the fundselectionunderperformedduetothesustainabilityoverlaywhichdiminishedthepositiveimpact.
• International equitiesoutperformedthepeergroupaveragereturn.Ourclosetoaverageweightsdidnotcontributetoa material outperformance,andduetotheunderlyingfundstrategy(inparticulartheSRIexclusions)allportfolioslaggedthepeergroup.
• Azeroallocationtodirectproperty assetclasseswaspositivedomestically.
• International fixedinterestwaspredominatelyanunderperforming assetclassrelativetothepeergroupaverage.Ourfund selection strategywithintheassetclasswastheprimarynegativecontributoracrosstheportfoliosuite.
• Arelativeunderweightincash wasalsoanegative,withpeersbeingboostedbytheirmoresizablecashholdings.
Longer periods
• Portfoliosoutperformedacrosstheboardover5and10years andhaveperformedbetterlong-termthanclassicportfolios.
• OverweightNew Zealandequityallocationshaveboostedperformanceoverthelongterm,spurredbyourfundselection strategy alongwiththestrongperformanceofdomesticequities
• Australian andinternationalequityfundselectionswerebothpositiveoverthelongterm,howevertherelatively underweight positioningtowardinternationalequitieshinderedalittle.
• International fixedinterestagainsawrelativeweightingandfundselectiondetractfromoverallperformancethroughthelong term. Overweightpositioningduringtherecentyieldcurveexpansionwastheprimarycontributortopoorperformance.
• Takingexposuretointernational fixedinterestinsteadofcash helpedalittle,butallocatingtoNew Zealandfixedinterestwould have beenbetter.
Notes and assumpt ons:
Peergroupdefinedasportfolioallocationgrowthasset+/-10%,withminimumassetsunder managementofNZD50million. Peerallocationistheassetweightedaverageacrosstheentirepeergroup,asatreportdate. Peerassetclassreturnsareassumed,inaggregate,toequaltotheindexreturn. PeergroupdatasourceisKiwiSaverfundsonMorningstar. KiwiSaverfundsassetallocationsareasat30/09/2022. OnlyfundswithatleastNZD50millioninassetsundermanagementasatreportdateare includedinpeergroup.


Peersmusthaveexistedforacompleteanalysisperiodtobeincludedinthepeer group averagereturncalculation. Growthassetsrefertoinvestmentsinequitiesandproperty. AllreturnsareinNewZealanddollars. Allreturnsarenetofunderlyingmanagementfees,butgrossofcustodialand adviser monitoringfeesandtax. Returnsareannualisedfortimeperiodsgreaterthanoneyear. Pastreturnsdonotguaranteefutureperformance. Allinvestmentsshouldbemadewithconsiderationoftheinvestor’sunderlyingcircumstances


Notes and assumptions: PeergroupdatasourceisKiwiSaverfundsonMorningstar.Peergroupdefinedasportfolioallocationgrowthasset+/-10%withminimumassetsundermanagementofNZD50million.Peer allocation istheassetweightedaverageacrosstheentirepeergroup.Peersassetclassreturnsisassumedtobe,inaggregate,equaltotheindexreturn.Assetallocationsareasatreportdate.OnlyfundswithatleastNZD50million in assetsundermanagementasatreportdateareincludedinpeergroup.Growthassetsrefertoinvestmentsinequitiesandproperty.AllreturnsareinNewZealanddollars,andarenetofunderlyingmanagementfees, but grossofcustodialandadvisermonitoringfeesandtax.Fundsmusthaveexistedforcompleteanalysisperiodtobeincludedinpeergroupaveragereturncalculation.Pastreturnsdonotguaranteefutureperformance. All investmentsshouldbemadewithconsiderationoftheinvestor’sunderlyingcircumstances.


Notes and assumptions: PeergroupdatasourceisKiwiSaverfundsonMorningstar.Peergroupdefinedasportfolioallocationgrowthasset+/-10%withminimumassetsundermanagementofNZD50million.Peer allocation istheassetweightedaverageacrosstheentirepeergroup.Peersassetclassreturnsisassumedtobe,inaggregate,equaltotheindexreturn.Assetallocationsareasatreportdate.OnlyfundswithatleastNZD50million in assetsundermanagementasatreportdateareincludedinpeergroup.Growthassetsrefertoinvestmentsinequitiesandproperty.AllreturnsareinNewZealanddollars,andarenetofunderlyingmanagementfees, but grossofcustodialandadvisermonitoringfeesandtax.Fundsmusthaveexistedforcompleteanalysisperiodtobeincludedinpeergroupaveragereturncalculation.Pastreturnsdonotguaranteefutureperformance. All investmentsshouldbemadewithconsiderationoftheinvestor’sunderlyingcircumstances.


Notes and assumptions: PeergroupdatasourceisKiwiSaverfundsonMorningstar.Peergroupdefinedasportfolioallocationgrowthasset+/-10%withminimumassetsundermanagementofNZD50million.Peer allocation istheassetweightedaverageacrosstheentirepeergroup.Peersassetclassreturnsisassumedtobe,inaggregate,equaltotheindexreturn.Assetallocationsareasatreportdate.OnlyfundswithatleastNZD50million in assetsundermanagementasatreportdateareincludedinpeergroup.Growthassetsrefertoinvestmentsinequitiesandproperty.AllreturnsareinNewZealanddollars,andarenetofunderlyingmanagementfees, but grossofcustodialandadvisermonitoringfeesandtax.Fundsmusthaveexistedforcompleteanalysisperiodtobeincludedinpeergroupaveragereturncalculation.Pastreturnsdonotguaranteefutureperformance. All investmentsshouldbemadewithconsiderationoftheinvestor’sunderlyingcircumstances.


Notes and assumptions: PeergroupdatasourceisKiwiSaverfundsonMorningstar.Peergroupdefinedasportfolioallocationgrowthasset+/-10%withminimumassetsundermanagementofNZD50million.Peer allocation istheassetweightedaverageacrosstheentirepeergroup.Peersassetclassreturnsisassumedtobe,inaggregate,equaltotheindexreturn.Assetallocationsareasatreportdate.OnlyfundswithatleastNZD50million in assetsundermanagementasatreportdateareincludedinpeergroup.Growthassetsrefertoinvestmentsinequitiesandproperty.AllreturnsareinNewZealanddollars,andarenetofunderlyingmanagementfees, but grossofcustodialandadvisermonitoringfeesandtax.Fundsmusthaveexistedforcompleteanalysisperiodtobeincludedinpeergroupaveragereturncalculation.Pastreturnsdonotguaranteefutureperformance. All investmentsshouldbemadewithconsiderationoftheinvestor’sunderlyingcircumstances.


Notes and assumptions: PeergroupdatasourceisKiwiSaverfundsonMorningstar.Peergroupdefinedasportfolioallocationgrowthasset+/-10%withminimumassetsundermanagementofNZD50million.Peer allocation istheassetweightedaverageacrosstheentirepeergroup.Peersassetclassreturnsisassumedtobe,inaggregate,equaltotheindexreturn.Assetallocationsareasatreportdate.OnlyfundswithatleastNZD50million in assetsundermanagementasatreportdateareincludedinpeergroup.Growthassetsrefertoinvestmentsinequitiesandproperty.AllreturnsareinNewZealanddollars,andarenetofunderlyingmanagementfees, but grossofcustodialandadvisermonitoringfeesandtax.Fundsmusthaveexistedforcompleteanalysisperiodtobeincludedinpeergroupaveragereturncalculation.Pastreturnsdonotguaranteefutureperformance. All investmentsshouldbemadewithconsiderationoftheinvestor’sunderlyingcircumstances.


Notes and assumptions: PeergroupdatasourceisKiwiSaverfundsonMorningstar.Peergroupdefinedasportfolioallocationgrowthasset+/-10%withminimumassetsundermanagementofNZD50million.Peer allocation istheassetweightedaverageacrosstheentirepeergroup.Peersassetclassreturnsisassumedtobe,inaggregate,equaltotheindexreturn.Assetallocationsareasatreportdate.OnlyfundswithatleastNZD50million in assetsundermanagementasatreportdateareincludedinpeergroup.Growthassetsrefertoinvestmentsinequitiesandproperty.AllreturnsareinNewZealanddollars,andarenetofunderlyingmanagementfees, but grossofcustodialandadvisermonitoringfeesandtax.Fundsmusthaveexistedforcompleteanalysisperiodtobeincludedinpeergroupaveragereturncalculation.Pastreturnsdonotguaranteefutureperformance. All investmentsshouldbemadewithconsiderationoftheinvestor’sunderlyingcircumstances.


Notes and assumptions: PeergroupdatasourceisKiwiSaverfundsonMorningstar.Peergroupdefinedasportfolioallocationgrowthasset+/-10%withminimumassetsundermanagementofNZD50million.Peer allocation istheassetweightedaverageacrosstheentirepeergroup.Peersassetclassreturnsisassumedtobe,inaggregate,equaltotheindexreturn.Assetallocationsareasatreportdate.OnlyfundswithatleastNZD50million in assetsundermanagementasatreportdateareincludedinpeergroup.Growthassetsrefertoinvestmentsinequitiesandproperty.AllreturnsareinNewZealanddollars,andarenetofunderlyingmanagementfees, but grossofcustodialandadvisermonitoringfeesandtax.Fundsmusthaveexistedforcompleteanalysisperiodtobeincludedinpeergroupaveragereturncalculation.Pastreturnsdonotguaranteefutureperformance. All investmentsshouldbemadewithconsiderationoftheinvestor’sunderlyingcircumstances.


Notes and assumptions: PeergroupdatasourceisKiwiSaverfundsonMorningstar.Peergroupdefinedasportfolioallocationgrowthasset+/-10%withminimumassetsundermanagementofNZD50million.Peer allocation istheassetweightedaverageacrosstheentirepeergroup.Peersassetclassreturnsisassumedtobe,inaggregate,equaltotheindexreturn.Assetallocationsareasatreportdate.OnlyfundswithatleastNZD50million in assetsundermanagementasatreportdateareincludedinpeergroup.Growthassetsrefertoinvestmentsinequitiesandproperty.AllreturnsareinNewZealanddollars,andarenetofunderlyingmanagementfees, but grossofcustodialandadvisermonitoringfeesandtax.Fundsmusthaveexistedforcompleteanalysisperiodtobeincludedinpeergroupaveragereturncalculation.Pastreturnsdonotguaranteefutureperformance. All investmentsshouldbemadewithconsiderationoftheinvestor’sunderlyingcircumstances.


Notes and assumptions: PeergroupdatasourceisKiwiSaverfundsonMorningstar.Peergroupdefinedasportfolioallocationgrowthasset+/-10%withminimumassetsundermanagementofNZD50million.Peer allocation istheassetweightedaverageacrosstheentirepeergroup.Peersassetclassreturnsisassumedtobe,inaggregate,equaltotheindexreturn.Assetallocationsareasatreportdate.OnlyfundswithatleastNZD50million in assetsundermanagementasatreportdateareincludedinpeergroup.Growthassetsrefertoinvestmentsinequitiesandproperty.AllreturnsareinNewZealanddollars,andarenetofunderlyingmanagementfees, but grossofcustodialandadvisermonitoringfeesandtax.Fundsmusthaveexistedforcompleteanalysisperiodtobeincludedinpeergroupaveragereturncalculation.Pastreturnsdonotguaranteefutureperformance. All investmentsshouldbemadewithconsiderationoftheinvestor’sunderlyingcircumstances.


Consilium NZ Limited
On at least a three yearly basis Consilium Investment Committee (CIC) undergoes an extensive qualitative review of all recommended investment managers. This review is in addition to the quarterly performance review and annual update of the Approved Products List.
The basis of this review is a request for information (see Appendix A) sent to all recommended investment managers.
In this document we will summarise the types of information requested and our methodology for reviewing the results. We will then review a summary of the answers for each investment manager and, at times, comment on their response. Finally, we will summarise our intended follow up.
The two criteria of fi360 Practice 4.2 call upon the fiduciary, first, to consider qualitative factors which may impact investment managers and advisers and, second, to act appropriately to the circumstances.
Organisations, even investment management firms, are organic and will evolve – some will evolve for the better, some for the worse. The evaluation of an investment manager is not limited to an examination of performance figures and modern portfolio theory statistics. It should also include an evaluation of whether the organisationis striving for sustainable excellence ordetracting from the foundationof trust-based fiduciary relationships.
It is the goal of fiduciary excellence that underpins this exercise.
The specific information requested is contained in Appendix A. Here, we summarise the categories. In column 1 we include the types of information collected. In column 2 we indicate what we are looking for in each category and how we will review results:
Information type The information we are looking for Ownership structure/major shareholders Have there been any changes to the organisational structure of the investment manager, including mergers or acquisitions?
Staff Has there been significant turnover in the professional or service staff of the investment company?
Adviser support services provided Does the investment manager provide the same or better level of service than is available in the marketplace for comparable fees?
Investment/fund managers
What is the tenure of the key investment managers running the fund?
Investment mandate Is the investment mandate firmly set so we can be confident that the risk of manager speculation and style drift is reduced?
Investment assets Are investment assets increasing and can we be confident that the manager continues to be a growing and viable business?
Performance
Best execution
How does performance compare vs median of peers, and is that explainable due to risk?
Are trading costs accounted and are procedures for best execution being followed?
Trade compliance Can the fund manager demonstrate adequate pre and post trade compliance processes?
Trading errors Are trading errors documented and are policies in place to avoid reoccurrence?
Liquidity Monitoring Can the manager outline adequate liquidity monitoring and stress testing processes?
Proxy voting Are proxy voting policies being executed in shareholders’ best interests?
Fees Can the manager easily increase the fee without adequate warning? What is the process for increasing fees?
Third Party Ratings
Reports
Requests for information
Investment education
What independent agencies (such as Morningstar, Lipper, adviser publications, etc) currently have a published rating on any of the funds identified in this questionnaire?
Do the reports contain all of the information that is necessary and useful to the responsible fiduciary? Are the reports consistently provided on a timely basis?
Does the investment manager consistently respond to requests for information by the fiduciary in a timely manner? Do the responses contain the information requested? Are the responses easily understood?
Does the investment manager provide adequate explanation of the investment decisions it makes and the factors it considers in making such decisions so that the fiduciary can understand and appropriately monitor such actions? Does the investment company provide support for investment education if this is an area where the responsible fiduciary is seeking support?
Insurance Does the firm have adequate insurance to cover its business activities?
Insolvency Are investors secure if the investment management firm were to become insolvent?
Independent verification
The firm is reviewed independently, and those ratings are generally favourable?
Regulatory reviews Can the manager submit details in respect of the findings of their most recent regulatory review?
Business continuity Can the manager provide evidence of a comprehensive BCP and when it was last enacted?
Below we summarise the results for each of the categories and our comments/indicated follow ups for each investment manager. Note that, in certain categories, our summaries go beyond the request for information and include our experience in interacting with each manager. As noted, the information is a summary of the due diligence response provided by each manager. Greater detail from Consilium is available upon request.
In this category we are looking for changes in ownership structure that may indicate a change in operating policy,culture and investment mandates. Secondly, we are looking to ensure the fund has the financial backing to withstand losses of investors and market downturns.
Harbour Harbour is currently 76% owned by its parent, Jarden Group Ltd (rebranded from First NZ Capital Group in Jun-19), and 24% owned by Harbour employees.
BlackRock BlackRock, Inc. (“BlackRock”) is the ultimate parent company for the proposed BlackRock contracting entity, BlackRock Investment Management (Australia) Limited (“BIMAL”). As at 31 December 2021, there was no person known by BlackRock to own beneficially 10% or more of any class of outstanding voting securities of BlackRock.
Harbour has had no significant organisational changes in either the past 12 months or three years.
In May 2020, Blackrock underwent a significant ownership change. Through a secondary offering commenced by Blackrock, PNC (a 22% shareholder) exited its full investment in Blackrock. Blackrock confirmed the change in ownership structure did not have an impact on the efficient management of the funds
Dimensional Established in 1994, DFA Australia Ltd is a wholly owned subsidiary of US based Dimensional Fund Advisors LP. The parent company is a U.S. limited partnership with the majority owners being company executives, current and former employees and directors, and their respective families.
Asset
Macquarie Group is an Australian publicly held company (ASX: MQG) and the ultimate parent company of the various licensed entities that Macquarie Asset Management Public Investment (MAM PI) operates under globally. Macquarie Asset Management Public Investments (NZ) Limited is a wholly owned subsidiary of MAMNZ and is the manager of the Macquarie Investment Funds
On 20 September 2022 it was announced that Mercer (N.Z.) Limited will take over as Manager of the Macquarie funds in New Zealand, subject to approval. Macquarie will be working closely with Mercer over coming months towards a seamless transition for clients, which is anticipated to be completed by the first quarter of 2023. Macquarie Asset Management (NZ) Limited intends to remain the Investment Manager and retain a local investment management presence in New Zealand, and there will be no immediate change for clients.
No notable change in the last 3 years
On 25th March 2022, MAM finalised its acquisition of AMP Capital’s Global Equity and Fixed Income business
Consilium is in regular contact with Macquarie in respect of any information relating to the progress of this merger.
Russell Investments' ownership is composed of a majority stake held by funds managed by TA Associates, with a significant minority stake held by funds managed by Reverence Capital Partners.
Russell Investments' employees, independent directors, and Hamilton Lane Advisors, LLC also hold minority, noncontrolling, ownership stakes.
Vanguard Vanguard Group of Investment Companies (VGI) is owned by Vanguard’s US-domiciled funds and ETFs. VGI has created various wholly owned subsidiaries to provide services to Vanguard shareholders, including Vanguard Investments Australia Ltd.
On March 30, 2021, Russell Investments and Hamilton Lane entered into a strategic partnership
Vanguard has had no significant organisational changes in either the past 12 months or three years.
In this category we are looking for significant turnover, especially in situations outside of organic growth, in the professional or service staff of the investment company
These percentages generally reflect good growth. The 12 month equity t/over number equates to one staff member in a team of nine, so is not a concern
BlackRock There are currently 19,887 employees at Blackrock, of this there are 2,816 Investment Professionals, 1,302 Portfolio Managers and 219 Traders.
Staff turnover below:
Dimensional As at 30 September 2022, the Global Group had 1,504 employees, 295 of whom were investment professionals. Dimensional Australia had 120 employees, 26 of whom were investment professionals.
Average of annual turnover rates from 2019-2021 is 13%.
Dimensional’s voluntary turnover rate has been on the lower end of
Staff turnover is very consistent and within expected levels.
While DFA does not provide department level turnover figures, their annual turnover figures are in line with peers
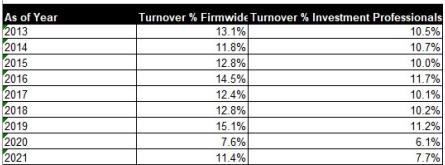
Macquarie Asset Management (MAM)
the industry with a three-year average (three years ended 31 December 2021) of 10.6%.
As of 30 June 2022, there were over 2,200 full-time equivalent (FTE) staff at Macquarie Asset Management operating across 33 countries. The New Zealand business currently consists of 27 FTE staff, broken down as follows:
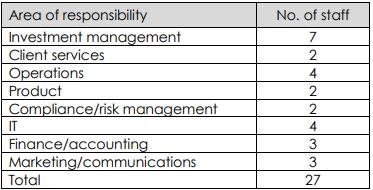
Russell Investment Funds
All the New Zealand team from AMP Capital Investors, apart from those in the direct property side of the business, transferred across to Macquarie Asset Management (NZ) Limited. This included the NZ Fixed Income team, relationship managers and client services team. In addition, we have hired three new people since completion.
As of 30 June 2022, Russell had 343 Investment Professionals which help make up 1,355 total Associates at the firm. Russell has noted that an Investment Professional is an associate who is involved in the investment process and may either implement or construct investment products and/or investment advisory solutions. Breakdown of personnel is as follows:
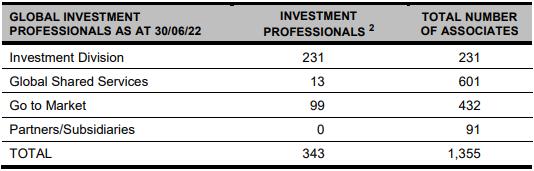
The further changes expected (i.e. the transition to Mercer (N.Z) Limited), is likely to lead to additional consolidation in the current Macquarie staff numbers. Up to twothirds of existing staff will possibly be made redundant. As a result, we do not consider it useful to analyse the historical turnover rates of Macquarie in great detail. We retain a watching brief on the developments with the current merger process.
Overall, we are comfortable with the Russell staff turnover figures, particularly in recent years.
Turnover:
Russell has noted that as an organisation they like to have a mix between associates with long firm tenure, and individuals who bring experience from different organisations and bright minds that are fresh to the labour market. To accommodate this, they are comfortable to have some turnover within the firm while also making sure that they retain the right talent.
Vanguard The staff breakdown of Vanguard Investments Australia (VIA) is as follows: Vanguard’s global turnover rate remains at the lower end of industry averages.
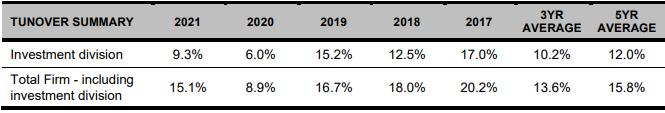
Please note this includes inbound expats (excludes outbound),and includes contractors while excluding other contingent workers.
Vanguard’s turnover rate of approximately 10.0% as of December 31, 2021, compares favourably with the financial services industry’s average of approximately 18.6% as reported by the Bureau of Labour and Statistics (November 2021).
On average, Vanguards turnover for their top talent - those receiving the highest performance-management rating - is less than 5.0% annually.
Follow up items – None
In this category we are looking for whether the investment manager provides the same or better level of service than is available in the marketplace for comparable fees.

Harbour Harbour is a specialist funds management company and provide ongoing support and information which includes:
• Meeting with key investment professionals for portfolio performance reviews as required
• Access to their extensive qualitative and quantitative research
• Access to their monthly and quarterly webinars hosted by fund managers
• Invitations to thought leadership roundtable events and seminars
Regular meetings in person or virtually Consilium has the opportunity to meet with key investment professionals for portfolio performance reviews regularly throughout the year, generally quarterly or as required.
Investment research available
Harbour is an active supplier of good content and services to advisers and Consilium
All investment decisions made by Harbour are driven by research. Portfolio managers and research analysts undertake extensive research using independent providers as well as proprietary data sources, visit companies or issuers, and compile quantitative research. They often publish notes on this research, which are available to Consilium.
Portfolio managers host monthly or quarterly webinars on their respective markets and the performance of Harbour’s funds which Consilium would be welcome to join. We also hold thought leadership roundtable events and seminars which Consilium is invited to. These generally involve a mix of Harbour analysts and external experts sharing their knowledge and research.
BlackRock BlackRock is a premier provider of global investment management services. As of 31 December 2021, we have been entrusted to manage $10.01 trillion across equity, fixed income, alternatives, multi-asset, and cash management strategies for our institutional and retail clients. We collectively support millions of people around the world by working alongside institutions and financial advisors as they contribute to the financial wellbeing of those who depend on them.
Dimensional In addition to on-site meetings, conference calls and specific client requests, Dimensional offers quantitative reporting as part of their client service package.
Dimensional also offers Dimensional 360, which can help financial advisors build a more successful wealth management business through education, coaching, and a full array of resources tailored to the financial advisor firm’s needs. This holistic platform offers a comprehensive view of where an advisor’s business can go and delivers expertise and resources to bring their vision to life. Dimensional 360 is available through a deep, experienced team of specialists who connect financial advisors to the people, insights, and tools that can help transform their businesses.
Dimensional’s support begins with investments. They show financial advisors how to get the most from leading research and use Dimensional strategies to enhance their investment offering. Beyond investments, Dimensional 360 extends across other essential functions of the financial advisor business communication and strategy to help advisors elevate the client experience and position their business for higher growth and success.
Dimensional delivers a full spectrum of services through multiple channels:
• Professional Consulting: One-on-one consultations with investment specialists and client support teams
• Client Communities: Professional study groups, executive forums, and specialty peer networks
• Events: Conferences, symposiums, and focused workshops featuring Dimensional thought leaders and industry experts
• Webcasts: Live and recorded events featuring expert analysis on markets, research, and industry topics
• Professional Training: Investment education, personal skills development, and business strategy
• MyDimensional.com: Website offering exclusive access to digital resources, tools, and content
Some of the highlights include:
• Managing Your Practice: A Dimensional Podcast Series This series delivers insights based on Dimensional’s history of industry-
BlackRock generally offer less adviser support services on a proactive basis, however they are amendable to direct requests for support or information for Consilium
Dimensional provides comprehensive support to advisers and bespoke regular support for Consilium
Macquarie Asset Management (MAM)
leading financial advisor benchmark studies and client surveys. We help advisors leverage those insights when making the critical business decisions successful firms face every day. This series is dedicated to providing financial professionals with best practices in key areas such as driving growth, business efficiency, and the client experience.
• Global Investor Study Through the Global Investor Study, advisors can gauge how clients perceive their firm and value offering and identify areas of opportunity and potential risk.
The MAM service suite has historically been broad and served advisers well. However, with the pending change to Mercer underway, it is not clear exactly what services can be expected in the future.
MAM has indicated that over the next 12 months, advisers and investment committees will continue to have access to the Macquarie website and the resources page for the latest insights, market commentary and product information.
Russell Investment Funds Russell provides a range of services to assist the local adviser community. This includes conducting in person meetings, events or webinars as well as distributing content (written, video, podcasts) produced by their global platform covering a range of investment and advisor-business related topics. They develop specific content to support financial advisers, including the regular Value of Advice research.
Russell has noted they are happy to make their team available to the Consilium investment committee and can call on global colleagues as required. They typically host quarterly webinars covering fund updates with their portfolio managers for New Zealand clients.
Having focused for much of the thirty-plus years on the institutional investor community in New Zealand, they have reoriented Russell Investments New Zealand in recent times to align more closely with financial advisers. Russell is continuing to look at ways in which they can work with this community to help them better service their clients.
Vanguard Vanguard offers the following adviser support services:
• Portfolio Construction Workshop: conducted on a quarterly basis, it is a 3 hour workshop with an audience of around 12 advisers come together to go through the material. Vanguard hosts the workshop and the advisers receive 3 CPD points. It involves three categories of subject matter
• building trust amongst investors
• adding value to clients with a focus on portfolio construction, and,
• sustainability of an advisory business.
• Portfolio builder tool: in partnership with Morningstar, you can analyse the construction of portfolios via an interactive tool.
• Whitepaper articles: specialised whitepaper articles constructed by our Intermediary Services Group (ISG) and available for viewing online.
If and when services are modified post the planned handover to Mercer, we will make a further assessment at that time (as part of Consilium’s qterly DD process).
We can confirm that Russell have been more active in recent months in support of Consilium requests for info and services, as per their response
• Client Roadshow: our annual roadshow event with senior leaders from the US providing a comprehensive market overview and targeted content and research.
• Roundtables: focusing on specific product streams and providing valuable insights to our clients, our roundtables occur twice a year.
Follow up items – None required. BlackRock provides the least “pro-active” support of their funds although they are generally responsive and accommodating when we provide them with a request for services/support. The other managers, to varying degrees have all demonstrated a willingness to support adviser needs directly or via Consilium, with Harbour and Dimensional generally being the most supportive.
In this category we are looking for the tenure of the key investment managers running the fund.
Fund manager Fund managers - summary
Harbour NZ Corporate Bond Fund (Corporate Bond Fund)
All
Mark Brown has managed the Corporate Bond Fund since Harbour took over its management in 2011.
As soon as key management personnel change, Harbour makes a commitment to the client to keep them fully informed. This communication will include employees leaving, reason for departure and future course of action within Harbour to ensure clients still receive the highest level of service and attention.
BlackRock Information provided in the manager due diligence report Consilium receives qtly In general, we are less concerned about specific manager bios with established firms providing index tracking mandates.
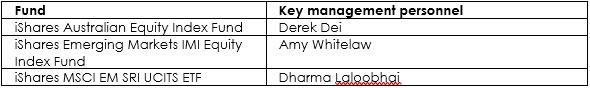
Bhanu Singh is Head of Asia Pacific Portfolio Management at Dimensional. He joined Dimensional in 2003 and has been in his current role since 2015. In this role, Bhanu is responsible for all portfolios managed out of the Dimensional offices in Australia, Singapore and Japan. He works closely with Dimensional’s Research team to help design and implement custom solutions that the firm can provide to help clients achieve their goals. Additionally, Bhanu is a member of Dimensional’s Investment Research Committee and serves as a Director for Dimensional Australia. Bhanu holds a BA in business economics with honours from UCLA and an MBA in analytical finance with honours from the University of Chicago Booth School of Business.
We note that on the 28th of October it was announced that Bhanu Singh will become DFA Australia’s new CEO beginning in 2023.

MAM intends to remain an Investment Manager for the funds and has indicated it will retain their local investment management presence in New Zealand.
Until such time as this Mercer transfer completes, there remains some
The change is subject to approval from Guardian Trust (which is expected) with the deal set to close at the end of the March quarter next year.
Until such time as this transfer is complete, there remains some uncertainty over the investment management personnel.
As remaining funds will be exiting Consilium model recommendations at the end of Marsh 2023 we are not so concerned about assessing the outlook for MAM funds post March 2023.
uncertainty over the investment management personnel. Consilium models will exit remaining MAM funds at the end of March 2023.
James is the portfolio manager for directly managed Global equity funds. He manages in excess of A$8bn across a range of investment strategies with over NZD $3bn in global equity, decarbonisation and Australasian ESG strategies.
James has extensive global industry experience. He has been involved in global equity trading since 1998 and was Head of Trading at F&C Asset Management in London where he spent 7 years in senior portfolio management and trading positions. Prior to joining Russell Investments, James spent 6 years at Deutsche Bank working in the bank’s London, Singapore and Sydney offices in equity sales related positions. James joined the investment division at Russell in 2013.
Since 15 December 2021 James has run both Russell Investments Sustainable Global Shares and Russell Investments Hedged Sustainable Global Shares Funds.

Russell Investments ensure their clients are fully informed regarding the people that make the decisions relevant to their investments. They have a Global Marketing function, which includes a specialist Client Communications team that ensures the timely production and dissemination of communications materials. Russell ensures all communications that are particularly sensitive in nature is disseminated in a manner which is fair to all unitholders. They typically notify any changes via email at least initially, outlining said changes. Typically, this will be followed up with a webinar which will go in further details and allow for any questions.
Vanguard Vanguard’s Equity and Fixed Income teams both take a team-based approach to investment management, avoiding a star manager system. Each portfolio manager is cross-trained and can carry out investment management responsibilities across all relevant portfolios. This approach ensures fund management continuity and consistency over the long term.
Furthermore, Vanguard has a global investment platform that employs the same daily, disciplined and tightly risk controlled approach. Trading desks in Australia, the United States and the United Kingdom manage and trade both equity and fixed income assets. This global platform allows Vanguard to trade assets locally; for instance, the Melbourne desk handles portfolio management and trading functions for Asia-Pacific stocks and bonds. Regardless of location, the portfolio management teams use the same investment philosophy and approach, which is supported by a single, global investment management platform that combines portfolio management, trading and operations tools. One of the many benefits of this global integration is the ability to provide contingency trading/coverage for different desks located around the globe. Vanguard traders and portfolio managers use multiple trade execution systems. If one fails, they can use an alternate
Appropriate for predominantly index-tracking mandates
Vanguard notifies its clients of any senior personnel changes within the funds management teams via email, within one month of the change.
In respect of the DFA response, we will ask for bio’s of Robert Ness and Timo Zauner to flesh out our knowledge of their full credentials, but their response on this is not considered critical to the completion of this review (their response will contribute to a brief related EDD). Otherwise, no follow-up required. Although Vanguard did not nominate individual managers for their funds, the funds themselves are all index trackers, so the relevance of a single named manager is considerably lower than for a fund where some degree of manager discretion is available. Overall, while we would have preferred to receive a clearer identification of who has primary responsibility for each fund, the non-discretionary nature of these Vanguard mandates encouraged us to accept the team management response in this instance.
In this category we are looking at whether the investment mandate is firmly set so we can be confident of the limit on manager discretion to change risk factor allocations.
Harbour Each Harbour fund has its own Investment Strategy and Objective prescribed in the Statement of Investment Policy and Objectives (SIPO).
Portfolios are monitored against tolerance limits and target weights on a daily basis. Position holdings data provided by the custodian are also reconciled against expected holdings daily. All mandate rules are coded and activated to provide compliance testing of all their trading and holdings. Investment guidelines are coded and locked in the AIM system by operations, independent of the portfolio manager, and all updates are reviewed and signed off by Compliance. The best-in-class AIM system provides live, real-time checks of portfolios versus mandate restrictions.
All active and passive breaches for Harbours funds are notified to the Supervisor, New Zealand Guardian Trust, and appropriate action is taken in consultation with them. Any active breaches of a Fund’s SIPO are to be corrected as soon as possible, unless in the opinion of the Manager, it is in the interests of investors for the position to be held or sold over a longer timeframe.
BlackRock BlackRock replied that the ability of the manager to deviate from the prescribed mandate is not applicable They noted that these are index funds that aim to replicate the performance of the benchmark, therefore they are not making any autonomous active decisions. In general, each portfolio shall be invested and reinvested in a portfolio of equity securities with the objective of approximating the aggregate return of the respective benchmark. Characteristics and holdings will match the benchmark as closely as possible.
Dimensional All investment decisions are made by the Investment Committee and implemented by the Portfolio Management team. We impose specific parameters that help maintain consistent focus on the targeted asset class and premiums. Portfolios are continuously monitored for adherence to internal investment guidelines.
The daily portfolio monitoring process is overseen by Jed Fogdall, Global Head of Portfolio Management, who reports to Gerard O’Reilly, CIO and Co-CEO. In addition, Dimensional’s Compliance department administers both pre- and post-trade compliance monitoring controls to support
Harbour are extremely diligent about informing any proposed changes in mandates (revised SIPO’s) or any occasional breach
Combined with BR’s comprehensive frontend and back-end compliance checking, we are very comfortable in their consistent mandate delivery
This aligns with the results of our regular quarterly monitoring processes
Macquarie Asset Management (MAM)

the Portfolio Management and Trading departments by alerting the appropriate personnel of certain issues discovered during its review of daily transactions and holdings information. Further details regarding Dimensional’s specific Pre and Post trade controls can be found in section 2.6 below.
The Fund is passively managed, meaning the investment manager buys and sells financial products to track the performance of the designated market index. MAM do not make active investment decisions in the Fund which move the Fund’s portfolio holdings significantly away from the portfolio weightings that are determined by the index. The consequence of this will be that the Fund will not sell a security because the issuer is in financial difficulty or negatively impacting the index return, unless that security is removed from the index being tracked by the Fund.
Macquarie, however, do have the ability to work with UBS to make any changes they may want to see implemented. For example, in 2019 when the New Zealand business made the decision to divest of civilian firearms, UBS would have been required to divest of any civilian firearms-related investments held in the index if applicable.
In managing the global index bonds strategy, UBS’s primary investment approach is full replication of the index. The goal of the indexed strategy is to mirror the returns and characteristics of the Bloomberg Barclays MSCI Global Aggregate SRI Select ex Fossil Fuels Index. As a result, UBS will attempt to hold each stock in the Index in approximately the same weight as it appears in the index.
Russell Investment Funds
The manager has no such ability to deviate from the mandate (strategy) as described in the Product disclosure statement. Key fund details:
The Sustainable Global Shares Fund is an index-oriented equity fund managed by the global direct implementation team. The mandate is to provide a global equity fund that closely tracks the MSCI ACWI index, while offering a lower carbon, lower reserves and improved ESG profile relative to the market. The fund also includes exclusions across several sub-industries.
Vanguard Vanguard’s philosophy emphasises rigorous and consistent portfolio construction, driven by indepth analysis, to achieve highly risk-controlled and cost-effective results. The team employs optimal portfolio construction techniques that range from full replication, to a sampling methodologies to match the risk characteristics of the strategy to those of the relevant benchmark.
Vanguards Risk Management Group (RMG) performs numerous portfolio monitoring tests to ensure compliance and propriety in relation to trading activities (e.g. trade reversals, trade overrides monitoring, derivatives as a percentage of holdings and money market stress-
testing). RMG also monitors the performance and tracking error attributes of each fund at the security, asset class and fund level on a periodic basis. Again, there are controls in place to ensure the monitoring is performed on a timely basis and accurately, with appropriate escalation in place for exceptions.
The Vanguard Australia Compliance team receives daily reports on pretrade compliance testing (conducted by RMG) and post-trade compliance testing (conducted by the Wholesale Fund's custodian - JP Morgan). These reports are reviewed by the team and relevant incidents and issues are raised ad hoc with the other control functions, as well as front office where necessary. Once resolved, the Vanguard Australia Compliance team uses these issues and incidents as a basis for conducting risk assessments and determining additional compliance monitoring requirements.
JP Morgan (JPM), the appointed custodian, uses an in-house application (HiPortfolio) to independently perform compliance testing using fund holdings information within their accounting systems. Additionally, the appointed trustee performs routine checks of fund holdings, to ensure ongoing compliance with ASIC regulations and prospectus requirements.
Further details regarding Vanguards specific Pre and Post trade controls can be found in section 2.6 below.
Follow up items – None.
In this category we are looking for whether investment assets are increasing so we can be confident that the manager continues to be a viable business.
Harbour
We note the funds generally have good FUM levels and are growing, aside from the fixed income declines of the last 12 months

BlackRock Funds all have sufficient scale. The FUM of the iShares EM IMI Equity Fund have declined, in part, due to the


global shift towards SRI (part of the reason for the growth in the iShares SUSM ETF). The iShares EM IMI FUM is still adequate to run this strategy.


DFA FUM levels are all adequate and we watch out for changes in FUM levels in our quarterly DD.
In spite of a large outflow from AIF PQ in mid-2021, the fund retains sufficient scale to be managed efficiently albeit with a slight impact on average fund costs.
This fund likely to exit remaining model portfolios in March 2023.

Russell Investment
Funds
We make note that FUM has been decreasing, with a sizeable reduction in the third quarter of 2021, as a result related fees to the fund have increased by 3 basis points
Mandate assets are stable/growing, which is acceptable in the current market environment.
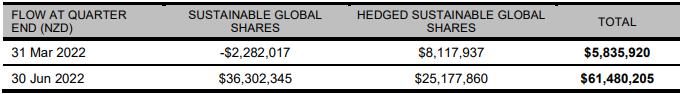
Follow up items – None
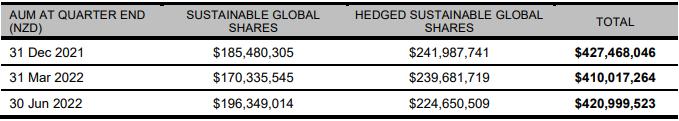
In this category we are looking for how the performance compared vs their documented benchmarks and if variations are due to risk exposure
Fund manager Performance - summary Comments

Harbour Gross returns (excluding fees and tax). All numbers are annualised
Sharpe ratio comparisons:
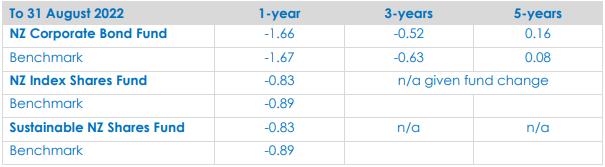
BlackRock Returns gross of fees and denominated in AUD. All numbers are annualised.
Blackrock did not provide SUSM returns, or Sharpe ratios. However, we can assess very little deviation from benchmarks without reference to Sharpe ratios.
Performance below is shown on Net Asset Value (NAV) basis, with gross income reinvested where applicable. Performance is denominated in USD.
DFA did not provide Sharpe ratios. However, we monitor relative and riskadjusted tracking error very closer throughout our quarterly monitoring, so the absence of Sharpe ratios is not critical.
Returns and ratios are as of 31 August 2022.
The performance target for our passive fund mandates is to track as closely as possible the index on which the fund is based in order to provide investors in the fund the same performance relative to the market underlying the index (gross of fees). The strategy is to buy and hold non-restricted securities, trading only when there is a change to the index or cash flows, or to reinvest cash from dividend income, tax reclaims or corporate actions.
On a monthly basis the returns are within 3-5 bps, which is what we would expect. However, there are times when full replication of the index is not possible. At times this has gone in our favour, but there are other times where
Russell Investment Funds
the difference is larger, and this coincides with months where there have been large cash flows into or from the fund.

There is also a small allocation to cash as part of the investment guidelines for settlement purposes. This can be a drag (or a gain) from time to time, depending upon market conditions.
Russell notes that the funds were only launched in December 2021, therefore return data is limited and do not yet feature a 3-year track record to provide relevant Sharpe ratios.
Fine.
Vanguard All returns are as at 30 June, 2022. Vanguard International Shares Index Fund (Wholesale)
Low tracking differences are fine.
Vanguard Ethically Conscious Global Aggregate Bond Index Fund (Hedged)

Vanguard Ethically Conscious International Shares Index

Sharpe Ratios:
None. In general, the Sharpe ratio data (when supplied) was in line with expectations. Not all firms supplied Sharpe ratios, however in general they supplied tracking differences to major benchmarks. As the Consilium investment team monitors relative and risk-adjusted tracking error very closer throughout our regular quarterly monitoring, the absence of any Sharpe ratios in these responses was not considered to be critical. In light of our detailed fund monitoring, we may consider removing the request for Sharpe ratio calculations next time.

Follow up items
In this category we are looking for whether trading costs are accounted for and if there are procedures for best execution being followed
Harbour For the 12-month period to 31 July 2022 the actual trading and brokerage costs were:
• Harbour Corporate Bond Fund: 0.08%
• Harbour NZ Index Shares Fund: 0.037%
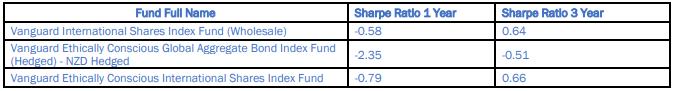
• Harbour Sustainable NZ Shares Fund: 0.062%
Harbour uses its trading policies to outline the process around best trade execution.
Harbour takes all reasonable steps to execute client orders on the best available terms, taking into account the relevant market at the time of the transactions and size concerned and the characteristics of the execution venues to which the order can be directed.
Harbour follows the process outlined in the trading policy to allow it to obtain the best possible result for the client in accordance with that obligation. Harbour elects different execution venues for the execution of orders taking account of the factors affecting its choice of execution venue. Of fundamental importance, Harbour is not tied to Jarden as an execution venue and deals with a range of different execution venues to obtain on a consistent basis the best possible result for the execution of client transactions.
The best possible result for the client is determined in terms of the total consideration, representing the price of the investment / financial instrument concerned and the costs related to execution, which includes
Harbour trading and brokerage costs are reasonable (for NZ). They were unable to provide and independent verification of best execution, which is commonly the case for NZ fund managers
all costs incurred by the client that are directly related to the execution of the order, including execution venue fees, clearing and settlement fees and any other fees paid to third parties involved in the execution of the order. Speed, likelihood of execution and settlement, the size and nature of the order, market impact and any other implicit transaction costs may be given precedence over the immediate price and cost consideration only insofar as they are instrumental in delivering the best possible result in terms of the total consideration to the client.
Harbour maintains a Broker Panel which and considers best execution and research provided for the benefit of client.
The Broker Panel is periodically reviewed for consistency of client outcomes.
BlackRock BlackRock’s Portfolio engineers use technology and risk models to manage portfolio tracking error. A quantitative process balances tracking error and transaction costs to consistently deliver benchmark performance.
Open market trading is executed with brokers according to BlackRocks policy of best execution. In light of this policy, BlackRock will select broker-dealers or use automated trading systems that will seek to execute securities transactions for clients in such a manner that the client’s total cost or proceeds in each transaction is the most favourable under the circumstances. In selecting broker-dealers or automated trading systems to trade securities, BlackRock will consider all factors it deems relevant, including, but not limited to: (i) BlackRock’s knowledge of pricing and liquidity currently available; (ii) the desired timing of the transaction; (iii) the nature and character of the security or instrument being traded and the markets on which it is purchased or sold; (iv) the activity existing and expected in the market for the particular security or instrument; (v) the full range of brokerage services provided; (vi) the broker’s or dealer’s capital strength and stability, as well as its execution, clearance and settlement capabilities; (vii) the quality of the research and research services provided; (viii) the reasonableness of the commission or its equivalent for the specific transaction; and (ix) BlackRock’s knowledge of any actual or apparent operational problems of a broker or dealer.
The size of BlackRock’s trading activities is substantial and this volume has allowed them to build good working relationships with the world's leading brokers and ensures that they provide them with the lowest trading rates possible and the best access to natural liquidity. BlackRocks trading professionals continuously monitor brokers’ capabilities by electronically comparing benchmark prices versus actual execution. Executions are monitored both on an individual security basis and across entire trade programs. Across all BlackRock trading activity, we leverage a proprietary tool for transaction cost analysis (TCA) to manage and monitor trading performance. Their TCA framework measures execution quality with respect to price before, during and after a trade is completed. The metrics holistically capture all trading costs which include the total impact from a broker’s order handling and routing decisions. They use this data to identify outliers which may indicate that a particular counterparty, tactic, or venue is no longer appropriate for BlackRock.
The process of evaluating execution quality is monitored and reviewed internally on a regular basis by key members of the Investments businesses. BlackRock has established an Equity Trading Oversight Committee (ETOC), which in conjunction with its Equity Policy Oversight Committee (EPOC) have oversight responsibility for implementation of BlackRock’s equity trading policies, including the firm’s best execution policy. Representatives of Trading, Portfolio Management, Risk &
BlackRock were unable to provide an independent verification of best execution.
Quantitative Analysis Group, Legal & Compliance and Operations, and other key business partners are members of the committees. ETOC and EPOC meet quarterly
Dimensional The Trusts’ transactional and operational costs are summarised below. This information can also be found in the Additional Information Guide attached, which can be found on our website: https://www.dimensional.com/au-en/document-centre
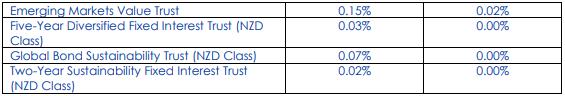
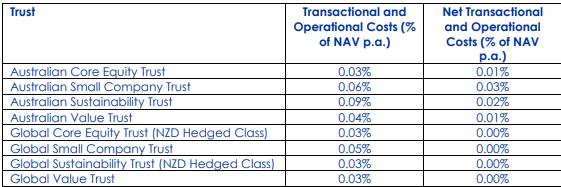
DFA refers to third party TCA providers and we are aware they do engage with these providers to benchmark their relative execution effectiveness
Dimensional's trading desks continuously evaluate the total costs of trading, attempting to minimise these costs while maintaining the highest quality execution in accordance with our investment philosophy. Dimensional reviews the costs of trading using a wide variety of internal and external trade-cost evaluation tools including third-party trade cost analysis (TCA) providers, consulting firms, and academics.
Dimensional’s Best Execution Oversight Committee meets at least quarterly to review the outputs from our internal and external monitoring efforts across all asset classes traded by Dimensional, including equity securities, foreign exchange (FX), exchange traded futures, and fixed income securities.
To aid in this evaluation and testing, Dimensional maintains a global price database that stores extensive information regarding market trades and market quotes; this database is used to analyse Dimensional’s trading behaviour and outcomes. Multiple price metrics are used for evaluation, depending on asset class. Dimensional also employs thirdparty TCA providers and academics to assist in the evaluation of trades on a global basis.
These internal and external tools and services are used to help ensure that Dimensional’s execution strategies continue to fit our investment philosophy.
In summary, the results from both the internal and external analysis have reinforced Dimensional’s philosophical position that patience and flexibility in the trading component of implementing strategies is a valuable component of the implementation process. Specific research efforts have aided decision-making around various topics including venue usage in equities, timing and location of FX execution, and commission rates.
In addition to the annual management fee, the fund incurs ‘in fund’ costs associated with its operation (eg trustee, legal, audit, unit pricing, etc). These costs are borne by the Fund and due to their nature can vary slightly from year to year.
MAM was unable to provide and independent verification of best execution, which is commonly the case for NZ fund managers
Russell Investment Funds
Actual charges are set out in the Fund Update which is published each quarter on the Macquarie New Zealand website and on the offer register at www.companiesoffice.govt.nz/disclose .
Macquarie Asset Management has a Best Execution Policy which sets out the general principles of fiduciary duty relating to dealing and the allocation of trades across client accounts. In addition, the Macquarie Deal Allocation Policy provides for the fair and equitable deal allocation among portfolios with the same or similar investment styles, risk profiles and investment guidelines, and to ensure that clients’ interests are prioritised over that of MAM.
MAM executes physical trades with an objective of minimising transaction costs and obtaining the best price execution. Generally, the highest priority will be placed on execution price, but MAM will consider and may prioritise other factors in order to achieve the best possible result for the client. MAM will determine the relative importance of execution factors with reference to a specific transaction, considering criteria such as client classification, and the characteristics of the order, financial instruments involved, and execution venues and brokers
It is the responsibility of portfolio managers and trading desks to achieve best execution, taking into account execution factors as well as client specific instructions, and portfolio specific events (such as applications or redemptions).
MAM does not actively trade assets within the portfolio. All purchases and sales are in support of changes to the strategy of the fund and not for short-term speculative activities.
One-way turnover is expected to be around 10%, or 20% 2-way. We’d expect brokerage costs to be 1- 2bp p.a. and 2-4bp for trading (impact costs), giving an approximate maximum of 5bp p.a.
For Russell Investments, best execution does not mean simply obtaining the lowest possible transaction or commission cost, but rather whether the transaction represents the best qualitative execution considering several factors. Accordingly, in seeking best execution, the Investment Division considers the full range of a broker-dealer’s services, including the value of research provided, execution capability, spread cost, commission rate, financial responsibility, and responsiveness, among other factors.
Russell Investments Implementation Services (RIIS) seeks to achieve the best transaction terms reasonably available under the circumstances at the time of the trade. A full examination of best execution involves the qualitative and quantitative assessment of many factors beyond trade results, including, but not limited to, client trading intentions and requirements, and possible venues and trading partners.
Best execution is integral to the investment outcomes of their portfolio management activities, and they monitor counterparties on an ongoing basis for changes in their risk profile, for price quality, and for operational effectiveness. Trade allocations are adjusted based on the results of these analyses. RIIS calculates transaction costs for every trading venue, and they qualitatively monitor counterparties each quarter. This information is evaluated by the Russell Investments Trade Management Oversight Committee (TMOC). Based on this information, the TMOC recommends which relationships to terminate, which to maintain, and
which to expand (and at what level). The TMOC’s evaluation considers the following information:
> Execution cost and efficiency
> Operations, settlement, and other post trade services
> Accuracy, completeness, and timeliness of trade reconciliation
> Quality of relationship and client service
> Quantitative analysis and research
> Technology including online applications, communication applications, and the visibility of pre-matched (or non-matched) trades prior to settlement
> RIIS’ best execution program.
Traders formally evaluate venues by benchmark at least twice annually, by execution quality, by operational efficiencies, and by their ability to provide market colour. We collect over 15,000 data points a period, for equity, fixed income, foreign exchange, and derivatives. Venues are ranked and placed on our semi-annual counterparty scorecard.
The scorecard evaluates everything from broker analytics to the overall relationship, client service, and technology. It is a comprehensive review by venue versus benchmark. Russell notes that it is both a quantitative and qualitative approach that we integrate with real time trading results in a way that sets us apart from our competitors.
In order to help verify best execution, Russell also hires third party vendors to perform trade cost analysis (TCA) on their trades, as detailed below:
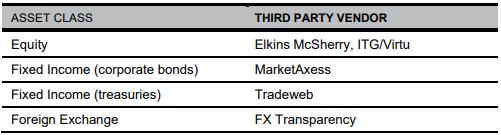
Vanguard Vanguard, as a matter of their internal policy, cannot disclose specific trading and brokerage costs, along with peer comparisons relative to other managed funds.
Vanguard’s best execution policy is to take all the sufficient steps to obtain the best possible results for its client in terms of “total cost” (in the case of purchases) and “total proceeds” (in the case of sales) when executing transactions. Total cost and total proceeds mean the:
a) price,
b) cost,
c) speed
d) likelihood of execution and settlement,
e) size,
f) market impact,
g) nature, or
h) any other consideration relevant to the execution of an order.
While we are disappointed that Vanguard will not disclose trading and brokerage costs, these costs form part of the tracking error we identify when we monitor Vanguard index funds. Given the minimal tracking error we identify during this process we can at least be confident their trading and brokerage costs are highly competitive.
Follow up items – We will ask BlackRock if they can supply annual trading and brokerage costs for each fund.
In this category we are looking for whether the fund manager can demonstrate adequate pre and post trade compliance processes.
Harbour Harbour uses the compliance module in Bloomberg to monitor compliance of funds. Rules are built within the system. Prior trade execution, the portfolio manager enters orders in the system which simultaneously checks if the desired order is within the limits. If the order passes the compliance check, the orders will proceed for brokers to fill. If the order triggers a limit, an alert will be sent to Harbour Operations Team and Compliance Team for review. If the order is deemed to breach a limit, appropriate action such as cancelling or amending the order will be implemented.
The portfolio management team continuously monitors client portfolios versus investment guidelines via the Bloomberg Asset Investment Manager (AIM) system. All mandated rules are coded and activated to provide compliance testing of all our trading and holdings. Investment guidelines are coded and locked in the AIM system by operations and approved by compliance. Any potential compliance breaches are flagged immediately, and the AIM system will not allow potential trades to progress. Compliance, the Managing Director, and members of the investment team receive immediate notification of both active (if any) and passive breaches.
Pre-trade compliance:
When the portfolio manager models trade across accounts a pre-trade compliance check is run to ensure that the portfolio remains within guidelines. The modelled trade is then passed to the trader who uploads a potential trade into the Compliance Manager (CM). All trades have to pass through the CM, which ensures testing of each mandated rule/restriction before the trades are routed to the executing brokers. For example, if we model a buy trade that will either place the account overdrawn or establish a position larger than the client constraint then the trade will not be available for placing with a broker. A warning is flagged, and this warning passes to the Portfolio Manager and the Head of Compliance. Unlike many systems the pre-trade compliance uses real-time pricing, which ensures intraday relevance of the rules (i.e. the CM captures intraday market moves). All warnings created either intraday by, say, price movements or by potential trading are flagged by the CM and sent real-time to both the Compliance Officer and the Portfolio Manager.
Post-trade compliance:
Harbour’s compliance system within Bloomberg generates daily compliance reports including end of day compliance checks. These reports will include any exceptions on the limits. Harbour reviews these on a daily basis to ensure that funds are within the required limits. Any passive and active breaches are then reported to the compliance team and to clients with detailed explanation on the breach, why it occurred, and actions taken by Harbour.
On the morning following trade date the compliance team and broader investment team receive from the Bloomberg AIM system several reports. Compliance reviews the reports on a daily basis. These reports are generated and sent by an Operations Analyst, and include:
• Trade allocation report for the previous day
A comprehensive overview
• End of day compliance report checking of portfolios versus mandate rules. Where breaches of rules occur explanations will be provided and reported to clients if appropriate.
BlackRock BlackRock has a multi-layered control framework to ensure that Global Trading delivers best execution for clients. The Global Trading business manages and owns best execution as the first line of defence. Risk Management, Transaction Surveillance and Compliance provide independent oversight and challenge to the best execution process. Additionally, Internal Audit serve as the third line of defence to assess adequacy of processes and share audit results with senior management. The Best Execution processes are quantitative and qualitative, with controls pre-trade, at point of execution and post-trade.
BlackRock’s overarching goal in executing transactions is to do so in a manner and at levels that are as beneficial as possible for the client in the given market conditions. In light of this goal, BlackRock seeks to select broker-dealers and/or automated trading systems to execute transactions for clients in such a manner that the client’s total cost or proceeds in each transaction is the most favourable under the circumstances.
In selecting broker-dealers or automated trading systems to trade securities, BlackRock will consider all factors it deems relevant, including, but not limited to: (i) BlackRock’s knowledge of pricing and liquidity currently available or current and historical spreads; (ii) the desired timing of the transaction; (iii) the nature and character of the security or instrument being traded and the markets on which it is purchased or sold; (iv) the activity existing and expected in the market for the particular security or instrument; (v) the full range of brokerage services provided; (vi) the broker’s or dealer’s capital strength and stability, as well as its execution, clearance and settlement capabilities; (vii) the quality of the research and research services provided, where permitted under applicable regulation; (viii) the reasonableness of the commission or its equivalent for the specific transaction; (ix) BlackRock’s knowledge of any actual or apparent operational problems of a broker or dealer; and (x) the requested size of the transaction.
All transactions at BlackRock are routed through a proprietary order management system. The system has the functionality to manage orders on a global basis, and there are various checks and controls to monitor and manage risks, counterparty restrictions and specific order instructions (such as required benchmark targets, etc.). Furthermore, the systems interface with our credit monitoring process to ensure exposures are maintained within firm’s guidelines. On a post-trade basis, all executions can be analysed against a range of intra-day and realtime benchmarks. These results are used to assess performance and are part of a continuous feedback process which ensures that their optimization methodology correctly estimates prevailing liquidity and transaction costs.
Evaluation of BlackRock traders is a dynamic process that involves informal daily forums as well as formal weekly and monthly reviews. Leveraging their robust data management systems, traders are evaluated across various criteria, including, but not limited to, trade errors, broker-dealer utilization and best execution. Best Execution Working Groups meet to review these metrics and formally escalate any issues to the relevant Trading Oversight Committees.
Dimensional Dimensional’s Compliance department administers both pre- and posttrade compliance monitoring controls to support the Portfolio Management and Trading departments by alerting the appropriate
personnel of certain issues discovered during its review of daily transactions and holdings information.
Compliance provides pre-trade compliance support for Dimensional managed portfolios using the Charles River Investment Management Solution (CRIMS), Dimensional’s primary order management system, as its main tool. Compliance works in conjunction with Portfolio Management, Trading, and the Technology department to build and test pre-trade compliance rules in CRIMS. All approved orders are tested against pre-trade compliance rules to confirm compliance with investment guidelines and restrictions. Orders which do not pass certain pre-trade compliance tests are subsequently reviewed by investment personnel to reassess the appropriateness for the portfolio. Pre-trade override authority is strictly limited to investment personnel approved by the Global Head of Equity Trading and/or the Global Head of Portfolio Management, as well as Compliance. Compliance monitors overrides on a daily basis.
Compliance independently builds and tests rules in the system to monitor compliance with investment guidelines and restrictions applicable to each portfolio.
Transactions, holdings and other security and portfolio related information are processed overnight during a scheduled batch cycle, and portfolio compliance exceptions are made available to Compliance the next morning. Compliance personnel review each exception during the day of discovery and any potential trade issue is subsequently escalated to the appropriate Portfolio Management and/or Trading personnel for review and validation. Compliance and Risk tracks the status of each issue until resolution, and any trade error is resolved in accordance with Dimensional’s Error Correction Policy or other applicable policy.
Responsibility for monitoring the compliance of portfolio mandates falls within the front office and, independently from the former, within the Investment Risk Management (IRM) team. MAM compliance systems are a combination of proprietary systems as well as tailored external systems used to manage both pre-trade and post-trade investment compliance. Data is sourced independently from the front office systems. Macquarie’s systems have a range of compliance functions to ensure client mandate limits are adhered to. These include pre-trade and posttrade compliance on a range of investment constraints.
All limits are monitored on a daily basis. Their portfolio management system (Aladdin) is used in the pre-trade and post-trade monitoring process, and pre-trade limits are monitored throughout the day to prevent breaches occurring. Post trade limits are assessed both by Aladdin and by the investment administration system via an overnight process and reported to IRM on an exception basis on the next business day. These exceptions are investigated by IRM and then followed up with the portfolio manager.
Suitable corrective actions are determined and any negative impacts on the fund are compensated by the business. All breaches are reported in their incident reporting system (Open Pages) which includes all details of the incident, and a report is produced which is sent to senior management on a weekly basis.
Russell Investment Funds Russell Investments uses Bloomberg AIM, as well as their internal order management system, which has secure access controls and can accommodate any investment constraints, to monitor the investment guidelines at the pre-trade and post-trade level. Bloomberg AIM is also
utilised to monitor for any breaches of restrictions/exclusions and sanctioned securities.
Daily monitoring of portfolio compliance with the investment guidelines, restrictions and sanctions is carried out by Russell’s portfolio managers at the pre-trade level, and at both the pre-trade and post-trade levels by their dedicated team of Guidelines Monitoring specialists who form part of the in-house Compliance function. Approximately 95% of the Guideline Monitoring team's monitoring process is conducted in an automated fashion, with around 5% (including where there is a need to manually maintain restrictions lists or watchlists) conducted manually.
The Guidelines Monitoring specialists liaise with the internal Compliance and Risk teams to ensure that regulatory and/or client obligations are met.
Fund-specific limits, thresholds and other portfolio related guidelines are coded into the order management system, which allows our portfolio managers to run additional checks for any potential “breaches” prior to trade execution. These changes further empower the portfolio managers to make timely and well-informed decisions to improve investment performance and achieve fund outcomes.
Pre-trade compliance refers primarily to the controls implemented in the portfolio management systems to help ensure that regulatory requirements, established investment guidelines, prospectus limitations and fund mandates are adhered to. These include preventing portfolio managers from adding incorrect securities, trading with unauthorised counterparties, and from breaching concentration limits.
Coding of compliance guidelines into the order management system (OMS), and the monitoring and resolution of any exceptions, is the responsibility of the Operational Risk team within Vanguard’s Risk Management Group (RMG). Pre trade compliance guidelines are maintained in the relevant trade OMS - Charles River Development (CRD) for equity strategies, and Aladdin (Blackrock) for fixed income strategies, and must be adhered to during the portfolio construction process.
RMG is functionally separate from the portfolio management groups and is responsible for maintaining the compliance module and related rules within the order management systems, as well as for reviewing exception reports on a daily basis.
In regard to mandate guidelines and constraints, Vanguard’s Investment Risk and Compliance teams are responsible for setting these up within VIA systems. Both teams have new account checklists which include a sign off by someone independent of the person that set up the rules in the system. This is monitored by the Compliance team. Compliance rules are established for each fund specific to the requirements of the investment strategy, which operate in conjunction with generic rules that are designed to support the internal investment policies of Vanguard.
Furthermore, portfolio holdings information is provided to the pre-trade compliance system daily from the back-office. Proposed trades for the day are provided to the pre-trade compliance system to check that trades are in good order. Should any of these checks fail, the Portfolio Manager will be unable to proceed with trade unless Operational Risk (RMG) or the Head of Investments, Asia Pacific approves the trade.
Trades for Equities and Fixed Interest are sent through an automated pre-trade compliance system prior to execution. Compliance rules are established for each fund specific to the requirements of the investment strategy, which operate in conjunction with generic rules that are designed to support the internal investment policies of Vanguard.
Rules programmed into the order management system provide controls that notify investment personnel of incorrect investments that are in the process of being traded. Warning messages notify traders of the potential error before a trade can be executed; alerts systematically prevent the portfolio manager from entering inappropriate trades.
When an alert is triggered, the independent first-line risk team (the Risk Management Group) is notified and an investigation will take place before the trade is sent for execution. If the potential trade is a true breach of regulatory requirements and/or fund mandate, RMG will reject the trade so it will not be executed in the market.
Prior to the commencement of a new Wholesale Fund, the Compliance team at Vanguard Investments Australia provides the custodian, JP Morgan (JPM) with the post-trade rule requirements, including a copy of the Product Disclosure Statement (PDS).
As part of JPM's process, one person will code the rule into their internal compliance system and this will be independently checked, including the test output. JPM will then send the fund rule matrix to Compliance for the validation and sign-off. This includes verifying that all rules requested have been coded and the results are as expected, and no potential exceptions are flagging once the rules are applied on the fund's go-live date. Similarly, when an existing rule is amended Compliance provides the details and JPM implement the required change.
To ensure only authorised changes are made, Compliance provides JPM with details of users who are authorised to request rule additions and changes.
The Compliance team are responsible for documenting and setting up the post-trade compliance rules. Monitoring is performed by the Internal Controls team within Fund Financial Services.
Follow up items – None
In this category we are looking for whether trading errors are documented, and policies are in place to avoid reoccurrence.
Harbour Harbour highlighted two immaterial trading errors that were identified across the three funds in the past 12 months. They occurred due to human error and third-party error. The errors were non-material or client-specific, and as such were not reported on the monthly Fund certificates. The Funds were not disadvantaged due to these errors. To avoid re-occurrence, process improvements and checks have been implemented.
In addition to this process Harbour provides compliance reports to the CIC on a monthly basis confirming that both funds operated inside their investment guidelines.
BlackRock Response was “N/A”
Dimensional
Macquarie Asset Management (MAM)
Russell Investment Funds
There have been no material trading errors in the aforementioned funds in the past 12 months.
There have been no trading errors in the Fund in the past 12 months.
The fund has experienced no trading errors in the past 12 months.
Vanguard Vanguard do not provide the number of, or monetary impact details, for any trading errors that have occurred in their Wholesale Funds, however they can confirm that trade errors are incorporated in the Vanguard Internal Events Policy. They include any error that directly impacts a fund or account. These can include but are not limited to:
• Purchase of securities not authorised by the investment guidelines for the fund/account;
• Failure to purchase/sell securities as intended;
• Purchase/sale of securities for the wrong or unintended account;
• Failure to follow specific client directives to purchase/sell/hold/wait to purchase securities;
• Allocation of the wrong or unintended amount of securities; and
• Allocation of securities to the wrong or unintended account.
Vanguard notes that it is all staff members’ responsibility to identify and escalate errors to line management, their Risk Team and Compliance. Portfolio Managers do not have discretion in regards to error correction. The trading error shall be corrected on the same day as they are discovered or as soon as practicable. The Compliance Team has the responsibility of investigating all compliance related incidents and will invoke the Internal Events Policy.
We will ask for elaboration on precisely what this means
Follow up items
While we do not believe BlackRock are high risk for generating trading errors, we will nevertheless clarify with them the meaning of their ‘N/A’ response to this question (are they saying they never make a trade error, or never can?). We are generally satisfied with the brief responses from the other managers.
In this category we are looking for whether the fund manager can outline their liquidity monitoring and stress testing processes.
Harbour NZ Corporate Bond Fund Liquid asset exposure is monitored on a live basis with the mandated minimum proportion measured in the front office and compliance systems. Alerts ensure this minimum is met. More broadly, Harbour canvas their counterparties on a quarterly basis to assess market conditions (and more regularly when they
Happy with their answers on liquidity management.
Stress testing is not covered in detail
perceive liquidity may have deteriorated). Finally, the fund manager must report to the risk committee on a quarterly basis which includes assessments of actual liquidity conditions and the appropriateness of liquidity settings in the fund.
Cash liquidity is carefully monitored on a daily basis to ensure they remain fully invested in the two equity funds to allow performance to closely track the index return. Should there be redemptions greater than cash in the portfolio Harbour would be required to sell down equities to raise the cash. Liquidity assessments of actual market and fund liquidity conditions and the appropriateness of liquidity settings in the fund is conducted and reported to the risk committee on a quarterly basis.
BlackRock The Manager has established a Liquidity Risk Management Policy which enables it to identify, monitor and manage the liquidity risks of the Funds. Such policy, combined with the liquidity management tools available, seeks to achieve fair treatment of Unitholders and safeguard the interests of remaining Unit holders against the redemption behaviour of other investors and mitigate against systemic risk.
BlackRock has a dedicated Market Structure and Electronic Trading team. The team drives BlackRock's liquidity sourcing research and strategy with the aim to minimize transaction costs and maximize access to liquidity through multiple execution channels, in addition to defining new market structure with the goal of optimizing trading outcomes for buy-side market participants. A key research output of the Market Structure and Electronic Trading team is BlackRock's proprietary Transaction Cost Models. These models are based on BlackRock’s global execution data and forecast the cost of trading equities, FX, futures, rates and credit. They also serve as a key input into their Transaction Cost Analysis (“TCA”) framework which is used to evaluate trading costs across asset classes.
although we have had discussions within the last 12 months with the manager about this with respect to both bonds and equities markets.
Dimensional
Dimensional has decades of experience managing liquidity-sensitive portfolios for which demands can be immediate. Dimensional monitors cash flows as part of the portfolio management process. Recognising the reality of those potential demands, they construct portfolios to capture return premiums when they are expected, minimising frictional costs and enhancing returns through disciplined implementation.
Liquidity issues are incorporated into the screening process and portfolios are structured to minimise the likelihood of an illiquidity event. The trusts do not purchase securities that do not meet liquidity criteria such as minimum share price, minimum number of shares traded daily, minimum ratings requirements, etc. The trusts are also broadly diversified. Investing in a large number of securities enables Dimensional to manage a larger asset base than many of their peers and they seek to spread portfolio turnover across all the trading days of the year. Changes to portfolio holdings tend to be incremental.
They also monitor portfolio liquidity levels on a post-trade basis by a compliance system, Charles River Investment Management Solution (CRIMS).
Dimensional uses historical data to understand how their strategies would have behaved in different market and economic environments. To ensure robustness within the portfolios, the Research group performs real-time analysis on large amounts of security reference data. They conduct extensive robustness checks, using their proprietary database that includes data for over 70,000 companies from around the world. Information from these findings feeds into the portfolio design.
Additionally, Dimensional monitor the portfolio to help ensure that the portfolio follows its investment objectives. We also believe strongly in having a
Does not explicitly touch on stress testing although detailed liquidity management processes are effective in almost all market conditions. Index funds, in general, will move according to market conditions, so the stress testing aspect is somewhat less relevant here.
“human overlay” in the investment process. The tools are designed to facilitate the efforts of their highly seasoned professionals, not as a proxy.
Upon request, Dimensional can provide scenario analyses or stress testing on its portfolios. Under their rules-based and process-driven approach, scenario analyses or stress testing will not override the disciplined implementation.
UBS’s Global Risk System provides stress testing functionality with enhanced risk analysis functions across a full range of traditional and alternative assets. Both positive and negative stress scenarios are available, providing full drillthrough capability from the total portfolio to sub-portfolio, strategy or single holding level. Each scenario is presented with a narrative of the event and a list of the resulting key shifts in market factors. The scenarios are presented in three groups according to the intended use:
Core scenarios: standardized stress tests representing severe market movements over time, and for comparing between portfolios. At their simplest, these can be shifts to a single yield curve or equity market, or to all yield curves and equity markets (eg all equity markets fall by 10%). More sophisticated stress tests may shift some markets by more than others, eg countries with higher or more volatile treasury rates may be given larger basis point shifts. Global scenarios, including equity markets, interest rates, spreads, FX rates and alternative investments, may also be useful.
The scenarios are generally kept static over time, not continuously adjusted to suit the current market situation. They may be periodically updated, however, as structural changes in the markets occur. This means the core stress tests are suitable for comparing portfolio exposures over time. Factor shifts are used so that individual stocks respond to the scenarios according to their factor loadings. This means that more volatile stocks and stocks in cyclical sectors such as materials and financials tend to show larger changes in price than stocks in defensive sectors like consumer staples.
Historical scenarios: historical scenarios cover a range of past events. Most are crisis scenarios where risk assets decreased in value, but in some scenarios risk assets increase in value, or different asset classes are affected in different ways. The scenario set focuses more on recent history rather than events in the distant past, as more reliable historical data is available, and more recent scenarios may be more relevant to current market conditions.
Regional economic events: designed to capture the effects of regional economic drivers and dynamics. For example, these scenarios model the effects of Australian economic drivers on regional markets. They are forward looking economic scenarios, but also have some of the characteristics of sensitivity analysis as economic variables are shifted by a specified amount, and the response of market variables is forecast.
Liquidity adjusted scenarios: To comply with the ESMA Liquidity Stress Testing (LST) guidelines and SFC circular, LST implementation includes stress testing of a fund’s assets and liabilities across (1) historical, (2) hypothetical and (3) reverse stress tests for in-scope funds. Multiple scenarios are run for each type of stress test.
In index fixed income portfolios, the liquidity of the underlying assets is primarily driven by the index composition. However, UBS’ approach which has a strong focus on minimising transaction costs, seeks to trade more liquid issues to save costs, while ensuring that the portfolio stays in line with the headline risk-return characteristics of the benchmark. In general, the aim is to construct an optimal portfolio which efficiently replicates benchmark risk characteristics with fewer securities that are sufficiently liquid and diversified. The team continually monitors market liquidity and aim to select the most liquid securities for the portfolio.
Russell
Investment FundsWith regards to trade execution, the portfolio managers and/or centralized trading team considers overall market conditions, upcoming market events, changing liquidity conditions as well as security specific liquidity issues to assess the possible market impact of trading and timing of execution.
Russell Investments employs a liquidity risk management process and conducts stress tests which enable an assessment of the liquidity risk of the funds under exceptional circumstances. They evaluate whether the liquidity profile of the investments of the funds is appropriate to the redemption frequency of the funds, as set out in the relevant prospectus.
The firm’s Investment Risk Management (IRM) team within its independent, inhouse Global Risk Management (GRM) function is responsible for measurement, management and analysis/reporting on market and liquidity risks globally across all investments and all asset classes managed by Russell Investments. As part of the daily monitoring process, funds are subject to liquidity monitoring as a key supplementary metric. Fund liquidity assessments are presented to the relevant boards on a monthly basis.
Portfolio liquidity is assessed in prevailing (normal) as well as stressed conditions.
The investment risk management team within RMG follows an established framework that involves a series of activities related to assessing, managing, and monitoring risks. This includes conducting periodic stress tests and scenario analyses to address risks arising from potential changes in market conditions.
The framework involves analysing funds according to established risk factors. Investment risk is analysed on an ex-ante basis by measuring risk exposures and estimating risk levels and comparing them with established thresholds. Exceptions are analysed and elevated for dispositions. In addition, fund returns are analysed on an ex-post basis to validate risk factor estimates and gain deeper understanding of the impact of portfolio management decisions. The investment risk management team works closely with the portfolio management and operational risk teams.
The investment risk management team evaluates risks at the following levels:
• Individual security level.
• Factor levels such as sector weights, interest rate, credit quality market capitalization, volatility, and style.
• Full portfolio level.
Activities undertaken include:
• Identification of risk factors and setting and review of risk limits.
• Monitoring of risks against limits and investigation, communication, and resolution of exceptions.
• Performance calculation and monitoring of realized returns versus benchmark.
• Performance attribution and assessment versus targets.
• Undertaking risk reviews to identify new and emerging risks and develop mitigation strategies
On a regular basis (weekly or monthly depending on asset class) the investment risk team undertakes risk review meetings with the portfolio management and trading teams. These meetings review and analyse investment risk and performance and proactively discuss related topics including upcoming activities, market conditions, and investment strategies.
Only briefly touches on stress testing although detailed liquidity management processes are effective in almost all market conditions.
Risk management and periodic stress testing looks fine. No specific mention of liquidity management aside from the cash-flow matching worksheet
Daily risk control
Monthly risk report
The cash-flow matching worksheet shows the fund’s exposure, versus its index, to primary risk factors. We review daily index tracking reports for each portfolio versus its index benchmark, using indexing pricing sources, to detect possible tracking errors from risk mismatches.
The portfolio manager reviews a monthly report analysing security exposures versus the index, including specific limits for each portfolio based on the breadth of market securities in the index benchmark. For example, funds tracking broader indices with more securities can have a more diversified portfolio and will have more stringent security constraints than those with fewer securities
Monthly performance attribution reports
Monthly risk dashboard report
The portfolio manager reviews a performance attribution report on each fund. This report details the sources of value added or lost at the risk-factor level and provides drilldown information to the security level.
The portfolio manager reviews a custom-developed dashboard report, summarising all of the monthly risk report results.
None. Overall, we could have received a little more feedback on stress testing in particular from some managers, but this is not sufficiently concerning to warrant additional questioning. Our experience working with these funds and managers through multiple stressed market environments has highlighted no unanticipated issues
Follow up items
In this category we are looking for whether proxy voting policies are being executed in shareholders’ best interests
Harbour Harbour’s stewardship policy is reviewed annually and is subject to Board oversight and approval.
Harbour is an active owner and believes in the value of constructive engagement with issuers to enact meaningful change. Where conflicts arise with respect to company strategic direction, remuneration, or other material issues, Harbour aims to work with senior management, the Board of Directors, and other investors to find a satisfactory outcome for all stakeholders. Harbour does not concern itself with day-to-day running of the business but focuses on strong shareholder outcomes.
Where instructed by Harbour, an external proxy service provider (currently ISS) processes proxy votes on behalf of Harbour solely in the interests of Harbour account clients that have delegated such responsibility. Harbour is open to providing views on proxy votes to clients that request it and can accommodate voting instructions from clients that have their own mandates. In forming their decisions on proxy voting resolutions, Harbour promote the following principles to encourage leading practice in ESG management.
- Board Composition
- Executive/director remuneration
- Climate change
- Human rights
This is a satisfactory answer.
However, each resolution is assessed on a case-by-case basis and there may be circumstances where their vote deviates from these guiding principles.
Harbour understands that proxy voting decisions may affect the value of shareholdings (both positively and negatively). The following describes the standard procedures that are followed with respect to carrying out Harbour's proxy policy:
1. The relevant Harbour analyst will review resolutions and provide voting instructions for the company in question.
2. In determining how to vote, Harbour’s analyst and relevant portfolio manager(s) will consider the General Proxy Voting Guidelines set forth above, their in-depth knowledge of the company, any readily available information and research about the company and its agenda items, and any external recommendations made by independent third-party providers of proxy services.
3. Harbour is responsible for maintaining the documentation that supports Harbour’s voting position. Such documentation includes, but is not limited to, any information provided by independent proxy service providers, and, especially as to non-routine, materially significant or controversial matters, memoranda describing the position it has taken. Additionally, this may include documentation obtained from the research analyst, portfolio manager and, where relevant, legal counsel.
4. After the proxy is completed but before it is returned to the issuer and/or its agent, Harbour may review those situations including special or unique documentation to determine that the appropriate documentation has been created, including conflict of interest screening.
5. Harbour will use its best efforts to send the proxy vote to ISS in sufficient time for the vote to be processed.
6. Harbour will record the vote decisions in both soft and hard copies, noting the rationales for any contentious resolutions, particularly those that are against management and/or proxy advisor recommendations.
7. Compliance will investigate any instances where these procedures have been breached or any evidence that they are not being followed. Based upon the findings of these investigations, Compliance, if practicable will recommend amendments to these procedures to minimise the likelihood of the reoccurrence of non-compliance.
A history of Harbour’s voting for contentious resolutions (such as those against management and/or proxy advisor recommendations) is provided to Harbour’s internal risk committee along with documented rationale to explain the decision. Aggregate voting statistics are provided to clients quarterly, summarising the total number of resolutions voted and the proportions that are in favour of management or the proxy advisor’s recommendations. Furthermore, a record of all voting across Harbour funds is available on the Responsible Investment page of their website.
BlackRock BlackRock and its subsidiaries seek to make proxy voting decisions in the manner most likely to protect and enhance the economic value of the securities held in client accounts. BlackRock has developed guidelines for the key markets in which it invests. Market-specific voting guidelines are available in the link below: https://www.blackrock.com/corporate/about-us/investmentstewardship#principlesand-guidelines
They state that, “Our voting guidelines are intended to help companies understand our thinking on key governance matters. They are the benchmark against which we assess a company’s approach to corporate governance and the items on the agenda for the shareholder meeting. We apply our guidelines pragmatically, taking into account a company’s unique circumstances where relevant. We take vote decisions to achieve the outcome that we believe best protects our clients’ long-term economic interests.
“We ensure a consistent approach to application through training of team members involved daily in proxy voting, peer review of contentious or complex vote decisions and open dialogue between team members about policy implementation insights and challenges. The proxy voting policies are reviewed annually and updated as necessary to reflect market developments, feedback from companies and our own insights gained over the course of a proxy season. Each year we do a random sample of votes cast and review the vote decisions to assess consistency with policy.”
As a large global investor, BlackRock votes at about 17,000 shareholder meetings and approximately 160,000 each year. Their starting position is to support management and generally prefer to engage in the first instance where we have concerns and give management time to address or resolve the issue. Voting against management proposals if the company is unresponsive or seems not to be acting in the long-term interests of shareholders.
Dimensional Dimensional makes proxy voting decisions based on Proxy Voting Guidelines that have been reviewed and adopted by Dimensional’s Investment Stewardship Committee. Dimensional endeavours to vote proxies (or refrain from voting) in a manner consistent with the best interest of their clients, as understood by Dimensional at the time of the vote. In some cases, Dimensional may determine that it is in the best interests of clients to refrain from exercising the clients’ proxy voting rights when the costs (including the opportunity costs) of voting would exceed, in their view, the expected benefits of voting to their clients. Additionally, international market restrictions such as share blocking, re-registration, and onerous power of attorney requirements may preclude Dimensional from voting in certain markets or at certain company meetings.
When voting (or refraining from voting) proxies, Dimensional seeks to act in the best interests of the funds and accounts they manage. They seek to maximise shareholder value considering the standards of the relevant legal and regulatory regimes, listing requirements, regional stewardship codes, and any social and sustainability guidelines of specific funds or accounts.
Dimensional’s proxy voting policy is principles-based, setting out the views on certain governance practices and providing the framework by which they analyse key proposal types. To the extent the proxy voting policy and its guidelines do not cover potential voting issues, Dimensional may consider the spirit of the policy and guidelines and instruct the vote on such issues in a manner that they believe would be in best interests of the relevant client(s). In cases of particularly complicated votes, including those that present a potential conflict of interest, input will be sought from the Investment Stewardship Committee.
Dimensional has engaged Institutional Shareholder Services (ISS) to provide information on shareholder meeting dates, research, and recommendations on proxy proposals. ISS also provides operational processing of proxy voting based on Dimensional’s Proxy Voting Guidelines through its proprietary voting platform. In addition to ISS, Dimensional may also review research and recommendations from Glass Lewis and, for Australian securities, Ownership Matters. Third-party research is only one of several inputs into the voting decision against which Dimensioanl check their own assessments on a given proposal. Dimensional retains final discretion on how to vote.
Dimensional’s Proxy Voting Policies are available on our public website (https://www.dimensional.com/au-en/who-we-are/investment-stewardship).
Dimensional votes proxies on behalf of mutual funds as well as those separate account mandates for which clients have given them the authority to vote. Dimensional’s voting activities are intended to maximise shareholder value. This involves consideration of the feasibility, costs, and expected benefits of voting for each portfolio.
Comprehensive.
More information regarding their proxy voting policies, procedures, and guidelines and a record of the proxy voting can be found online at https://www.dimensional.com/au-en/who-we-are/investment-stewardship
A key element of the effective stewardship of publicly listed companies is the investor’s right to vote on company and shareholder resolutions, often through a proxy. Macquarie’s Global Proxy Voting Committee is responsible for overseeing MAM’s proxy voting process. When voting, they act as owners and seek to ensure that proxies are voted in the best interests of the clients and that the proxy voting activities adhere to all applicable rules and general fiduciary principles.
Macquarie’s Proxy Voting Guidelines summarise their positions on various issues and give a general indication as to how they will vote shares on each issue where they are an active investor and have been delegated the responsibility to vote or provide advice on proxies. Macquarie also retain thirdparty proxy advisors to provide research and opinions on proxy voting issues and to facilitate the actual process of voting proxies. Clients may also request that MAM use the client’s preferred proxy advisory firm.
All Public Investments investment teams with active equity investment strategies have access to specialised ESG research, governance and proxy analysis. Investment teams determine how best to use this information in their investment process, including how to use the information when monitoring investee companies and determining when to engage with company management.
To enhance their ESG proxy voting awareness, Macquarie implemented a proactive proxy alert system across Public Investments in 2021. This system alerts investment teams when an ESG-identified issue comes up for a proxy vote for a company which they hold. This has resulted in several instances of investment teams changing their votes against management for a more climate-forward proposal.
The recommendations of proxy advisors are made available to the applicable portfolio management teams to review and evaluate before the corresponding shareholder meeting.
There will be times when a portfolio management team believes that the best interests of the client will be better served if MAM votes a proxy counter to the proxy advisor’s research recommendation. In these cases, the portfolio management team will document the rationale for its votes and provide its rationale to the Committee or its delegates. The Committee and its delegates are responsible for reviewing the rationale for these votes to assure that it provides a reasonable basis for any vote.
Where voting has not yielded the desired result, they have the means to escalate by engaging with the company’s senior management and/or by reducing exposure to the company or divesting entirely.
Russell Investment Funds
Russell Investments is an active shareholder, believing that shareholders have a responsibility to monitor company management and exert their influence through the exercise of voting rights. Russell Investments has built a robust proxy voting and governance process over the last 30 years geared to forceful engagement on issues related to environmental, social, and governance factors. Because governance issues tend to have a strong impact on overall shareholder value, a large portion of their engagement activities are centered on executive compensation, shareholder rights, and board strategy issues. A key element of the proxy voting process is the involvement of a broad set of investment professionals at Russell, many directly involved in the portfolio management functions, to create and maintain balance as it relates to
Comprehensive.
weighing the risks and rewards of investments including proxy voting on ESG topics.
The Proxy Voting Committee has global responsibility for proxy voting. They endeavour to promote corporate governance through the voting principles, which focus on maximizing companies’ long-term economic value. In addition, Russell targets their voting principles to serve the clients’ best interest and meet best practice fiduciary standards and will incorporate feedback from their clients, to ensure that they have a clear understanding of the clients’ interests.
The Proxy Committee and Proxy Voting Guideline Subcommittee meet regularly to ensure that the Proxy Voting Guidelines are aligned with current best practices regarding voting on ESG issues. The professionals who make up these committees not only stay on top of current issues and topics that are important to asset owners today, but also work to analyse the risk and reward merits of these topics.
Russell have appointed Glass Lewis & Co. to provide corporate governance research and proxy voting services. When researching a company’s proposal, Glass Lewis will focus on issues such as governance and financial reporting, board structure, remuneration, auditing and accounting disclosure and shareholder relations. In addition, Glass Lewis is a signatory to a number of other organisations and incorporates the Principles of Responsible Investing into its guidelines and recommendations.
Vanguard Vanguards proxy voting is managed through their Corporate Governance team based in both the Malvern, Pennsylvania head office and London office.
The team follows a process where they:
• Research upcoming proposals
• Analyse issues
• Engage with companies, etc. as necessary
• Vote according to their guidelines
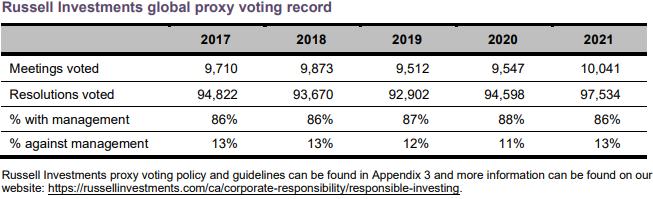
• Disclose their voting on Vanguard and SEC websites
• Monitor meeting outcomes and company governance going forward.
The Board of Trustees (the Board) of each Vanguard fund has adopted proxy voting procedures and guidelines to govern proxy voting by the fund. The Board has delegated oversight of proxy voting to the Investment Stewardship Oversight Committee (the Committee), made up of senior officers of Vanguard and subject to the procedures and guidelines described below. The Committee reports directly to the Board. Vanguard is subject to these procedures and guidelines to the extent that they call for Vanguard to administer the voting process and implement the resulting voting decisions, and for these purposes the guidelines have also been approved by the Board of Directors of Vanguard.
Vanguard’s proxy voting objective is to support proposals and director nominees that maximise the value of fund investments over the long term, increasing value for investors. The guidelines provide a framework for assessing each proposal. The guidelines stress Vanguard's role as a fiduciary, responsible for evaluating each proposal on its merits based on the facts and circumstances presented. For most proxy proposals, the funds cast proxy votes
Comprehensive.
in a block. However, funds may vote differently at times, depending upon their nature and objectives, portfolio compositions and other factors.
The guidelines do not permit Vanguard to delegate voting responsibility to a third-party non-fiduciary. A fund may refrain from voting if that is in the funds and shareholders’ best interest. Such instances might include when the expected cost of the voting exceeds the expected benefits or if voting would result in trading or other restrictions.
In evaluating proxy proposals Vanguard considers information from many sources, including the portfolio manager, the proposing company’s management or shareholders and independent proxy research services. We give substantial weight to the recommendations of the company’s board of directors in the absence of guidelines or facts that would support a vote against management. However, the ultimate decision rests with the proxy oversight committee.
In the absence of a guideline for a specific proposal, the committee will cast the vote it believes will maximise the investment’s value.
In this category we are looking for limits on the manager to increase the fee without adequate warning or a robust process.
Harbour
Harbour has noted that given competitive pressure in New Zealand, their ability to increase fees is very limited.
In order to raise fees, Harbour would need the relevant management recommendation from their Pricing Committee to be approved by the Fund Supervisor and Harbour’s Board of Directors.
Harbour would provide at least 30 days’ notice for any material change.
This is sufficient.
BlackRock
BlackRock noted that all fees and charges can change. They may vary over time as a result of changes to the product, changing economic conditions and changes in regulations. The current fees applicable to an investment are set out under section 6 of PDS’s, titled “Fund fees overview” (document available in the following link https://www.blackrock.com/au/individual/funds-information/offerdocuments) and although BlackRock have the power to change their fee structure, they have mentioned they have no present intention to do so.
In order for a fee to change, an internal approval process would need to be followed. It would require a business case outlining the rationale for changing the management & performance fees brought to the Australian Product Development Committee (AU PDC) for review and approval. The PDC committee comprises senior business leaders and stakeholders from across the business. Approvals by the AU PDC is normally carried out in a 2 stage process: approval to scope and then approval to implement. The fee change can only occur once the AU PDC approves the implementation of the fee changes.
BlackRock will provide investors 30 days’ notice of any proposed increase to their fees and charges, except for changes in the Buy-Sell Spread (refer to the “Buy-Sell Spread” subsection within MOARF’s PDS for further
Sufficient.
information). They may, under special circumstances, elect to vary the frequency of the fee collection.
Dimensional Dimensional continually evaluates investment management fees and looks to make adjustments or reductions where appropriate.
Dimensional evaluate each fund carefully on an ongoing basis, considering a number of factors. They are proactive in taking a long-term view and maintaining a competitive price for the value they deliver over index, traditional and systematic active alternatives. They also evaluate pricing of their funds to ensure they are delivering a consistent philosophy, experience and results across the expanding set of solutions and vehicle types
Dimensional will give unit holders 30 days’ advance written notice of any increase in the management fees of the trusts.
This is adequate. We have experience with DFA raising fees and they have adhered to the written advice on each occasion.
Macquarie Asset Management (MAM)
Macquarie can change fund fees from time to time and can also add new fees. The rules about fee changes are set out in the Trust Deed for the funds which can be found on the scheme register at www.companiesoffice.govt.nz/disclose
If Macquarie were to change a fee, first, investors would be given notice of a fee increase. As an increase in fees is generally considered a material change, the Product Disclosure Statement (PDS) will need to be updated and the increased fee would apply from the date of the updated PDS. They would also instruct the Fund custodian to change the daily fee accrual and instruct the finance team to increase the applicable rate of fee deduction from that date.
Macquarie has no prescribed notice period for a pending increase in fees. However, in practice they would give reasonable notice to investors of a proposed fee increase.
Sufficient.
Russell Investment Funds Russell Investments operates in a highly competitive market, and while they maintain the ability to adjust management fees to reflect market dynamics, it is not a decision taken lightly, especially increasing fees.
For management fees to increase, they need to be incorporated into Product Disclosure Statements (‘PDSs’). PDS updates are reviewed by the IIS Fund Hosting Due Diligence Committee and are either approved under delegated authority or sent to the IIS board for approval.
The Russell Investment Funds Product Disclosure Statement notes they may increase a management fee by giving investors at least three months’ notice.
Adequate.
Sufficient. Vanguard Vanguard may alter the management fee in accordance with theconstitution of the Funds. The constitutions governing each Funds generally limit the amount of the management fee component (excluding GST) to 0.20%p.a. to 1.50%p.a. This limit does not apply to ordinary expenses of the Funds that Vanguard incurs and covers out of the management fee or to any extraordinary expense of the Fund that is otherwise able to be recovered. Any increase to the management fee above these maximums will generally require unitholder approval. Vanguard will provide email notification of any pending increase in fees.
Vanguard has long been a proponent of fee transparency, and they continue to support effective fee disclosure.
Each Fund is governed by the board of trustees to the Trust and a single set of officers. The officers manage the day-today operations of the Funds under the direction of the Funds’ board of trustees. The trustees set broad policies for the Funds, which includes setting the cost/fee levels
Follow up items – None. In general, when it comes to the actual adjustment of fees within the funds, we are usually notified by writing in advance with respect to material fee adjustments.
In this category we are looking for how each fund’s rating compares across various independent rating agencies.
Harbour Mercer, Russell, Morningstar, Research IP, MyFiduciary, Makao, Responsible Investment Association of Australasia and Mindful Money all review Harbour’s Australasian equity and fixed interest investment processes annually.
Asset consultants, Mercer and Russell, along with a number of institutional clients also conduct annual due diligence on Harbour’s operations.
Specifically, the Harbour NZ Corporate Bond Fund has a neutral rating from Morningstar whilst Harbour’s overall process, people, parent, performance and price for NZ Core Fixed Interest Fund is rated Bronze. Mercer and Russell both include Harbour’s fixed interest services in their clients’ implemented portfolios but do not make their ratings publicly available.
Neither the NZ Index Shares not the Sustainable NZ Shares funds have independent ratings, however, Harbour’s overall process, people, parent, performance and price for Harbour’s Australasian Equity and Australasian Equity Income Funds are rated Gold and Bronze by Morningstar respectively. Mercer and Russell both include Harbour’s Australasian equity services in their clients’ implemented portfolios but do not make their ratings publicly available.
BlackRock Lonsec, Morningstar and Zenith currently provide published ratings for iShares Australian Equity Index Fund
Dimensional Dimensional funds have independent ratings from Lonsec, Morningstar and Zenith, as illustrated below: Several funds are unrated, but that is acceptable.

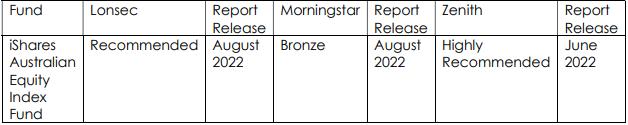
Macquarie Asset Management (MAM)
NA Funds are unrated Russell Investment Funds Being a recent launch, the funds have yet to receive formal ratings from third parties. Fine.
In this category we are looking for whether the reports contain all of the information that is necessary and useful to the responsible fiduciary Are the reports consistently provided on a timely basis?
Harbour
Harbour provided samples of monthly reports updated for their NZ Index Shares Fund, Sustainable NZ Shares Fund, along with the NZ Corporate Bond Fund.
Harbour is in the process of transitioning to Vermillion FactSet reporting which is scheduled to go live in November 2022 for October monthly reporting. Following is Harbours current process which will be automated into workflow but still involve the same parties.
• Performance data is provided by the Funds’ investment accountant, TEL
• Each Fund’s portfolio manager writes commentary including performance attribution and market outlook
• Harbour’s Compliance team certifies the Funds’ compliance with reference to the incident log and reports that capture any passive, active and third-party breaches.
• Client Service team collates reporting for clients
• Password-protected transaction statements and fund reports for all Harbour’s Managed investment Schemes are distributed by DataMail.
BlackRock BlackRock provided samples of monthly reports updated for both the BlackRock Indexed Emerging Markets IMI Equity Fund and the BlackRock Indexed Australian Equity Fund
BlackRock has a specialised reporting team responsible for sourcing, assembling and distributing timely and accurate client reporting packages based on standard and custom reporting requirements.
Dimensional Dimensional clients receive a standard set of monthly and, if requested, quarterly reporting including performance, portfolio characteristics, and top ten holdings, as well as attribution analysis with manager commentary describing an overview of the market and its return implications. Monthly reports are provided by the tenth business day of each month, while quarterly reports are produced by the fifteenth business day after quarter end.
Please refer to the document centre on our public website for the reports available by trust: https://www.dimensional.com/au-en/document-centre
Harbour reporting is generally accurate and detailed.
BlackRock did not mention reporting in relation to SUSM, but as we are exiting the fund in the current SAA review we will not pursue this.
Comprehensive.
Macquarie Asset Management (MAM)
Dimensional has an in-house client reporting team within the Global Client Group. This team reviews and approves all reports prior to sending to our clients.
Please see the response above for information regarding the reports we distribute and their frequency.
Macquarie provides fully consolidated monthly performance reporting by the 10th business day of each month and quarterly reporting on the 15th business day of the month following the end of the quarter They attached a sample of their standard monthly and quarterly investment reports.
In addition, Macquarie provides investors with an online reporting tool which is accessed through the Macquarie website. Through this extranet website, clients have access to information on portfolio holdings, valuations, or transactions for any specified date range. Information may be downloaded into an Excel spreadsheet or a PDF document if desired.
Historical monthly and quarterly reports, annual PIE tax information and certificates, along with quarterly management fee summaries are also available to be viewed and downloaded from the extranet website.
Macquarie’s standard reporting is compiled by their communications team in conjunction with portfolio managers.
In addition to their standard reporting, Macquarie were happy to discuss with clients any other reporting which may be required.
Very good.
Russell Investment Funds
Russell noted the following reports can be provided:
➢ A fund fact sheet for each asset class detailing; fund and benchmark results; a commentary outlining the major market themes and fund performance; breakdown of top 10 holdings, geographical allocations, and sector allocations.
➢ A monthly Sustainable Global Shares report, including details as per the factsheet but with further granularity on decarbonization outcomes and performance attribution.
Russell works with each client individually to assess their reporting requirements. If anything, additional to the above list is required, they would work to accommodate the client’s request.
A sample monthly fund factsheet and Sustainable Global Shares monthly report were provided.
Their monthly factsheets are compiled by the Performance & Reporting team based out of Sydney and signed off the Institutional Funds team in Auckland, with a market release target of business day 12. The monthly Sustainable Global Shares report is compiled by the Institutional Funds team in Auckland, with a target market release of business day 15.
This is fine. Vanguard Vanguard provides extensive reporting to all clients invested in Vanguard’s fund range. Vanguard provided their Wholesale Fund Reporting document that details the timing of delivery for these reports.
Vanguard’s clients receive:
• Transaction confirmation statements;
• Monthly transaction statements;
Vanguard’s reporting is sufficient and they have demonstrated they are amenable to providing additional or special reporting where appropriate.
• Income distribution statements;
• Annual Tax statements;
• Fund Fact Sheets - Fund Fact Sheets are updated monthly to provide fund performance and summarised portfolio data;
• Quarterly report - The Quarterly Report includes Fund Fact Sheets for all Vanguard Wholesale Funds
• Annual report (if requested);
• Newsletters –providing economic, educational and performance information; and
• Plain Talk guides – a series of educational booklets including topics on asset allocation.
Follow up items – None.
In this category we are looking for whether the investment manager consistently responds to requests for information by the fiduciary in a timely manner Do the responses contain the information requested? Are the responses easily understood?
Harbour
In the instance where Harbour has the information to hand straight away, they will provide this either by email or phone as applicable.
Where information will take more than a day to source, then they will respond to that effect straight away then provide information as soon as possible.
Harbour will provide an acknowledgement or the information itself if available within the business day if received prior to 5pm.
Questions from Consilium can be sent to Ainsley McLaren (Executive Director), Shannon Murphy (Investment Specialist), or directed to portfolio managers Mark Brown, Susanna Lee or Craig Stent.
Questions from advisors can be sent to Shannon Murphy in the first instance (and she will coordinate a response from the Harbour team) or asked during the monthly webinars which the Fixed Income and Equity teams run each month.
Harbour aims to respond within 1 working day. If a query will take some time to investigate or respond to, they will acknowledge the question and say when they can expect a full response. Presentations and articles are put through peer and senior staff review processes. An executive director is required to approve all information Harbour releases.
BlackRock BlackRock provides direct access to multiple account managers. These account managers conduct our annual portfolio review meetings, lead product and market opportunity discussions, and be available for any ad-hoc queries about our portfolio or the markets in general. The team will also help with any service queries, for example, about
Harbour’s response rate and level of detail are commonly of high quality
Servicing and reporting requirements are facilitated by BlackRock account managers and this is functional.
contracts, investing in new funds, portfolio activities, reporting, regulatory compliance, and billing.
Dimensional Dimensional believe communication is of prime importance in all their client relationships. To better understand and respond to the clients’ needs, Dimensional has a dedicated client service team that handles client communication, reporting, and servicing needs. Client service professionals and portfolio managers interact on a daily basis to discuss client-specific needs and requirements. This combined approach keeps clients fully informed of current research and developments while addressing any questions or requests they may have.
The client service team for Dimensional’s clients consists of:
• A representative from their Global Client Group who is the primary contact and coordinator for all aspects of client servicing. Tom Fellowes is the appointed Regional Director for Consilium.
• An individual in each of their client service and Operations teams who is available for operational instructions, client reporting and any other ad-hoc requests.
Additionally, a portfolio manager is available for portfolio and strategy meetings in person, via conference call, or by video conference when requested. The Portfolio Management team works with their Research group to provide performance data, analytics, and commentary.
Overall responsibility for responding to requests for information from investors in a timely and accurate manner is held with the relationship manager. Upon receipt of an information request, the relationship manager will make contact (email or phone) as soon as practicable with the sender to acknowledge receipt and discuss time frames for delivery.
Email correspondence is then saved in the client directory which is accessible by the wider NZ Client team. This allows another team member to easily pick up the request in the event that the responsible relationship manager is unavailable to complete the request. The client directory also contains a full history of correspondence.
The relationship managers also have weekly meetings to discuss in detail client requests currently pending and monitor any outstanding requests.
The relationship manager responsible for the account will endeavour to respond to the request, by phone or email, within 24 hours of request. The relationship manager will then communicate with the investor/adviser regarding the information required and deadlines.
Russell New Zealand has an experienced client service team who are able to call on expertise and knowledge of their global colleagues to ensure their clients expectations are exceeded. They ensure their clients are fully informed of the latest market developments through regular reporting, research materials and publications from various global teams within Russell. They believe it is vital to give clients regular access to the people that make the decisions relevant to their investments. Russell also have CRM systems which allow communication lists to be built ensuring the right information is disseminated to the right people at the right time. Russell also looks to leverage their digital technology, such as their website, as a means of disseminating much of their work, including fund factsheets, performance data, key operational data alongside the proprietary research.
Russell has communicated that specific questions from Consilium’s investment committee and advisers will typically be acknowledged within 24hrs of receipt and, depending on complexity, responded to in the
DFA response times and detail etc are usually excellent.
This is fine and reflects our experience with MAM.
This appears fine.
following days. Beyond this their experience with other clients suggest quarterly webinars typically suffice.
Vanguard Vanguard offers the following services:
• Direct access to a relationship manager
• Direct access to their Australian based client service team
• Operational support for transactions
• Performance and account reporting
• Due diligence and audit support
• Access to Vanguard's broad range of thought leadership, both business and investment and research papers
It is the role of the Client Services team to work with their clients to deliver high quality operational outcomes. The Client Services team collaborates closely with internal Vanguard departments on day-to-day operational matters.
Vanguard has a response time of up to 48 hours for acknowledging questions or requests for information from investors.
Fine.
Follow up items – None. The managers generally provided comprehensive responses and, in our experience, they all generally respond promptly to any written questions.
In this category we are looking at whether the investment manager provides adequate explanation of the investment decisions it makes and the factors it considers in making such decisions, so that we can understand and appropriately monitor such actions We want the investment company to provide support for investment education
Harbour Harbour provides the following to advisors and can also provide tailored presentations to Consilium advisors and investment team as required.
• Monthly advisor webinars
• Monthly reporting commentaries and outlook pieces
• Biannual seminars and advisor visits across the country
• Regular written Harbour Navigators providing economic, industry, ESG, and market analysis
• Fund fact sheets and updates
BlackRock For clients who are interested, BlackRock has provided training programs and seminars on the investment industry and understanding the outputs of their asset management, risk management, and investment accounting models and services. These programs are customized to the needs of each client and have addressed specific sectors of fixed income, risk management, accounting and operational issues. Less formally, BlackRock is also happy to host meetings for their clients to discuss topics of interest or to educate members of the client’s staff on areas where they have significant expertise.
BlackRock also offers client conferences and smaller seminars in selected cities, subject to compliance with BlackRock’s and client’s internal policies and approvals. They invite clients to attend these events to discuss
Harbour are strong proponents of investor communication and education.
investment strategies, issues of importance for their clients, and recent developments in the marketplace. Speakers may include BlackRock professionals as well as industry experts.
BlackRock transfers knowledge in the following ways:
1. Informal discussions and consultations on an on-going basis;
2. Conference calls to present special and relevant studies;
3. Conference calls to present and discuss research and analysis that they may conduct on behalf of clients from time to time.
The BlackRock Investment Institute (BII) brings together BlackRock portfolio managers across asset classes, regions, and investment styles in forums, workshops, and calls to discuss timely investment topics. These investment debates allow portfolio managers to challenge each other’s thinking, generate new investment ideas, refine investment theses, and share best thinking and insights.
Leveraging the insights from BII debates into timely thought-provoking publications is another way BII keeps BlackRock’s portfolio managers and clients informed of the latest investment insights. BII publications highlight BlackRock’s best investment thinking, and showcase the firm’s thought leadership and expertise in investment solutions. BII deepens BlackRock’s engagement with clients through the publications, client events and oneon-one meetings. These foster investment dialogue and help BlackRock pinpoint client solutions.
Dimensional Dimensional noted that in addition to the details provided in question 1.4.1, they also offer clients and prospects the opportunity to attend educational lectures, conferences, customised trainings, and face-to-face meetings with their investment professionals and leading academics. Every year, Dimensional holds several conferences in their global offices to provide clients with opportunities for open and frank discussions on topics of concern with leading economists, experts on the latest academic research, and their senior investment professionals.
Client education, thought leadership, and knowledge transfer are fundamental tenets of Dimensional and underlie many of their interactions with investors Dimensional believe these tenets are crucial to developing and maintaining long-term relationships. It has always been Dimensional’s goal to bridge the gap between academic research and investment practice. Given their strong links to the academic community, they have provided their clients access to some of the leading academics in financial science. They have coordinated with these professors to provide “inhouse” lectures for clients; facilitated strategic discussions with key investment staff and senior management; and worked closely with clients and prospects to develop training programs customised to their needs.
Additionally, Dimensional has a dedicated Practice Management team that works with financial advisors to help them deliver an exceptional client experience. Dimensional’s focus on practice management includes a focus on client communications, helping Financial Advisors develop a framework for effective client education, messaging, and engagement; and business strategy, helping Financial Advisors leverage Dimensional’s practice management research and insights to innovate and grow their business, including detailed business planning through Dimensional’s Future Firm™ strategic visioning, and deep support for M&A and succession planning.
Dimensional’s client service team is dedicated to handling clients’ communication, reporting, and servicing needs. Portfolio managers and client service professionals interact on a daily basis to discuss clientspecific needs and requirements. This team approach keeps clients fully
With their roots in academia, DFA do devote significant time and energy to investment education generally
Macquarie Asset Management (MAM)
informed of current research and developments while addressing any questions or requests they may have.
In the past, Macquarie Asset Management in New Zealand has produced a number of communications to ensure their clients are kept up to date with economic issues, market movements and changes to investment strategies. While the future communications framework is unclear until the Mercer transition completes, the following is a lit of prior services provided.
• An Economic and Market Update is produced at the end of each month. This outlines the key drivers of investment performance and market performance updates over the past month.
• Investment Insights are produced on an ad hoc basis covering subjects of a topical nature or to provide more in-depth insights into specific investment issues.
Copies of each of the above reports are available on the Insights hub of the Macquarie New Zealand website https://www.macquarieim.com
In addition, they hold a number of events to support their views in the market for clients. These include a monthly webinar ‘Portfolio Watch’ which covers an update on economic issues as well as their asset strategy. Macquarie also hold an Investment Outlook event at the beginning of each year.
In addition to the above material, Macquarie can provide full attribution to the investor on the Fund, eg full holdings reports.
On a daily basis a compliance report is generated confirming/denying compliance with investment guidelines and mandate. On request a monthly compliance certificate is available.
There is an Internal Controls Report which is an annual review of the internal controls by Ernst Young and is available to clients on request. This review is for the year ended 30th September each year and if the client’s balance date is different from that date we can provide a bridging letter. It will advise if there has been any change to the design of the internal controls or material exceptions identified in the period from the completion of the report to the balance date of the client.
Russell Investments has been utilising quarterly webinars as a means of providing advisers information around key investment decisions. These webinars provide an opportunity for clients to also ask questions and the recordings and materials are posted to their website. They note these compliment monthly reporting well. As travel restrictions loosen, we would hope to hold annual fund seminars with the relevant Portfolio Managers for the New Zealand based clients.
Russell publish their research and house views extensively through research reports, commentaries, and surveys. As a client, we receive Russell Investments’ research and publications as they are released, as well as full access to all past publications.
Various market and economic updates are also available for clients and advisers on their website, including the quarterly Global Market Outlook and weekly Market Week In Review video from their Global investment strategists.
https://russellinvestments.com/nz/insights/market-week-in-review https://russellinvestments.com/nz/global-market-outlook
Russell believes that it is important for their clients to be fully informed on all aspects of their investments with them They always aim to
Good.
accommodate any ad hoc requests to provide additional information and if required a one-on-one discussion with the portfolio management team. Russell work collaboratively with their clients to ensure they have all the information they require.
Vanguard Vanguard provides the following investment information to investors and advisers:
• In office presentations - about Vanguard and the value of our business offered as needed. This can be topic or product specific such as Vanguard’s philosophy on Active Management, ETFs, etc.
• Specialist Access – access to investment product specialists (Product team) and thought leadership (Investment strategy group) based on opportunity and needs.
• Quarterly asset allocation report – providing economic and product reporting for the previous quarter.
Fine.
Follow up items – None. In general, the managers have also all demonstrated a willingness to respond positively to questions in these areas.
In this category we are looking for whether the firm has adequate insurance to cover its business activities
Fund manager Insurance - summary Comments
Harbour Harbour has insurance cover for the following:
• Investment Managers Liability
• Statutory Liability
• Director’s & Officers Liability
• Cyber security
Harbour engages with a broker to ensure it is best practice and meets the conditions of our MIS license.
BlackRock BlackRock maintains the following types of global insurance coverage:
▪ Investment advisers professional liability (aka errors & omissions liability)
▪ Fidelity bond (aka crime or financial institution bond)
▪ ERISA Bond (Limits as required under ERISA)
BlackRock maintains professional liability insurance which covers loss, including legal fees and settlements, resulting from claims made against BlackRock, Inc. and its subsidiaries (“BlackRock”) by third parties resulting from a breach of fiduciary duty, error, misstatement, neglect, misleading statement, act or omission (“wrongful acts”) by BlackRock in the rendering or failing to render professional services on behalf of any client pursuant to a contract or agreement.
BlackRock maintains a Cyber Risk insurance which covers loss that BlackRock is legally obligated to pay resulting from a Claim alleging a Security Failure (failure of computer systems, unauthorized access/use of a computer system, virus transmission, denial of service, physical theft of hardware) or a Privacy Event (failure to protect confidential information). The policy also covers costs to restore/recollect/recreate electronic data, forensic investigation costs, notification costs, credit monitoring costs and other costs
Fine, albeit no coverage amounts are listed.
Good detail except for no coverage amounts.
to comply with federal/statutory regulations incurred by BlackRock following a Security Failure or Privacy Event.
BlackRock maintains Directors & Officers Liability (D&O) insurance. BlackRock does not disclose any information on its D&O insurance as this information is proprietary and confidential to BlackRock. BlackRock maintains Workers Compensation / Employers’ Liability insurance where required by law and in amounts as required to meet statutory requirement
We do not disclose the insurer information; BlackRock only places coverage with insurers rated “Excellent” by AM Best.
Dimensional Dimensional notes that risk management affects all aspects of their business and the relationships with clients. To accommodate the continuous and evolving nature of risk management, they have adopted a holistic riskmanagement approach, with Dimensional’s Global Risk Review Committee, Investment Committee, and Compliance Department operating independently and in concert to manage and oversee risk firmwide. Dimensional’s insurance details are summarised below:
• Errors & Omissions / Directors & Officers: $10M (USD)
• Financial Institution Bond (Form B-2): $30M (USD)
• Asset Investment Managers Insurance: $14M (AUD)
• Crime Liability: $15M (USD)
• Cyber Security Liability: $3M (USD)
Continuous improvement is employed to adapt the framework to industry best practices and the evolving regulatory landscape.
This is fine.
Macquarie Asset Management (MAM)Macquarie Group Limited and subsidiary companies are insured for professional indemnity, bankers’ bond and electronic and computer crime insurances, which are considered prudent and appropriate to an organisation of the scale and scope of Macquarie Group. In line with normal market practice for these insurances, typically, the Group renews its insurances annually.
Fine, albeit no coverage amounts are listed.
Russell Investment Funds
Russell Investments maintain a joint professional liability policy provided through multiple insurance carriers with coverage of no less than $60 million. This policy covers actual or alleged errors, misstatements, misleading statements, acts, omissions, or breach of duties by their directors, officers, and employees. Russell also maintain a joint fidelity bond provided through multiple carriers with a coverage limit of $50 million ($25 million per loss). The bond provides coverage against employee forgery, theft, fraud, or extortion. Other key coverages include Cyber Security ($10 million) and excess liability ($26 million). Russell believes this is sufficient coverage, since the levels they are covered at are higher than the amounts typically required by the clients or regulations. Russell notes that they do not anticipate any changes to these coverage levels.
Vanguard Vanguards Investments Australia Ltd insurance details are summarised below:
• Directors & Officers: $5M (AUD)
• Professional Indemnity / Crime: $5M (AUD)
• Crime Insurance: $5M (AUD)
• Combined Maximum Limit for all Coverage Sections: $10M
Insurer is Chubb Insurance Australia Limited
Follow up items
– None
Good.
Adequate
In this category we are looking for whether investors’ funds are secure if the investment management firm were to become insolvent.
Harbour All assets of Harbours Managed Funds are held in custody by New Zealand Guardian Trust, or its appointed custodian Trustees Executors. This means the assets are protected in the very unusual circumstance they were deemed to be insolvent.
As part of their MIS license, Harbour must record a positive Net Tangible Asset (NTA). The NTA is monitored and signed off on a monthly basis and details provided to the Supervisor and Board. If Harbour became insolvent, they would engage with the Supervisor and the regulated body, the Financial Market Authority, to ensure that clients assets were protected in line, and proper process was followed from the Funds Trust Deed.
This is fine.
BlackRock
All client assets are held by a third party custodian which is not part of the BlackRock, Inc. Group. The securities in the investment portfolio with the custodian are held in a designated nominee account on the client’s behalf.
Whilst these outsourcing arrangements give rise to risks associated with a provider service failure, this exposure is considered to be mitigated by the fact that these services are diversified across a number of leading providers and geographic locations. BlackRock has staff with material experience in managing changes between existing providers should the need arise. Detailed service level agreements and key performance indicator reports are actively utilised by the oversight functions to clearly define and monitor the quality of the services received. This is further enhanced by a risk-based approach towards ongoing health check / due diligence visits.
In the event that the custodian, BlackRock, Inc. Group or any one of its affiliated companies become insolvent or default the securities remain in the designated nominee account and are ring-fenced and protected from the creditors of the custodian as the client retains title as the beneficial owner of these assets. However, any cash that the custodian holds on the client’s behalf (for instance, which it may receive through dividend payments, proceeds of sale, etc.) will not be afforded this protection and therefore will be included in the pool of the custodian's assets to be distributed amongst all its creditors.
Dimensional PricewaterhouseCoopers LLP (PwC), Dimensional’s independent auditor, performs an annual audit of the firm’s financial statements and has not identified any significant deficiencies as of the most recent audit.
In the unlikely event of an occurrence that might cause the insolvency of one of Dimensional’s subsidiary organisations, each subsidiary has been legally organised to provide limited liability. That said, Dimensional is financially sound with a capital structure which allows for future growth. The firm generates a meaningful operating profit and maintains sufficient liquidity to meet operating needs.
All assets are legally held in a trust by an independent Custodian and in the event of Dimensional going into bankruptcy, the Regulator (ASIC) or an investor may apply to the Court to appoint a new Responsible Entity. This Responsible Entity would have the power to manage the fund. If the fund itself were viable and solvent, it would continue as normal and investors would be able to redeem their interests as normal.
Good.
Fine.
Macquarie Asset Management (MAM) The funds are unit trusts registered as a managed investment scheme under the Financial Markets Conduct Act 2013 (FMCA). Investors Fine.
receive units in each fund. Units do not give investors legal ownership of the fund's assets, but they do give investors an entitlement to the returns on the fund's assets.
As required by the FMCA, each fund's assets are held independently of Macquarie Asset Management Public Investments (NZ) Limited (MAMPI), either by The New Zealand Guardian Trust Company Limited (NZGT) as the fund's trustee/supervisor or by BNP Paribas Securities Services (BNP) as NZGT's delegated custodian. The funds are not geared, and MAMPI takes no security or charge over their assets. As such, MAMPI's insolvency would not expose the funds' assets to its creditors. Those assets would continue to be held by NZGT/BNP on trust for investors.
If MAMPI became insolvent, it would cease to be the manager of the funds under the governing trust deed. NZGT, as trustee/supervisor, would be responsible for appointing a new permanent manager that meets the FMCA requirements. If required, a temporary manager could be appointed by NZGT (or the Financial Markets Authority) to hold office for any interim period while a permanent manager was being found.
Unless otherwise terminated, the funds would continue in existence through and beyond this process. There would be no return of assets to investors. Those assets would continue to be independently held by NZGT or BNP on trust for investors and protected from MAMPI's creditors.
Fund assets are not held by IIS (the licensed manager), instead they are held by an independent custodian. BNP Paribas will act as custodian for the Sustainable Global Shares Fund. Public Trust, as supervisor, has the power to remove IIS as manager in the event of bankruptcy. Full details of process are outlined in the Trust Deed, which can be found on the scheme register at www.discloseregister.companiesoffice.govt.nz
Vanguard
The Vanguard funds are structured in a way that they are legally independent of the Vanguard Group. Whilst Vanguard Group companies are appointed in various capacities to assist in the management of the funds, the funds themselves could continue to operate in the unlikely event that the Vanguard Group were to cease its operations. The structural and legal segregation of the Vanguard funds also means that assets held within them cannot be made available to satisfy the claims of creditors of the Vanguard Group.
Were Vanguard to become insolvent or go bankrupt, but still continued to operate as a going concern, it would still be able to provide services to the fund with approval of the relevant fund boards. In the event that Vanguard could not continue to operate as a going concern, the Vanguard Group companies providing services to the relevant fund would need to be replaced by another service provider at the discretion of the relevant fund’s board of directors. Where this was not possible, then the directors have the ability to liquidate the fund and return the assets to fund investors. In any case fund shareholders would not lose money, however it should be pointed out that a change in service provider may result in fund management charges increasing.
In addition, client assets within the Vanguard funds are protected in ring-fenced client accounts in compliance with the relevant client asset rules as stipulated by the FCA and the CBI (as appropriate); all accounts are monitored on a regular basis. Only limited / authorised individuals are provided with access.
In accordance with UCITS rules all Vanguard fund assets must be held with a custodian in a segregated account that cannot be co-mingled with assets belonging to any another legal entity. In the event of an insolvency or bankruptcy event at the custodian, the segregated account would be protected from claims of creditors of the custodian. The contractual arrangements between the relevant Vanguard fund and the custodian stipulate the orderly transfer of custodial assets to another service provider. Again, fund shareholders would not lose money.
In this category we are looking for whether the firm is independently audited and by what firm
Harbour
Harbour engages KPMG to conduct a controls objective audit on the Harbour business each year. The Controls Report describes the relevant controls and the related control objectives in operation for the year. The report addresses whether the controls were suitably designed to achieve the specified control objectives, whether the controls were implemented and whether the controls operated effectively for the year.
The Controls Report is prepared in accordance with the guidelines in the International Standard on Assurance Engagements (New Zealand) 3402 Assurance Reports on Controls at a Service Organisation (ISAE(NZ)3402) with reference to Australian Auditing Guidance Statement No. 007 Audit Implications of the Use of Service Organisations for Investment Management Services (GS 007).
An audit is conducted every three years (most recently by BDO) of Harbour’s AML (Anti Money Laundering) processes and make sure they are in line with Anti-Money Laundering and Countering Financing of Terrorism Act 2009 (AML/CFT).
BlackRock BlackRock enjoys a strong financial position. The firm serves a diverse universe of institutional and retail investors globally. Products are offered both directly and through financial intermediaries. We seek to leverage our broad capabilities and global perspective to help clients address investment and risk management challenges and access attractive investment opportunities. BlackRock’s most recent annual report and quarterly earnings release can be found on our investor relations website at the following link: http://ir.blackrock.com/
Deloitte & Touche LLP is the company’s principal auditor since 2002 Dimensional The following external compliance audits are conducted annually:
Deloitte Touche TohmatsuThe results of the annual Report on Internal Controls: GS007 and Compliance Plan audits are reported to Dimensional Australia’s:
• Board;
• Compliance Committee;
• Risk and Fiduciary Committee; and
• Senior Management
PricewaterhouseCoopers
The results of the financial statements audits for Dimensional Australia’s trusts and for Dimensional Australia Limited are reported to Dimensional Australia’s Board and senior management.
The Compliance Group also conducts an annual review of the global compliance program in accordance with SEC requirements and provides a written report of the review to the Board of Directors of the general partner of Dimensional Fund Advisors LP (“Dimensional’s Board”).
Macquarie Asset Management (MAM) External auditors, Ernst & Young, conduct an independent financial audit of Macquarie Investment Funds on an annual basis. As part of this audit, Ernst & Young provide a management letter outlining detailed findings from their audit, including any internal control weaknesses identified. The resolution and completion of these management issues are reported to the Operational Risk & Compliance Committee and the boards of Macquarie Asset Management (NZ) Limited and Macquarie Asset Management Public Investments (NZ) Limited.
Russell Investment Funds
IIS is currently audited by PwC. Audit is in accordance with the NZ equivalents to International Financial Reporting Standards Reduced Disclosure Regime (NZ IFRS RDR).
Vanguard PricewaterhouseCoopers Australia.
(PwC Australia, ABN 52 780 433 757) is engaged to provide a variety of assurance engagements over the financial reporting and regulation of the funds and Vanguard Investments Australia.
Follow up items – None In the next review we will additionally ask for information regarding the audit results of the three most recent audits.
In this category we are looking for whether the fund manager can submit details in respect of any recent regulatory review?
Fund manager Regulatory reviews - summary
Harbour
Harbour has not yet had a regulatory inspection by the local regulator. Harbour does meet with the Funds’ Supervisor quarterly.
BlackRock Regulatory reviews or investigations into BIMAL in the last two years have only comprised industry-wide reviews; including in relation to Greenwashing and RE Governance. BlackRock does not provide details of the findings of regulatory investigations to clients or other third parties.
Dimensional
Macquarie Asset Management (MAM)
Over the last ten years, DFA Australia Limited (“Dimensional”), as licensed Responsible Entity of the Dimensional Wholesale Trusts (“Trusts”), has not been subject to a regulatory inspection by either ASIC or AUSTRAC.
Macquarie Asset Management Public Investments (NZ) Limited is licensed by the Financial Markets Authority as a manager of registered managed investment schemes. As a licensed manager, their supervisor ‘The New Zealand Guardian Trust Company Limited's’ role includes supervising compliance with the relevant market service licence obligations. Macquarie provide regular reporting to the supervisor, as well as meet with them monthly to enable them to monitor the business.
The following audits are undertaken in relation to the business. Some of these are undertaken by the custodian and fund services provider, BNP Paribas.
Comments
Russell Investment Funds
• Audited financial statements are required for the registered managed investment schemes managed by MAMPINZL (due by 31 July).
• Audited financial statements are required for MAMPINZL and its parent, Macquarie Asset Management (NZ) Limited (MAMNZL). For 2023, this is required by 31 July).
• Assurance engagements (Control audits) are undertaken by external auditors on the custodian’s processes. This is required annually, but the Custodian, BNP Paribas, arranges this six-monthly.
• A collective audit on the register (managed by BNP Paribas) is undertaken by an external auditor annually (last July 2022).
• Macquarie also have EY perform a controls audit annually on certain internal processes.
Russell Investments Group Limited is supervised by the FMA for AML/CFT purposes. In January 2019 the FMA requested a copy of Russell Investments Group Limited’s AML audit reports as part of an industry review. As a result, they issued a warning to Russell Investments Group Limited as one of their audits was not completed within 2 years of completion of the prior audit (it was commenced within 2 years but not completed within 2 years). Russell noted this was a technical issue only and it was not clear from the law or readily available guidance exactly how the 2-year requirement was to be interpreted. There were no penalties accompanying the warning.
Vanguard We are not aware of any recent regulatory inspections.
Follow up items – None. It is interesting to note that in many cases the firms have not been subject to a recent regulatory review which limits the effectiveness of this question.
In this category we are looking for whether the firm has a business continuity plan and when was it last enacted
Fund manager
Business continuity - summary
Comments
Harbour Harbour has a BCP plan which is updated annually and approved by their Board. The last time Harbour enacted it was in August 2021, during the COVID-19 lockdown where they were advised to all work from home. This was achieved seamlessly due to their technology infrastructure, Microsoft 365, being cloud based and all staff members having a work set up at home.
Harbour has noted that their BCP is available to us on request.
Good. BlackRock BlackRock exercises its BCPs to verify the procedures for recovering business operations are appropriate, and that key personnel are familiar with documented procedures. Each year, several exercises are performed:
1. Remote Access (i.e., from home or another external location)
2. Alternate location (i.e., dedicated recovery site or alternate BlackRock office)
3. Work transfer (i.e., transferring workload to an unaffected office and team)
4. System fail-over testing, including external vendors where appropriate
5. Evacuation drills, notification system tests, and periodic generator tests
BCM exercise results are documented, reviewed and distributed as appropriate following each exercise. Recommendations for improvements
Did not provide details of last BCP enactment, but good details in relation to the BCP itself.
to the recovery process are identified, risk-rated, and any corrective actions clearly defined and assigned to the appropriate personnel.
BlackRock conducts an annual Disaster Recovery test for each of its production data centers. During the test, the data center is isolated from the BlackRock network to simulate a total loss of the facility.
Applications are failed over to secondary data centers within the stated Recovery Time Objective (RTO) and the functionality is validated by qualified testers.
Disaster Recovery test results are documented, reviewed and distributed to key executives following each test. Documentation includes an overview of the recovery times, a pass/fail assessment.
BlackRock has noted that their BCP is unavailable to us on request. Dimensional Dimensional Fund Advisors LP and its affiliates (collectively, “they” or “Dimensional”) have adopted a Business Continuity and Disaster Recovery Policy (“Policy”) with a goal to achieve continuity of their business operations in the event of a disaster or other disruption. In an effort to meet this commitment, Dimensional maintains a Business Continuity and Disaster Recovery Program (the “BC/DR Program”).
The BC/DR Program seeks to address various types of business disruption, broadly defined as any event that prevents access to Dimensional’s critical office spaces, significantly limits Dimensional’s use of its technology, or materially impedes Dimensional’s ability to communicate with clients.
With any disruption, their priority is employee safety and then resumption of the critical processes and systems.
The BC/DR Program is supported by Business Continuity Plans, Disaster Recovery Plans, and Crisis Management Team Plans (collectively, the “Plans”) that include location- and department-specific recovery procedures and contact information for use by that location or department in meeting its recovery responsibilities.
Dimensional’s disaster recovery plans are tested at least on an annual basis. They conduct exercises of their disaster recovery procedures each year, and the plan is modified as needed.
The Business Continuity summary on the public website was updated as of May 2021. Please refer to the BCDR Events and Exercises attachment as of September 2022 for more information about the latest tests. The BCDR plan can be found here: https://www.dimensional.com/au-en/businesscontinuity-and-disaster-recovery
Good, although again no information on the latest BCP enactment.
Macquarie Asset Management (MAM)
Macquarie has a comprehensive disaster recovery plan which is continually reviewed and updated. There are two major components to the plan: business continuity and systems continuity.
Both components of the disaster recovery plan include details on key staff, disaster declaration, evacuation overview, notification procedures, recovery plan activation procedures for each business area, and system. They have disaster recovery sites for both staff premises and data centres where they host applications and infrastructure. The recovery time objectives depend on the business criticality of the application.
The following recovery procedures are currently in existence:
• Servers for all critical applications are backed up in alternate locations.
Good, although no information on the latest BCP enactment.
• Back-ups are performed daily and are kept for 8 weeks; monthly backups are kept for 7 years.
• Backups are stored offsite.
• Replicated servers are located at head office and also at the data recovery site.
Critical applications are recovered within 2 hours, as data are mirrored in real time. This enables critical business functionality to be available and the business to be operational within 2 hours. Other less important systems are recovered within 4, 12 and 24 hour timeframes, depending on their level of importance.
Macquarie have noted they do not provide their BCP to external parties, however, they noted is it available for inspection as part of a site visit. Russell Investment Funds Russell has a current BCP that they partially enacted back in March 2020. This was in response to local authorities' pandemic restrictions, e.g. working from home, instead of the office.
Russell has note that their BCP is available to view on request.
Good. Vanguard Vanguard Investments Australia Ltd (VIA) supplied their business contingency management certificate (BCM) which has internally confirmed that VIA have had appropriate business contingency arrangements for the year ended 30 June 2022 in the following areas:
Good, although no information on the latest BCP enactment.
• Crisis management procedures,
• Business contingency plans; and
• Technology recovery plans
Their Business Contingency Framework was maintained through:
a) Regular review and update of the abovementioned plans and supporting documentation;
b) Regular drills by VIA crew to exercise the implementation of the Framework; and
c) Alignment of relevant processes and supporting documentation to reflect changes in VIA’s business operations.
VIA continues to implement and maintain the Business Contingency Framework, as governed by VIA’s Board delegated risk committee.
Follow up items – None While not all firms confirmed their last enactment of their BCP, it is reasonable to assume that as their businesses were able to effectively navigate the recent Covid lockdowns (from 2020 to 2022), that their BCP operability is working. We will not drop the question from our survey, but we are not sufficiently concerned about this point to chase the firms up to nominate a specific BCP enactment date.
Person completing this questionnaire
Date completed
In relation to all funds appearing on the front cover of this questionnaire, please complete all sections in full
1.1.1 Please provide the full legal name of the funds management firm:
1.2.1 Please outline the ownership structure of the firm, identifying any major or cornerstone shareholders:
1.2.2 Please identify and explain if there have there been any significant changes in the organisational structure of the firm in the last 12 months and three years:
1.3.1 Please state the number of staff in the firm (by department and in total):
1.3.2 Please indicate the approximate staff turnover percentages (by department and in total) over the last 12 months and 3 years and add any comments, as appropriate, in relation to these turnover numbers:
1.4.1 Please describe the general support or services you currently provide to advisers and investment committees recommending these funds, along with any additional support or services you plan to offer over the next 12 months:
2.1.1 Please identify the name of the individual or individuals that have primary management responsibility for each identified fund, along with their overall experience:
2.1.2 Please identify the tenure of each of these managers with the funds they are managing:
2.1.3 When key funds management personnel change, how do you notify investors and advisers of the change and within what timeframe?:
2.2.1 For each fund, please describe the ability of the manager to deviate (if at all) from the prescribed mandate:
2.2.2 For each fund, please identify the specific controls that exist to ensure that a manager does not or cannot breach their prescribed mandate:
2.3.1 For the identified funds, please advise the annual change in assets under management quarter by quarter for the last three years:
2.3.2 For the identified funds, please advise the annual net inflow/outflow of assets quarter by quarter for the last three years
2.4.1 Please provide a comparison of the performance of the identified funds against their documented benchmarks over the recent one, three and five year periods:
2.4.2 Please provide a comparison of the risk adjusted return (Sharpe ratio) of the identified funds and their documented benchmarks over the recent three year period:
2.5.1 What is your estimate of the annual costs incurred by each fund due to trading and brokerage costs?:
2.5.2 What is your policy for assuring best trade execution? Are you able to provide any independent verification of best execution?:
2.6.1 Please detail the pre-trade and post-trade compliance processes that your firm follows and any technology that you utilise to assist with these processes:
2.7.1 How many trading errors have you documented in each identified fund in the past 12 months?:
2.8.1 Please detail how you monitor the liquidity of your funds and what stress testing you perform:
2.9.1 What are your policies for proxy voting on behalf of shareholders?:
2.9.2 Do your proxy voting policies require that you always vote in a manner that you believe is in the exclusive best interests of shareholders? If not, why not?
2.10.1 What ability does the fund manager have to increase fees for the funds they manage?:
2.10.2 What process would be followed in order to increase fees?:
2.10.3 What notice would investors/advisers receive of a pending increase in fees?:
2.11.1 What independent agencies (such as Morningstar, Lipper, adviser publications, etc) currently have a published rating on any of the funds identified in this questionnaire?
2.11.2 Please summarise a complete list of the current ratings per fund:
3.1.1 Please describe and provide examples of all fund reports provided to investors/advisers (if multiple funds provide the same suite of reports, then please provide one full suite of reports in an appendix to this questionnaire and indicate which funds replicate this same reporting suite):
3.1.2 For each report, please identify who compiles the report along with when, and how often, the report is updated:
3.2.1 What is your system/process for responding to requests for information from investors/advisers?:
3.2.2 What is the expected response time for acknowledging questions and requests for information from investors/advisers?
3.3.1 What information or materials do you provide to investors/advisers to explain key investment decisions and the factors considered in making them?:
3.3.2 What additional information or materials (if any) are provided to advisers to enable them to monitor the actions of the fund managers?:
4.1.1 Please detail your insurance you have in place, what liabilities they insure and why you feel this level of insurance cover is sufficient/best practice?
4.2.1 Detail the security investors have in place against your firm’s insolvency:
4.2.2 If your firm was to become insolvent, please detail the process that would be followed in respect of the management of each of the underlying funds:
4.3.1 What company audits your fund management firm, and to what independent standard?
4.4.1 When was your firm’s last regulatory inspection by your local regulator? Please provide or attach a summary of the inspection results.
4.5.1 Do you have an up-to-date business continuity plan (BCP), and when was this plan last enacted in any material aspect?
4.5.2 Is your BCP available for us to view on request?