10 minute read
Appendix: Supporting analysis

from CIC Yearbook 2022
by Consilium

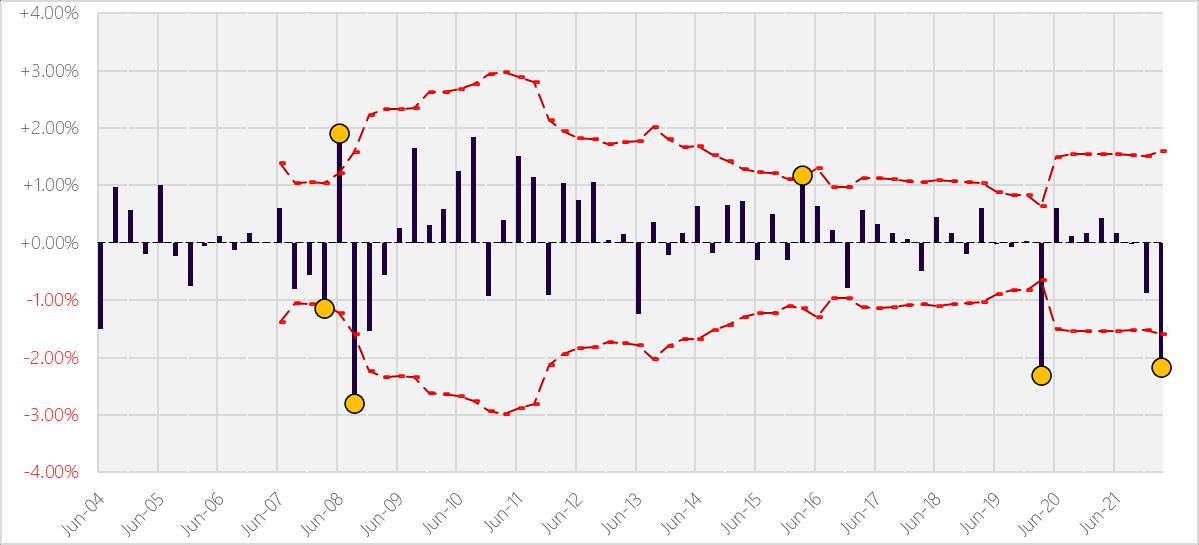
1. Tracking error chart
2. Review of the investment mandate
Advertisement
The Dimensional product disclosure statement (PDS) applicable to Q1 2022 was dated 26 May 2020. The stated objective of the trust is:
Within the risk constraints of investing in eligible short to intermediate-term, high credit quality instruments, the objective of the Trust is to maximise the return of a broadly diversified portfolio of domestic and global fixed interest and money market securities.
The Trust is not managed with the objective of achieving a particular return relative to a benchmark index. However, to compare the performance of the Trust with a cash index, reference may be made to the Bloomberg AusBond Bank Bill Index (AUD class units) or the Bloomberg NZBond Bank Bill Index (NZD class units).
The CIC has frequent dialogue with the fund manager, and we are satisfied there has been no change to the strategy/mandate without our knowledge.
It should be noted that although Dimensional has referenced the cash index we elect to use the FTSE World Government Bond Index 1-5 Years (hedged to NZD) which better reflects the duration risk the fund takes better than cash does.
3. Investigation with the fund management team
The trusts performance commentary (in AUD) for the quarter stated:
The trust underperformed the Bloomberg AusBond Bank Bill Index by 4.61%.
Interest rates broadly increased across global developed markets for the quarter. For example, for government bonds, the Australian five-year yield increased by 124 basis points (bps) to 2.56%.
The Canadian five-year yield increased by 114 bps to 2.39%. The German five-year yield increased by 84 bps to 0.34%. The Japanese five-year yield increased by 12 bps to 0.03%. The UK five-year yield increased by 67 bps to 1.43%. The US five-year yield ended the period at 2.50%, an increase of 123 bps.
Realized term premiums were negative across global developed markets as longer-term bonds underperformed their shorter-term counterparts. As a result, the trust’s longer duration detracted from performance relative to the bank bill index.
The trusts positioning commentary (in AUD) for the quarter states:
The yield curves in global developed markets began the quarter generally upwardly sloped, indicating positive expected term premiums. During the quarter, eligible yield curves steepened in the short-term segment and flattened in the intermediate term segment, with the two- to three-year maturity segment generally providing the highest expected returns. As a result, the trust began to focus on bonds in the two- to three-year maturity range. However, the duration of the trust remained longer than that of the Bloomberg AusBond Bank Bill Index over the quarter. At the end of the quarter, the trust’s duration was 3.57 years, while the reference index’s duration was 0.13 year.
Bonds denominated in the Australian dollar, Canadian dollar, New Zealand dollar, and US dollar generally exhibited some of the highest currency-hedged expected returns globally. As such, the trust generally focused on bonds denominated in these currencies.
4. Attribution analysis
Due to the volatile events of the quarter, funds experienced a wide dispersion of returns and even a modest over or underweight will have had a material impact on relative performance The following attribution analysis versus the benchmark, FTSE World Government Bond Index 1-5 Years (Hedged), show us where the differences in exposure lie and where the sources of performance were.
Analysis 1a - attribution analysis by security type and credit rating
Table 1
Allocation Attribution by security type for trust relative to benchmark, Q1 2022
Allocation by security type accounts for an aggregate -36bps of relative fund underperformance
We observe that the trusts relative overweighting to Corporate Bonds lead to 0.37% of allocation underperformance, this is consistent with Dimensional’s commentary of widening credit spreads through the quarter.
Overall allocation by credit rating accounted for a positive 7bps of relative fund outperformance. This analysis found mixed results. There was positive allocation performance from being overweight to AAAs, and underweights to AAs, however this was largely offset by the underweight position to the outperforming A and BBB rated securities.
We look closer at the exposure levels by security type and credit rating later in the paper.
Analysis 1b - attribution analysis by duration
The aggregate allocation by duration attributed -102bps of relative fund underperformance.
The trust held bonds of longer average duration than the benchmark (weighted average of 3.57 years vs 2.70 years) and we see the relative positioning in aggregate detracted from the performance through the quarter The result is consistent with Dimensional’s fund commentary highlighting a steepening of the shortterm yield curve through the quarter and a flattening of the intermediate yield curve
Analysis 1c - attribution analysis by currency
There was wide dispersion of the average return of currencies, which was driven by each currency groups make up (duration and quality), and their position at the start of the period.
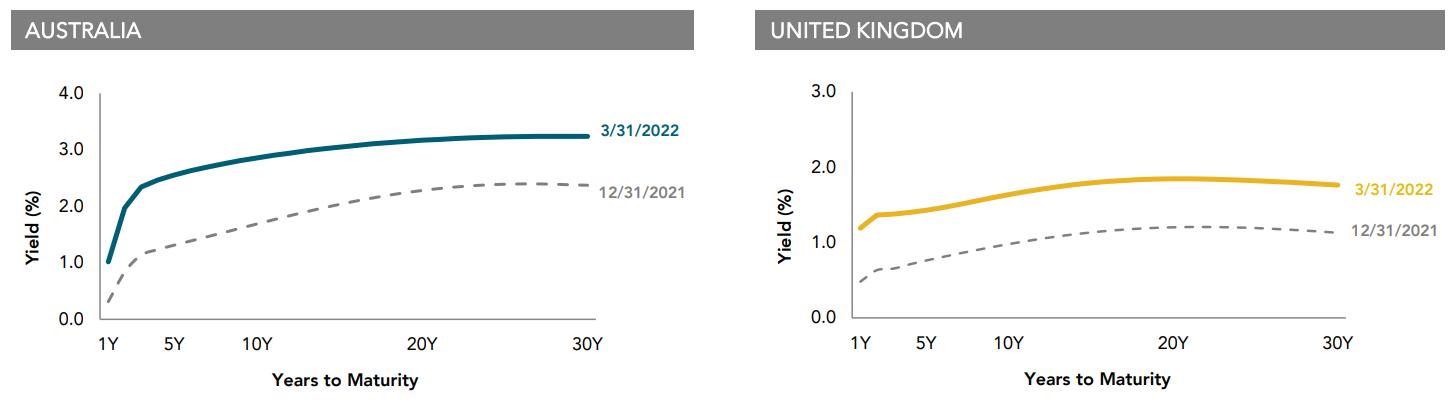
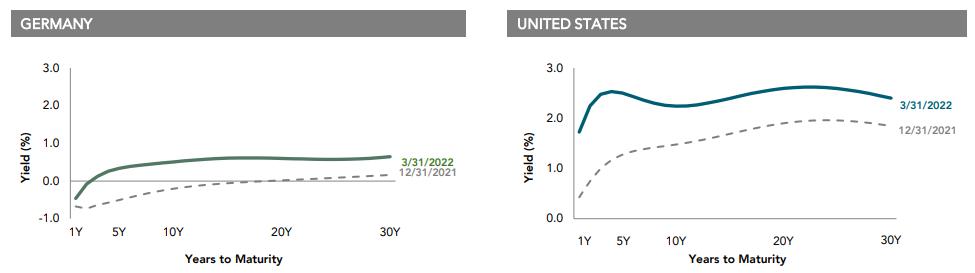
The quarter’s changing inflationary expectations were a contributing factor in rising yield curves as illustrated in figure 2. Central banks generally changed their signalling from an expectation that inflation would be transitory to a concession that it would in fact be more persistent. The Federal Reserve shifted in
March to raise their benchmark interest rate for the first time since 2018, while also providing guidance that more rate hikes were to come
With the yield curves shifting upward, we see negative performance from the government bond holdings of the benchmark Figure 2 and Table 4 shows the negative performance can largely be attributable to the sharp increase in yields which led to negative term premium. Japanese Yen was the only positive currency return, seen to be attributable to the Bank of Japan’s unwavering commitment to low interest rates,
In aggregate, attribution by currency resulted in -75bps of underperformance relative to the benchmark Dimensional communicated they expected the AUD, CAD, NZD and USD to exhibit the highest currencyhedged expected returns globally and table 5 provides consistency with this. The trust is intentionally allocating higher than benchmark weights to steeper yield curves which give a higher expected roll down return.
Data source: Dimensional Fund Advisors and Consilium calculations
The compositional attribution by currency highlights sources of relative underperformance within currency allocation As the trust intentionally allocates higher than benchmark weights to securities with higher expected returns, we will see differences between currency allocations duration and credit profile
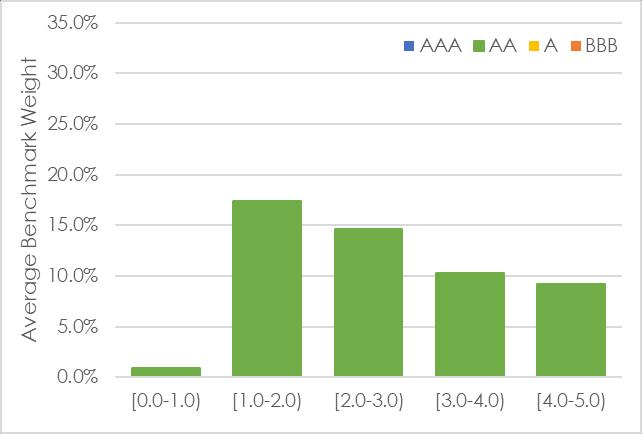
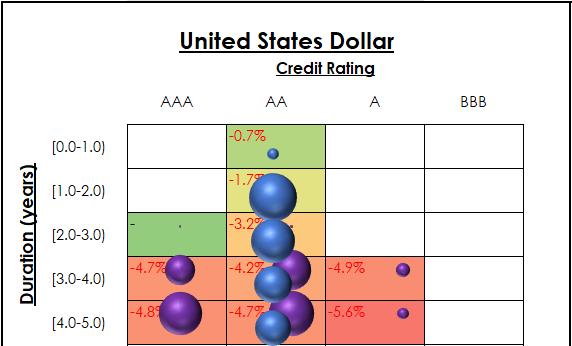
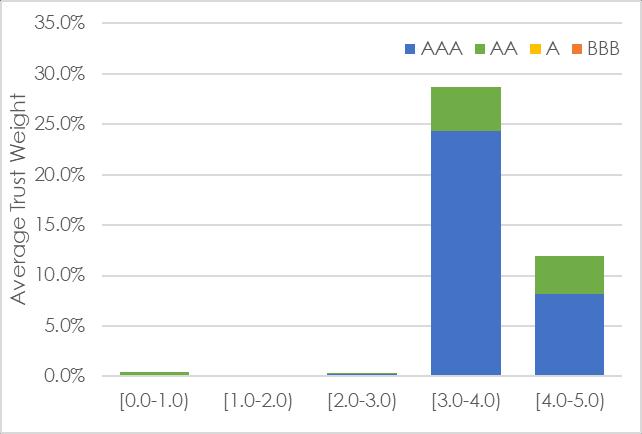
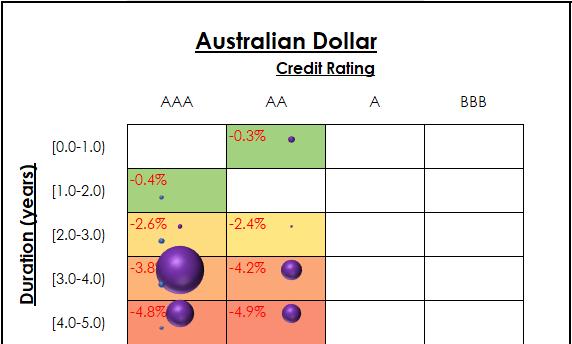
To provide an example of this we present below the relative holdings of just USD bonds on figures 3 and 4. Figure 3 shows us the average weight by credit rating (the columns) and by duration of the underlying bond (the rows) for the benchmark (the blue bubbles, bigger bubbles mean larger allocations), and the trust (purple bubbles). These are presented across a matrix of returns for each segment
Looking closely at the AA rated, 4–5-year cell, we see a negative segment return of -4.7% The trust took 15% exposure to this allocation in comparison to the benchmarks 9%
From also looking across the whole matrix, we see a high density of the trust’s allocation to poor performing bonds with relatively longer duration. The benchmark on the other hand has a high density of allocations to relatively better performing bonds of shorter duration, accordingly, for Q1 2022, the trusts relative USD positions were a source of underperformance.
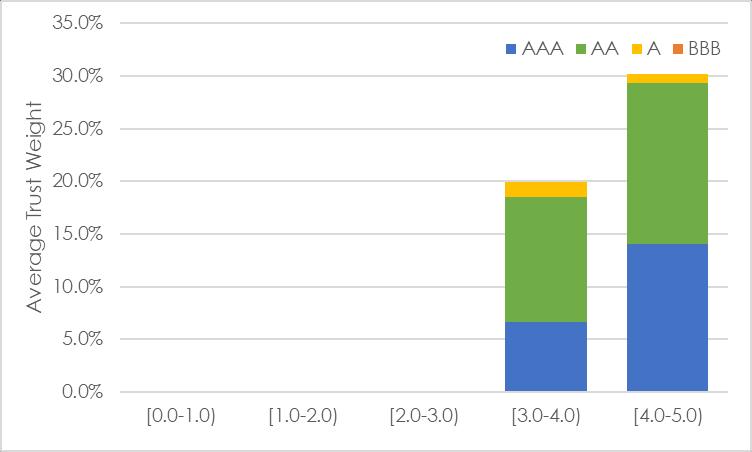
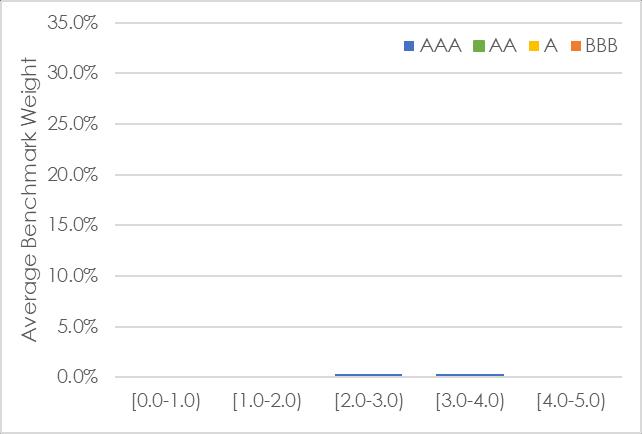
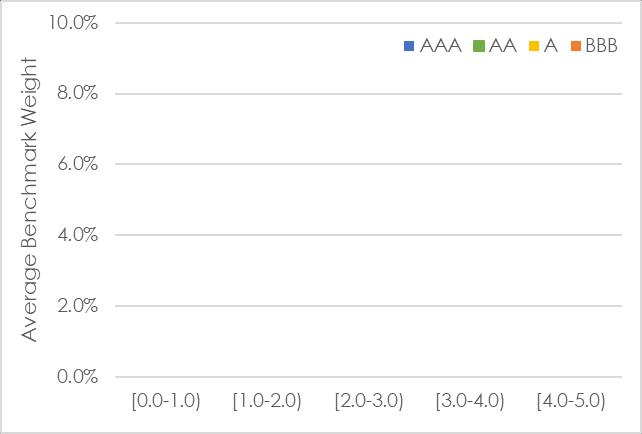
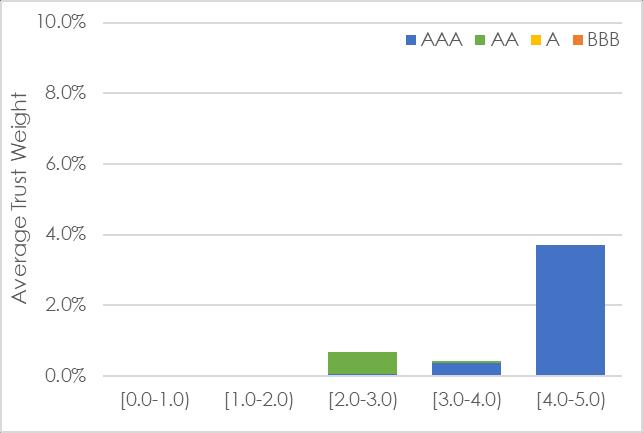
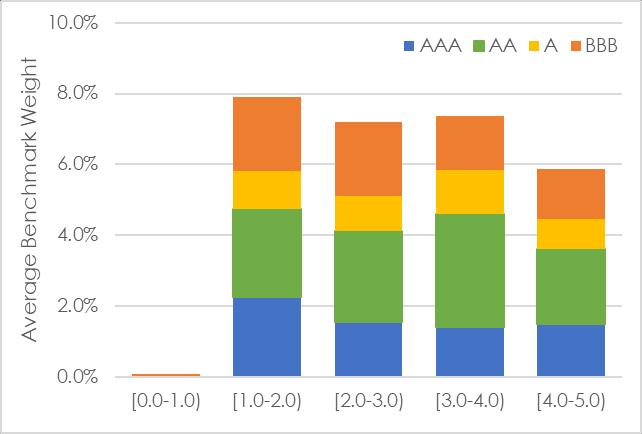
Figure 4 presents these average exposures again and further highlights the difference in composition of USD exposure. The benchmark takes a large exposure across the currency group, with density in the 1-3 year region, while the trust has far less exposure across the board. We also observe the benchmark only allocated to quality AA bonds (specifically US treasuries)
This particular analysis highlights the significant difference between how exposure can be taken within the currency allocations, further snapshots by currency are presented in Appendix 2 below
Figure 3: Average trust and benchmark weights within USD with segment performance, Q1 2022
Data source: Dimensional Fund Advisors and Consilium calculations
Figure 4: Average trust and benchmark weights within USD by duration and credit quality, Q1 2022
Data source: Dimensional Fund Advisors and Consilium calculations
Generally, over short time periods (such as one quarter) there is not significant variation in performance across close ratings or duration buckets. But given the extraordinary events that occurred during the quarter it has resulted in different compositions having an unusually substantial impact on relative performance. Overall, the attribution analysis has identified that the underperformance during the quarter is largely explained by the trust’s higher relative exposure to corporate bonds, higher exposure to yield curves that moved the most, and compositional duration and credit differences within each currency allocation. However, understanding the sources of relative underperformance is only the first part of the EDD, the second part is to ascertain whether the trust consistently operated within its mandate during Q1 2022
Analysis 2: Analysis of risk exposure
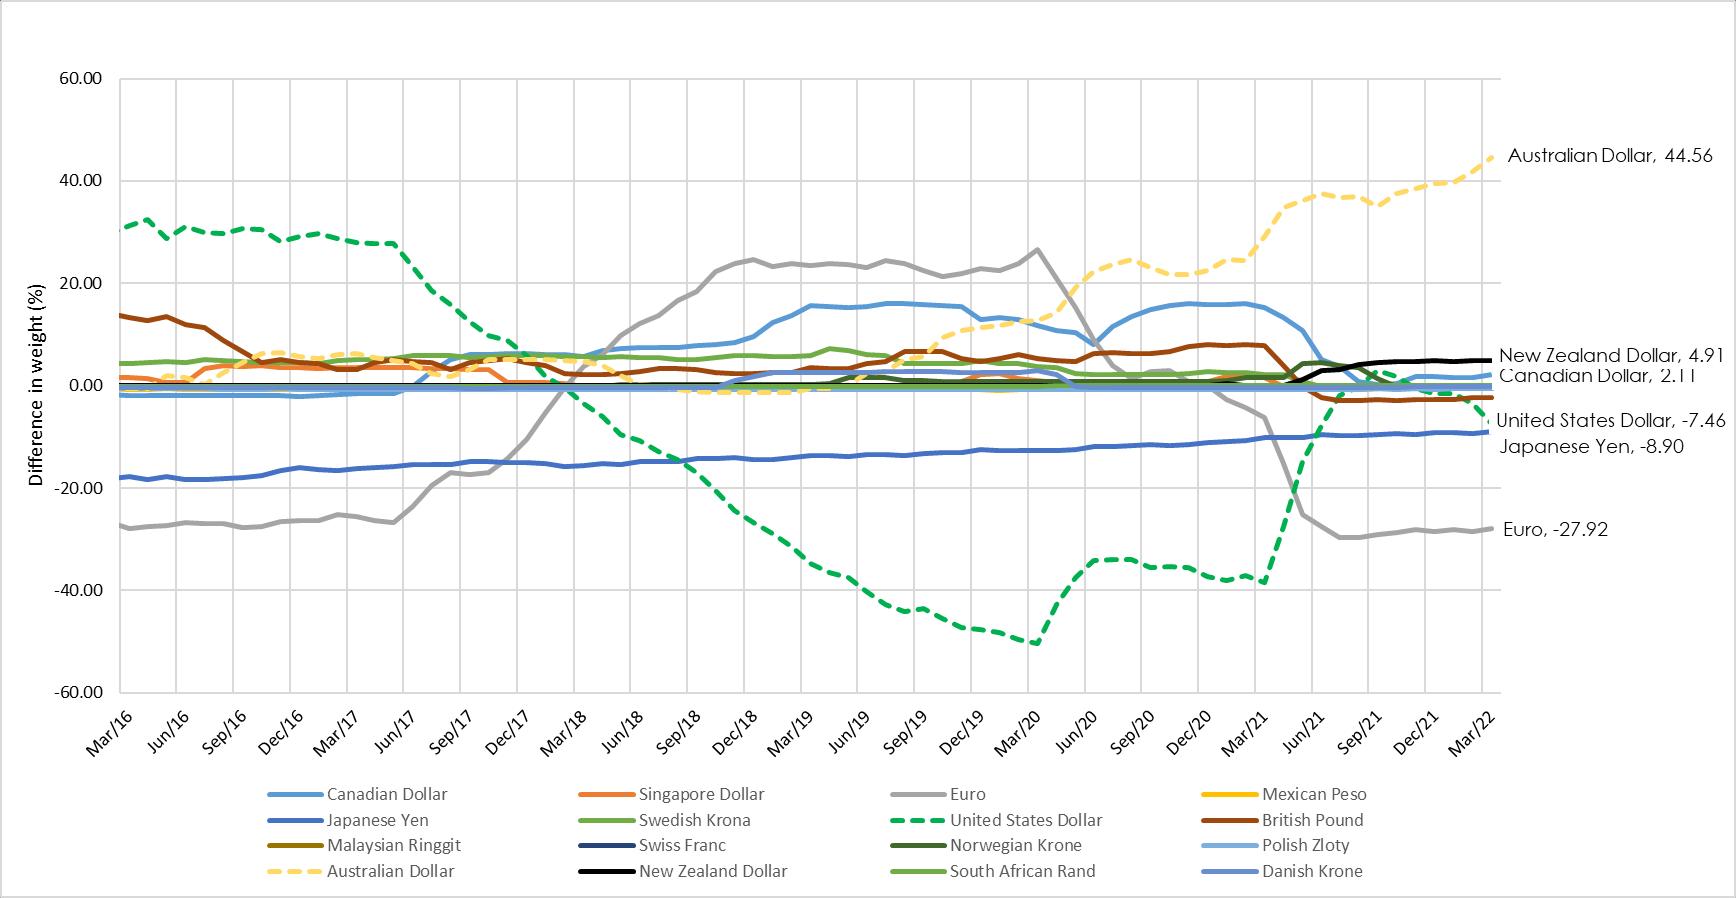
First, we look at the historical relative exposures of currency between the trust and index
Data source: Dimensional Fund Advisors, FTSE
We note relative overweights/underweights have changed significantly over the historical observations, specifically the variation in relative USD and EUR exposures The chart clearly depicts Dimensional’s aggressiveness in positioning where they expect the highest returns The latest positioning of the trust is being driven by the steepness seen in the AUD and USD yield curves as communicated by Dimensional
Discussions with Dimensional have confirmed the trust has no relative limits for either, currency or issuing country, given the use of a cash benchmark. Rather, the absolute limits are a 75% maximum to the USD yield curve, a 50% maximum limit to the Euro, and 30% max to GBP, CAD and JPY. For smaller markets like Singapore, New Zealand and other European curves like the Swedish Krone there is a 10% portfolio limit. Dimensional’s variable maturity strategies allow up to 100% in the base currency of the account which means there is no limit on the trust’s allocation to Australian dollar securities
Next, we look at credit risk. The historical relative exposures by security type are summarised below in figure 6, followed by the relative exposures by credit rating in figure 7
Data source: Dimensional Fund Advisors
Data source: Dimensional Fund Advisors
We observe a persistent overweight to corporate bonds being achieved through an underweight to government bonds. We also observe an overweight to AAA bonds achieved by underweighting to all other investment grade bonds This chart does not illustrate it, but we can confirm the trust has not taken any exposure to bonds rated below A as per its mandate
The Q1 2022 relative positioning by both security type and credit rating is consistent with the previous year The committee finds no evidence of unacceptable exposure, although we do note its current exposures are among the most extreme relative to historical observations (in particular the USD and AAA overweights) in response to the current environment.
The historical duration is summarised below.
Figure 8 shows the trust has consistently been below its mandated maximum duration of 5 years
The CIC notes that the relative exposure is consistent with the trust’s strategy, which is to reduce duration exposure as yield curves flatten. However, during the previous two years, the trust’s strategy has led it to take unfortunate duration positioning. It decreased duration in 2019 and so missed out the benefits of the surprise rate cuts and yield compression following the outbreak of COVID-19. Subsequently, the trust has increased duration before the negative impacts of a faster than expected interest rate hike cycle during 2022
We held discussions with Dimensional in regard to all of their international fixed income trusts’ relative underperformance through these two contrasting events. Dimensional detailed their ongoing research into fixed income and the risk premiums available in this asset class. Examples of recent research include
- Other signals of expected return of bonds such as the equity profile of an issuer1 ,
1 See The Cross-Section of Global Corporate Bond Returns, Lee, Rizova, Wang 2022
- The reliability of changes in interest rates or inflation of subsequent performance of credit markets associated with the change
All of these studies have found negligible (if any) improvement available to the existing strategies and they have not elected to make any change following these two somewhat exceptional periods.
This is reasonable. We should not and do not aim to build portfolios that are optimal during market corrections. Such portfolios would be of very low risk and thus never collect the risk premia we are intentionally and strategically seeking to collect over the long term. Nor is there any reliable way of predicting when such corrections will occur. We remain satisfied Dimensional’s approach to systematic fixed income investing is the best available to New Zealand investors at this time.
We also discussed the high allocation to Australia. In Dimensional’s similar mandates around the world there is generally not a maximum exposure to the locally domiciled bonds. In this case that is the Australian Dollar which is among the steepest yield curves available to the Trust. The unintended consequence for New Zealand investors is a large overweight to our trans-Tasman neighbours.
Although discussions of the strategy uncovered the less than perfect structure New Zealand investors receive which has contributed to underperformance during this quarter, the committee is ultimately satisfied the trust has at all times been invested within its investment guidelines and was taking mandated currency, security type and duration risk tilts. We accept the performance for the quarter ended 31 March 2022 and continue to recommend the fund as part of our supported model portfolios.
Disclaimer: The material contained in or attached to this report has been prepared based upon information that Consilium NZ Limited believes to be reliable, but may be subject to typographical or other errors. Consilium has taken every care in preparing this information, which is for client education purposes only. Although the data has been sourced from publicly available information and/or provided by the investment managers, we are not able to guarantee its accuracy. Past performance, whether actual or simulated, is no guarantee of future performance. This document does not disclose all the risks of any transaction type described herein, and the recipient should understand any terms including relevant risk factors and any legal, tax and accounting considerations applicable to them.
One or more of the author(s) of this report invest in the analysed security. The author(s) do not know of the existence of any conflicts of interest that might bias the content or publication of this report. Compensation of the author(s) of this report is not based on any outcome of this report.
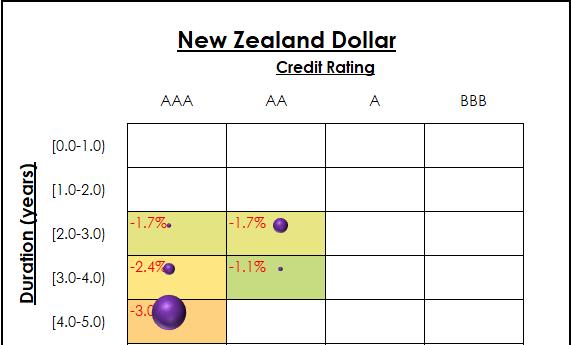
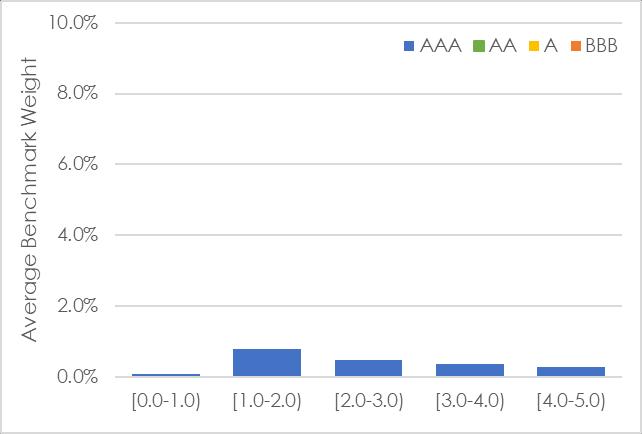
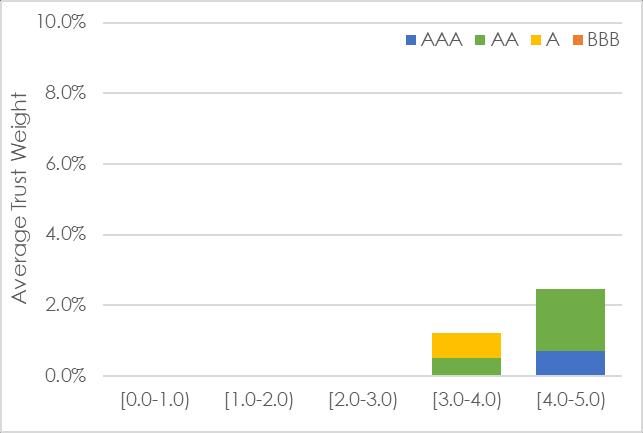
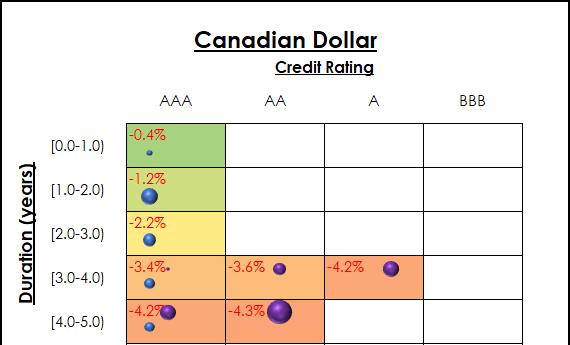
Appendix 2: Major currencies average trust and benchmark weights
United States Dollar: 2.16% underweight to the underperforming currency meant 2bps positive allocation attribution. Trust return within currency of -4.86% relative to -3.11% for benchmark meant -88bps negative compositional attribution.
Australian Dollar: 40.34% overweight to the underperforming currency meant -30bps negative allocation attribution. Trust return within currency of -4.33% relative to -2.99% for benchmark meant -55bps negative compositional attribution.
New Zealand Dollar: 4.80% overweight to the underperforming currency mean -2bps negative allocation attribution. Trust return within currency of -2.75% relative to 0.00% for benchmark meant -13bps negative compositional attribution.
Canadian Dollar: 1.65% overweight to the currency that performed as benchmark meant 0 bps of allocation attribution. Trust return within currency of -4.18% relative to -2.24% for benchmark meant -7bps negative compositional attribution.
Credit Rating Euro
Euro: 28.04 underweight to the outperforming currency meant -18bps negative allocation attribution. Trust does not allocate to this currency so no compositional attribution.


