
2 minute read
2022, Q2 Review

from CIC Yearbook 2022
by Consilium

On the July 2022 monthly adviser call, the Consilium Investment Committee reported on the second quarter of 2022. A summary is included below, and the graphics on the following pages are an excerpt of that presentation.
A full recording of this presentation is available on the Consilium Portal under ‘Quarterly Reporting’.
Advertisement
The impact of the war in the Ukraine and inflationary pressures from the lingering effect of the Covid-19 pandemic continued to weigh on capital markets. The United States entered a technical recession, however the labour market remained robust. Ultimately the repricing of securities in the face of higher interest rates and increased uncertainty weighed on markets and the June quarter in 2022 generally delivered significantly negative returns across the majority of asset classes.
Model portfolio returns ranged from -4.4% to -10.7% for the quarter, with aggressive portfolios losing more than defensive portfolios, and the SRI suite underperformed unscreened portfolios.
In equities, Emerging Market shares were the most resilient (albeit still negative) while New Zealand, Australian and Developed Market equities were all negative in the order of -10%. The NZD weakened, helping insulate losses on unhedged positions. Fixed interest was very negative across the board and the year-to-date figures are among the worst ever seen over a 6 month window.
Risk tilts were mixed across the quarter. The value factor was positive within Australia, Developed and Emerging Markets while large caps generally were more robust than small caps although profitability tilts generally helped. On the fixed income side, longer term bonds suffered more than short term and the credit premia were generally negative with credit spreads widening in the face of increased default risk.
The U S economy is contracting (US GDP has decreased both quarters of 2022)
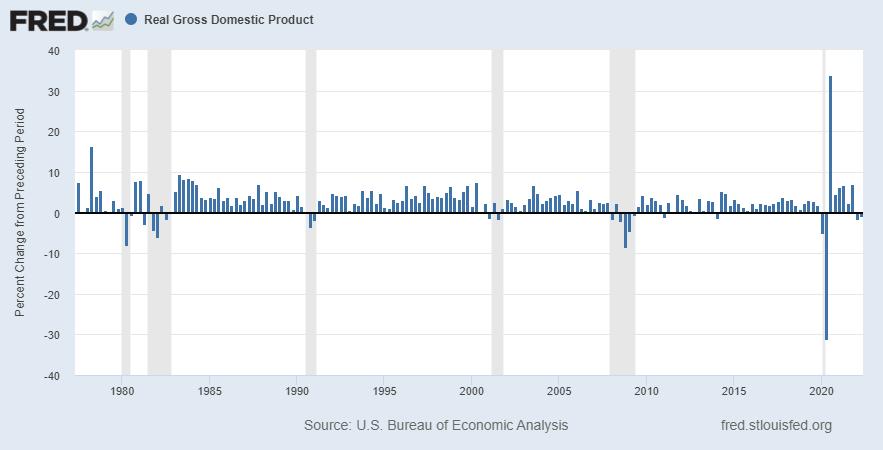
Source: U S Bureau of Economic Analysis, Real Gross Domest ic Product [A191RL1Q225SBEA], retrieved from FRED, Federal Reserve Bank of St Louis; https://fred stlouisfed org/series/A191RL1Q225SBEA
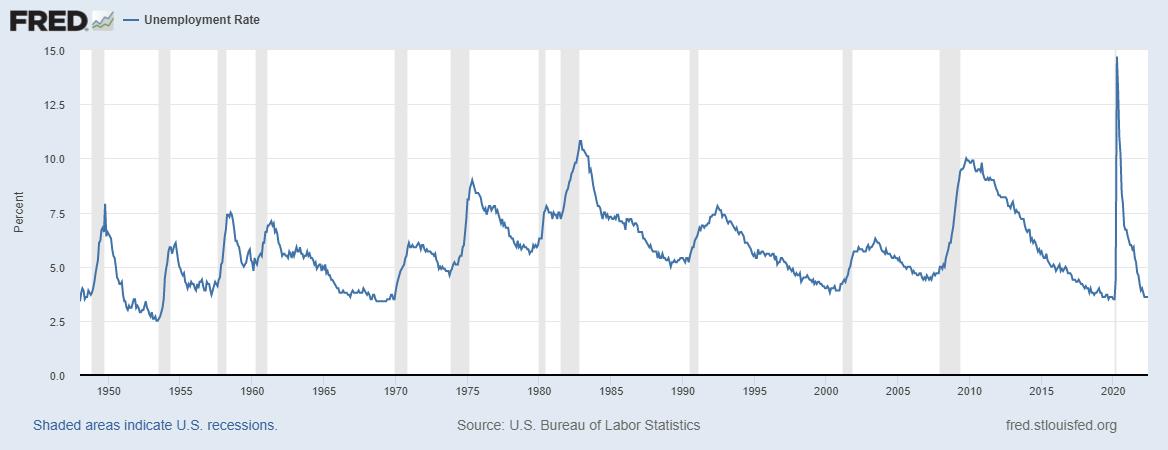
… but, Labour mark et stable
Source: U S Bureau of Labor St atistics, U nemployment Rat e [U NRATE], ret rieved from FRED, Federal Reserve Bank of St Louis; https://fred stlouisfed org/series/U NRATE
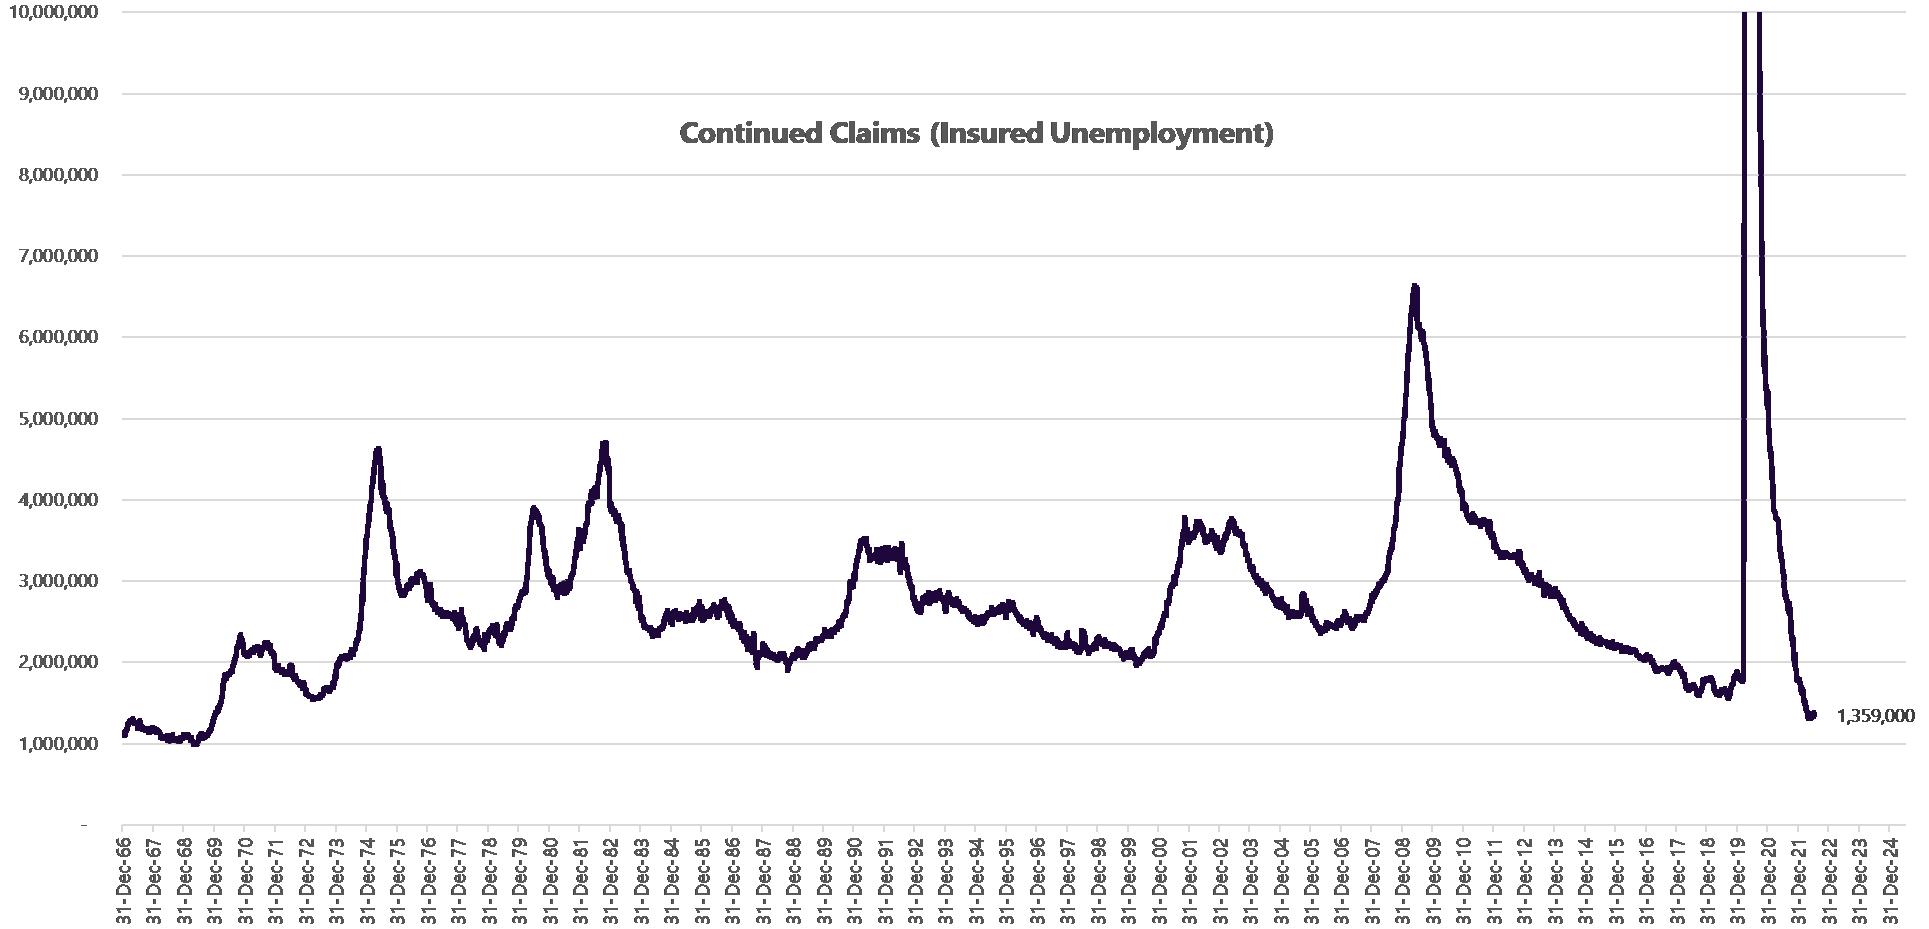
but, Labour mark et stable
Topped out at 23 1mil on 9-May-2020
Cont inued claims, also referred t o as insured unemployment , is t he number of people who have already filed an init ial claim a nd who have experienced a week of unemployment and t hen filed a cont inued claim t o claim benefits for t hat week of unemployment Cont inued claims dat a are based on t he week of unemployment , not t he week when t he init ial claim was filed
Source: U S Employment and Training Administ ration, Cont inued Claims (Insured U nemployment ) [CCSA], retrieved from FRED, Federal Res erve Bank of St Louis; https://fred stlouisfed org/series/CCSA, July 30, 2022
Monetary tightening cycle underway
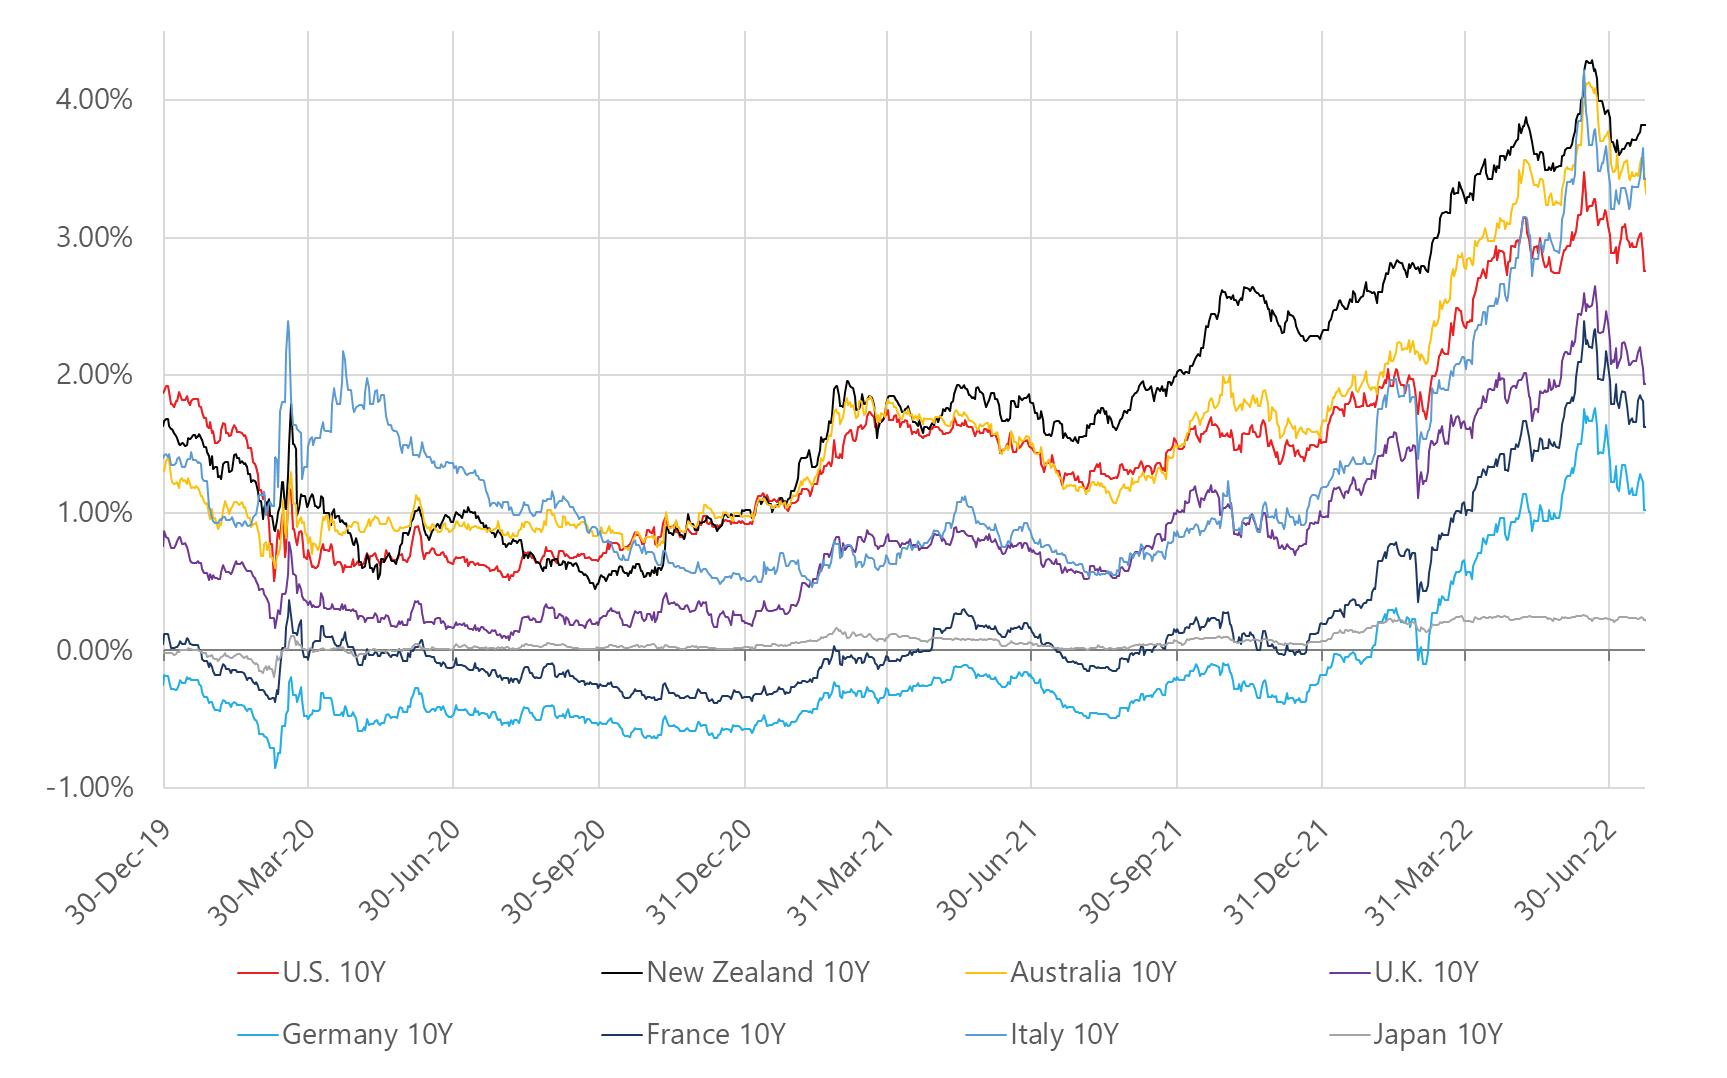
Yields sharply up for the quarter, up for the year

Retur
Increases lik e this not seen often, and off a far greater base Source
Other commodity prices well off highs
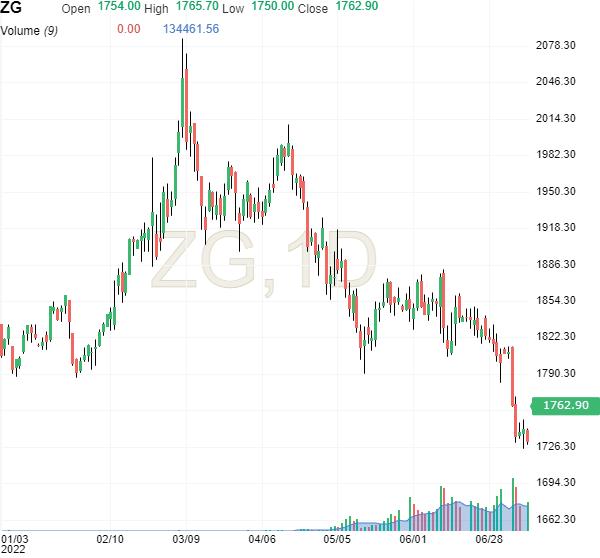
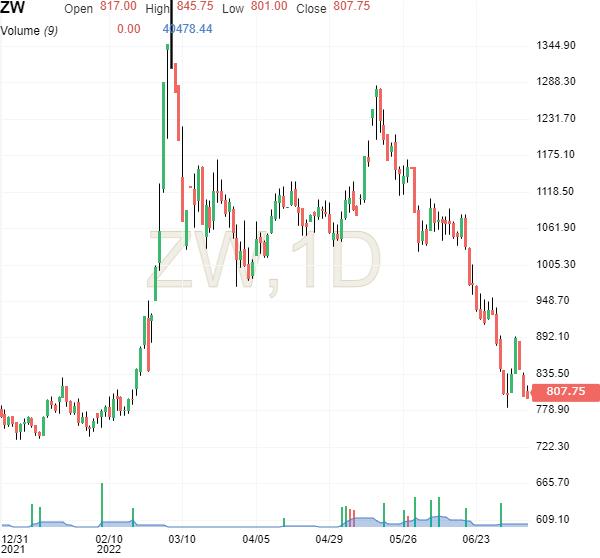
Wheat Gold
Source: Investing com
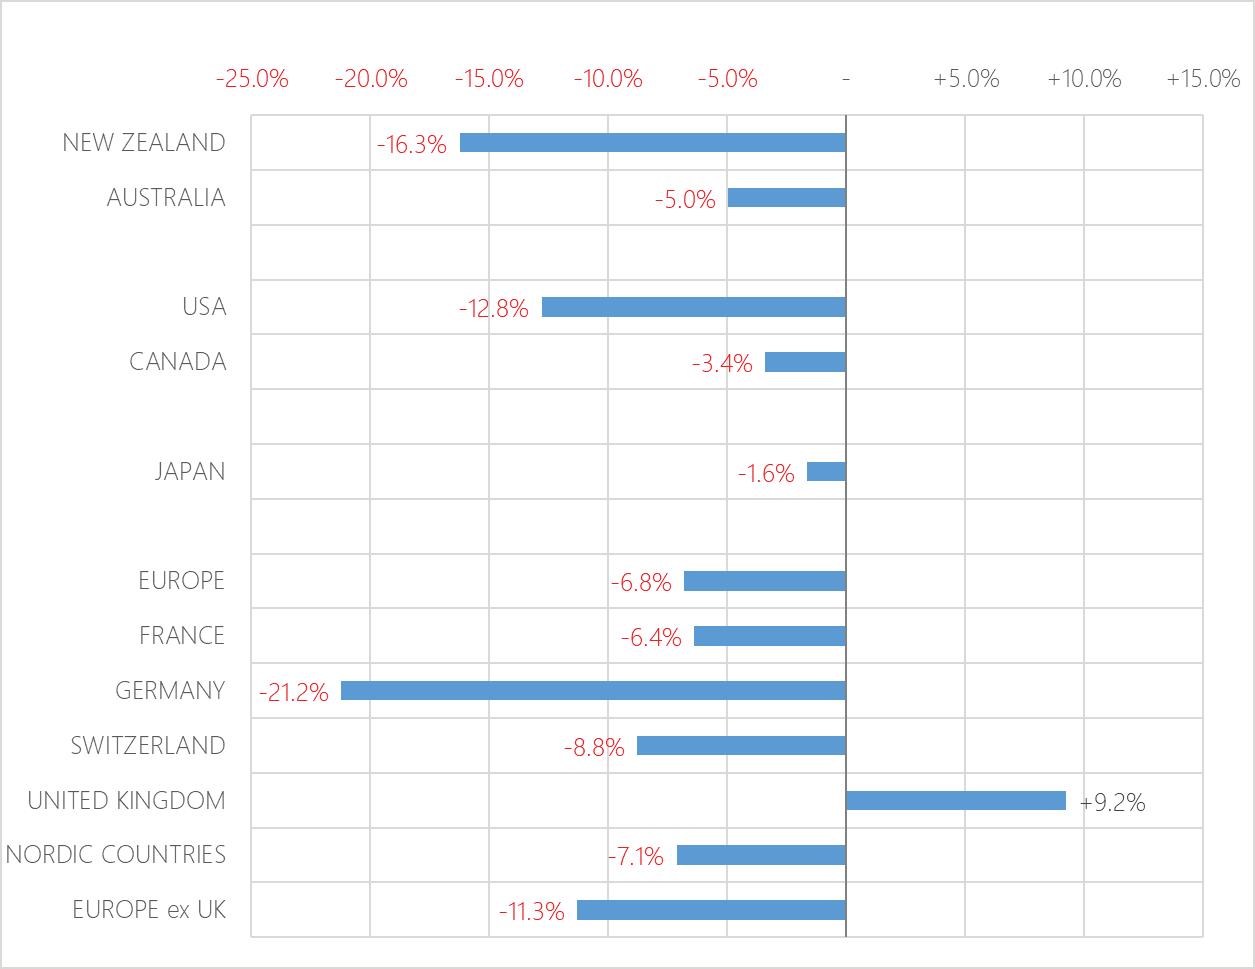
Devel oped m ar k ets per f or m ance (MSCI l arge cap i n di ces, l ocal cu r rency)
12 m on ths Q2 2022
Source: https://www msci com/end-of-day-data-country

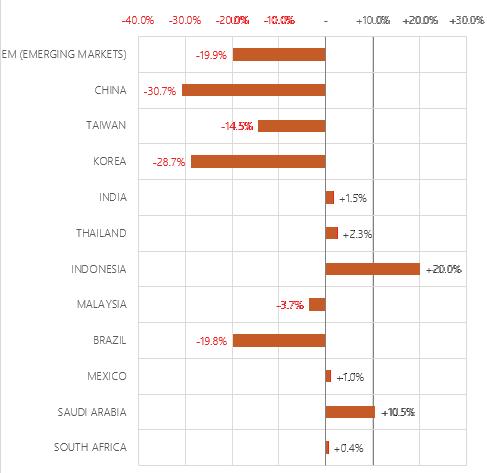
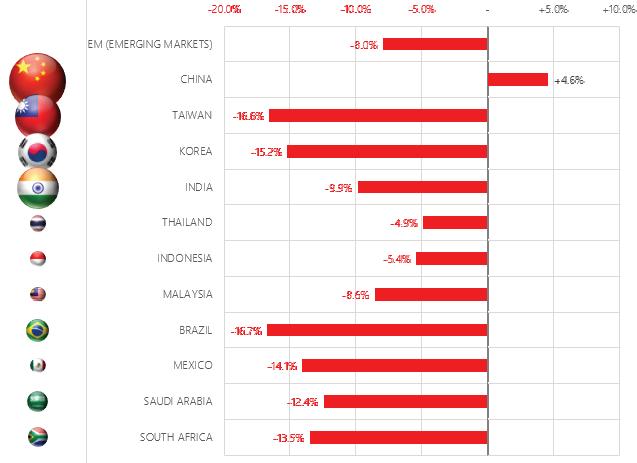
E m ergi ng m ar k ets per f or m ance (MSCI l arge cap i n di ces, l ocal cu r rency)
12 m on ths Q2 2022
Source: https://www msci com/end-of-day-data-country Relative flag sizes represent approximate exposure in model portfolios
S&P/NZX 50 Index (Gross)
MSCI World ex Australia Index (net div.)
1 January 1995 to 30 June 2022
MSCI World ex Australia Index (net div., hedged to NZD)
S&P/NZX A-Grade Corporate Bond Index
1 January 1995 to 30 June 2022


