3 minute read
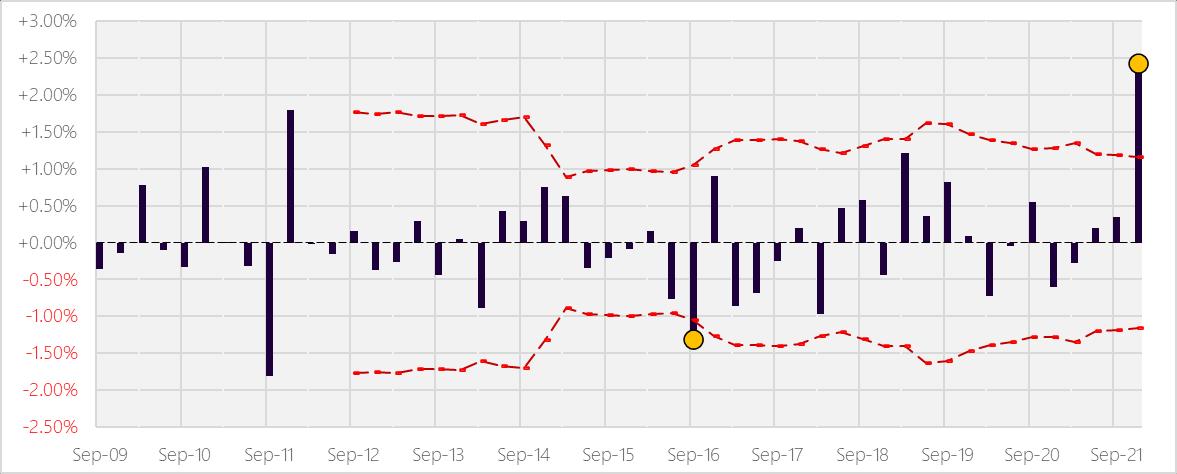
Tracking error chart

from CIC Yearbook 2022
by Consilium

Review of the investment mandate
The Dimensional product disclosure statement (PDS) applicable to Q1 2021 was dated 26 May 2020. The stated objective of the trust is:
Advertisement
The investment objective of the Trust is to provide long-term capital growth by gaining exposure to a diversified portfolio of securities associated with approved developed markets (excluding Australia), with increased exposure to small companies and Value Companies relative to a Market Capitalisation Weighted portfolio.
The Trust is not managed with the objective of achieving a particular return relative to a benchmark index. However, to compare the performance of the Trust with a broad measure of market performance, reference may be made to the MSCI World ex Australia Index (net div.), (for unhedged class units), net div., hedged to AUD (for AUD class units), or net div., hedged to NZD (for NZD class units).
The CIC has frequent dialogue with the fund manager, and we are satisfied there has been no change to the strategy/mandate without our knowledge.
Investigation with the fund management team
The trusts performance commentary (NZD class) for the prior 12 months states:
The trust returned 30.6% over the year, leading the MSCI World ex Australia Index by 1.0%. The portfolio’s emphasis on value stocks, particularly small cap value stocks, drove outperformance.
Global equities had a strong year, with the MSCI All Country World IMI Index rising 25% in 2021. Compared to 2020, equity investors had a fairly smooth ride in 2021. The standard deviation of returns was just 7% compared to over 15% in 2020. Headline themes in 2021 included meme stocks, economic reopening, inflation, and new regulations and priorities from Chinese authorities. Australian stocks returned 17.5% for the year, outperforming emerging markets, but underperforming other developed markets. Globally, small caps lost to large caps, but value beat growth, and stocks with high profitability outperformed those with low profitability.
The interaction of premiums was particularly impactful this year. While small caps underperformed large caps, the underperformance was driven by poor returns to small cap growth stocks with low profitability. Small value stocks and small cap stocks with high profitability generally outperformed their growth and low profitability counterparts, benefitting the Dimensional portfolios invested in small caps. The portfolio was overweight small cap value stocks by 13%. These stocks were the best performers in developed markets ex Australia and returned 32.3% for the year. The portfolio also held greater weight than the index in small cap growth stocks, which underperformed the index overall. However, the performance of small cap value stocks dominated, and the portfolio outperformed.
Attribution Analysis
–
Source: Dimensional Fund Advisors and Consilium calculations
*Relative to the total index return of +8.70%
Allocation attribution by size finds a cumulative impact of -137bps against the market benchmark
Source: Dimensional Fund Advisors and Consilium calculations
*Relative to the total index return of +8.70%
Allocation attribution by price to book (value tilt) finds a cumulative impact of -65bps against the market benchmark.
Analysis of risk exposure
Figure 2 – Aggregate price to book ratio of trust and benchmark
DFA Global Core Equity Trust NZD Hedged Class MSCI World ex Australia Index (net div., hedged to NZD)
Source: Consilium
Figure 3 – Aggregate price to book ratio of trust relative to benchmark
Source: Consilium
The Aggregate price to book ratio of trust has been consistently 15%-25% less expensive relative to benchmark and we are satisfied the degree of the value tilt is still consistent.
Weighted average total market capitalisation (NZD million) of trust and benchmark
The weighted average total market capitalisation of trust has historically been 30-50% smaller than the MSCI index, however since the start of 2020 this metric has been less negative, more consistently registering around -30%. Given the performance of small companies were poor through the quarter, a reduced exposure helped relative outperformance and contributed to this EDD flag.
This observation represents a reduction in the level of the size tilt within the trust which began in 2020 when the trust started implementing the reinvestment factor, a change we reviewed and accepted at the time. The missing step however has been modification of the custom benchmark to reflect this change in the level of small company exposure. Now we have enough observations to measure this reduced small company exposure we will implement a modified custom benchmark in time for Q2 2022 monitoring.
Disclaimer: The material contained in or attached to this report has been prepared based upon information that Consilium NZ Limited believes to be reliable but may be subject to typographical or other errors. Consilium has taken every care in preparing this information, which is for client education purposes only. Although the data has been sourced from publicly available information and/or provided by the investment managers, we are not able to guarantee its accuracy. Past performance, whether actual or simulated, is no guarantee of future performance. This document does not disclose all the risks of any transaction type described herein, and the recipient should understand any terms including relevant risk factors and any legal, tax and accounting considerations applicable to them.
One or more of the authors of this report invest in the analysed security. The author(s) do not know of the existence of any conflicts of interest that might bias the content or publication of this report. Compensation of the author(s) of this report is not based on any outcome of this report.


