9 minute read
Appendix: Supporting analysis

from CIC Yearbook 2022
by Consilium

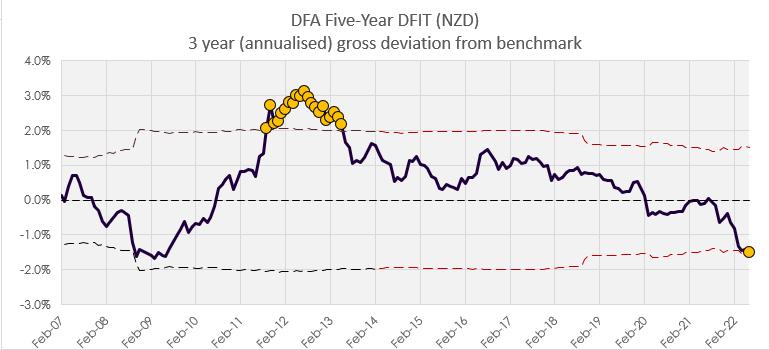
Tracking error chart
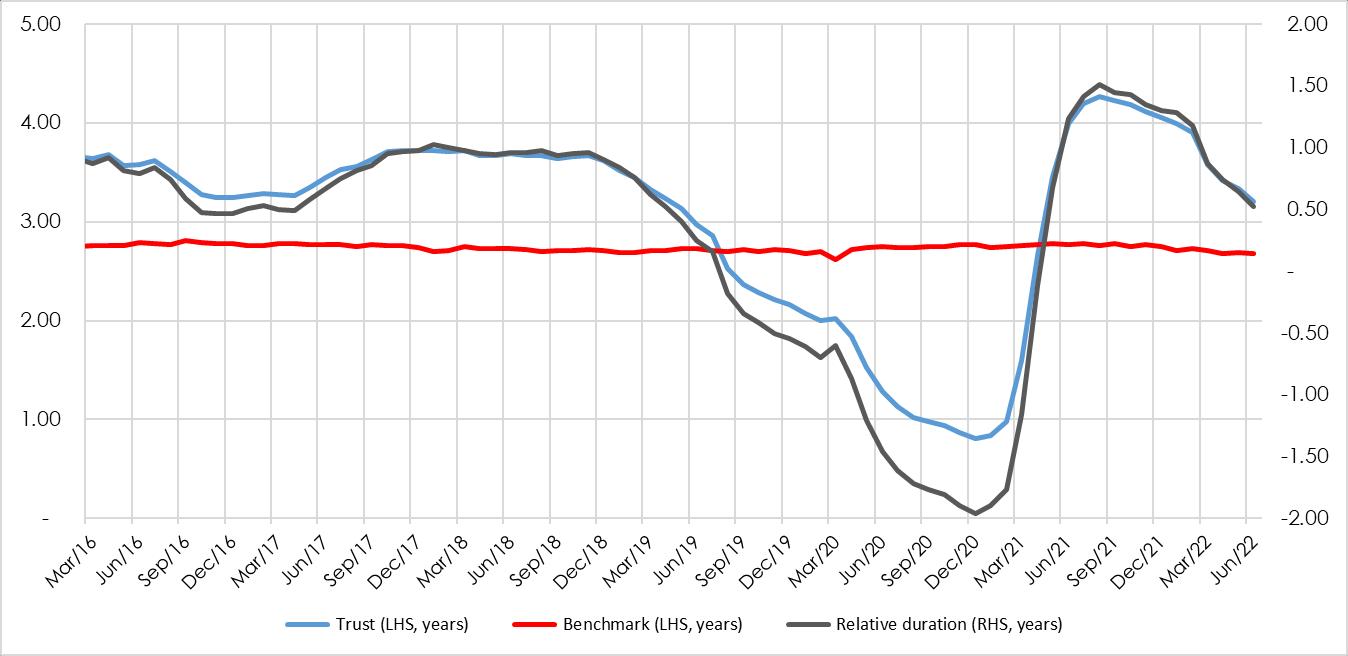
Figure 1 – 3 year deviation from benchmark
Advertisement
Source: Consilium
Source: Consilium
Review of the investment mandate
The Dimensional product disclosure statement (PDS) applicable to Q2 2022 was dated 26 May 2020. The stated objective of the trust is:
Within the risk constraints of investing in eligible short to intermediate-term, high credit quality instruments, the objective of the Trust is to maximise the return of a broadly diversified portfolio of domestic and global fixed interest and money market securities.
The Trust is not managed with the objective of achieving a particular return relative to a benchmark index. However, to compare the performance of the Trust with a cash index, reference may be made to the Bloomberg AusBond Bank Bill Index (AUD class units) or the Bloomberg NZBond Bank Bill Index (NZD class units).
Investors should note that the index is referred to for comparison purposes only. The index is not intended to represent the current or targeted asset allocation of the Trust. The performance of the Trust may differ significantly from the index.
The Trust may suit those investors seeking a liquid, low risk, diversified portfolio that provides exposure to the returns of short to intermediate-term domestic and global fixed interest securities.
Dimensional’s fixed interest portfolios are based on dimensions of expected returns that have been identified by academic research. Relative performance in fixed interest is largely driven by two dimensions: bond maturity and credit quality. Bonds that mature further in the future are subject to higher risk of unexpected changes in interest rates. Bonds with lower credit quality are subject to higher risk of default. Extending bond maturities and reducing credit quality increases potential returns.
Ordinarily the Trust invests in a diverse portfolio of high credit quality, domestic and global fixed interest and money market securities, with a maximum maturity of five years from the date of settlement.
In making purchase decisions, if the anticipated term premium is greater for longer-term securities in the eligible maturity range, Dimensional will generally seek to focus investment in that longer-term area, otherwise, Dimensional will generally seek to focus investment in short to intermediate-term securities.
The CIC has frequent dialogue with the fund manager, and we are satisfied there has been no change to the strategy/mandate without our knowledge.
It should be noted that although Dimensional has referenced the cash index we elect to use the FTSE World Government Bond Index 1-5 Years (hedged to NZD) which better reflects the average duration risk and the investment universe of the fund better than cash does.
Attribution analysis
Due to the volatile events over the past 3 years, fixed income funds experienced a wide dispersion of returns and even a modest over or underweight will have had a material impact on relative performance. Due to this volatile period being the dominant source of underperformance our analysis will be focussed on the 12 months ended 30 June 2022
The following attribution analysis of the trust versus the benchmark show us where the differences in exposure lie and where the sources of performance were
Analysis 1a - attribution analysis by security type and credit rating
Table 1 – Allocation Attribution by security type for trust relative to benchmark, Q3 2021 - Q2 2022
Allocation by security type accounts for an aggregate -51bps of relative fund underperformance
We observe that the trusts relative overweighting to Corporate Bonds lead to -0.57% of allocation underperformance
Analysis 1b - attribution analysis by duration
Table 2 – Allocation Attribution by duration for trust relative to benchmark, Q3 2021 - Q2 2022
The aggregate allocation by duration attributed -180bps of relative fund underperformance.
The trust held bonds of longer average duration than the benchmark over the past year (average weighted average duration of 3.87 years vs 2.73 years) and we see the relative positioning in aggregate detracted from the performance through the period The result is consistent with Dimensional’s fund commentary highlighting a steepening of the short-term yield curve throughout the year and a flattening of the intermediate to long-term yield curve
Analysis 1c - attribution analysis by currency
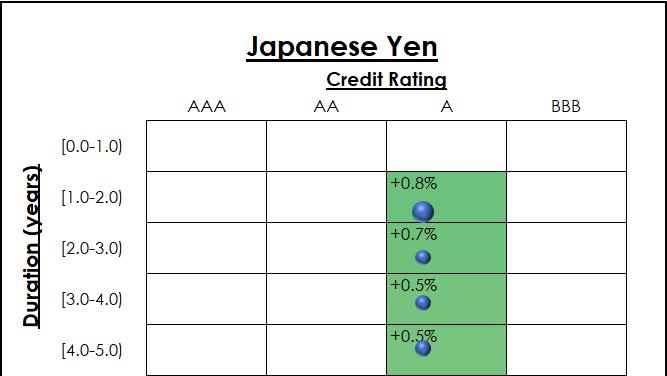
Currencies experienced reasonable dispersion of average returns, driven by each currency group’s make up (duration and quality) throughout the period. The Japanese Yen is the standout over the period, helped by the Bank of Japan’s unwavering commitment to keeping interest rates low while their monetary counterparts around the globe have undergone the fastest tightening cycle in recent history.
Table 3 –Allocation Attribution by currency for trust relative to benchmark, Q3 2021 - Q2 2022
Data source: Dimensional Fund Advisors and Consilium calculations
In aggregate, attribution by currency resulted in -138bps of underperformance relative to the benchmark.
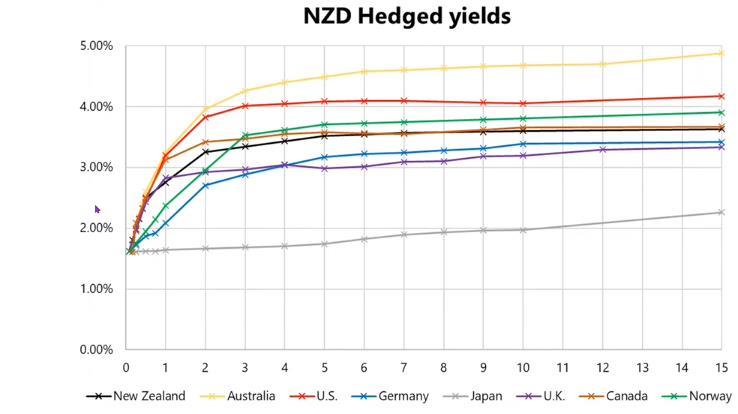
Dimensional have consistently communicated they expected AUD, CAD, NZD and USD to exhibit the highest currency-hedged expected returns globally, as evidenced by the positioning in table 3 This expectation is consistent with markets as illustrated by figure 3 below.
Data source: Dimensional Fund Advisors and Consilium calculations
Data source: Dimensional Fund Advisors and Consilium calculations
The compositional attribution by currency highlights sources of relative underperformance within currency allocation As the trust intentionally allocates higher relative weights to securities with steeper yield curves to capture greater yield and harness the higher expected roll down return, it will exhibit relative differences in currency allocations, credit profile, and duration
Table 6 provides insight into the primary sources of underperformance exhibited by the strategy over the analysis period
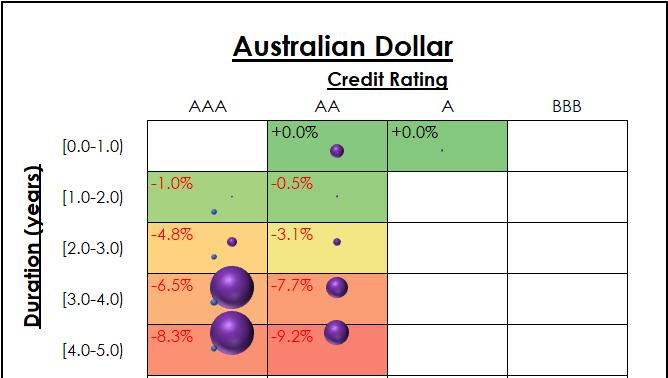
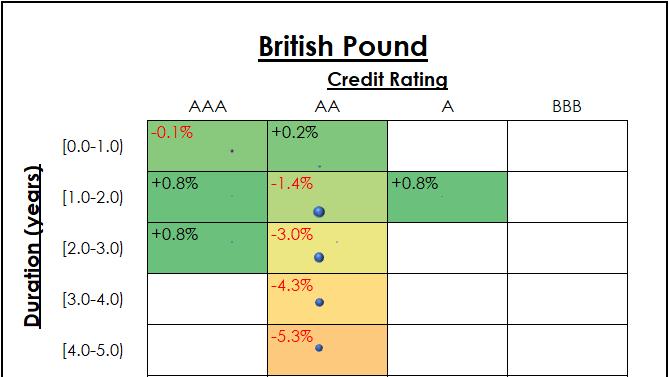
The following analysis and example help to further highlight the strategies current positioning and depicts the trusts full relative holdings of USD bonds. Figure 4 shows us the average weight by credit rating (the columns) and by duration of the underlying bond (the rows) for the benchmark (the blue bubbles, bigger bubbles mean larger allocations), and the trust (purple bubbles). These are presented across a matrix of returns for each segment
By looking across the whole matrix, we see a high density of the trust’s allocation to poor performing bonds with relatively longer duration. The benchmark on the other hand has a higher density of allocations to relatively better performing bonds of shorter duration, accordingly, for Q3 2021 - Q2 2022, the trusts relative USD positions were a source of underperformance.
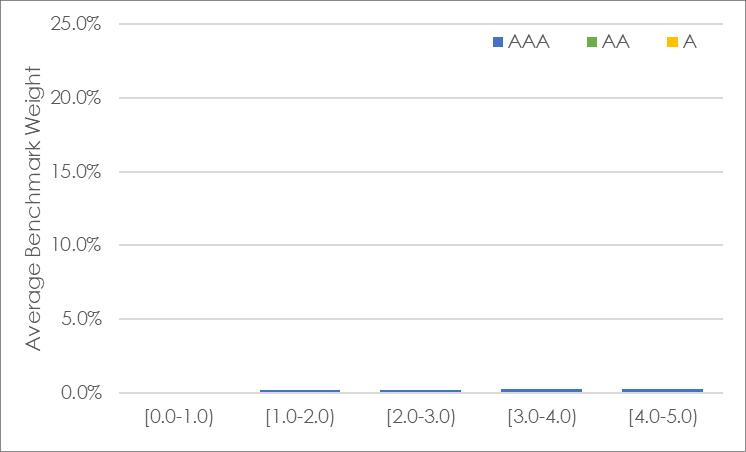
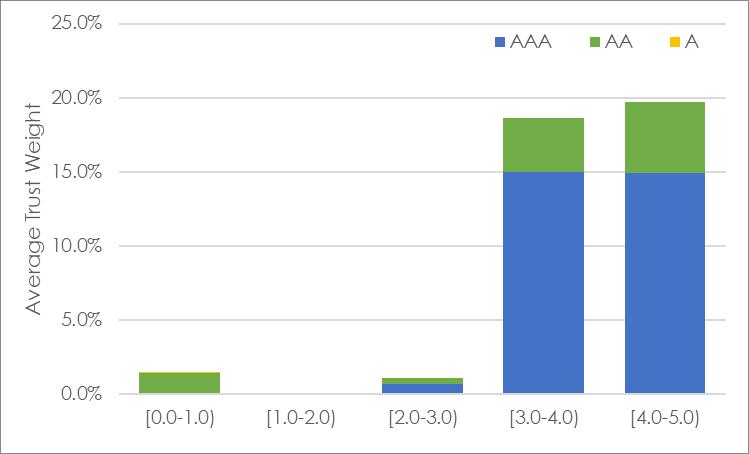
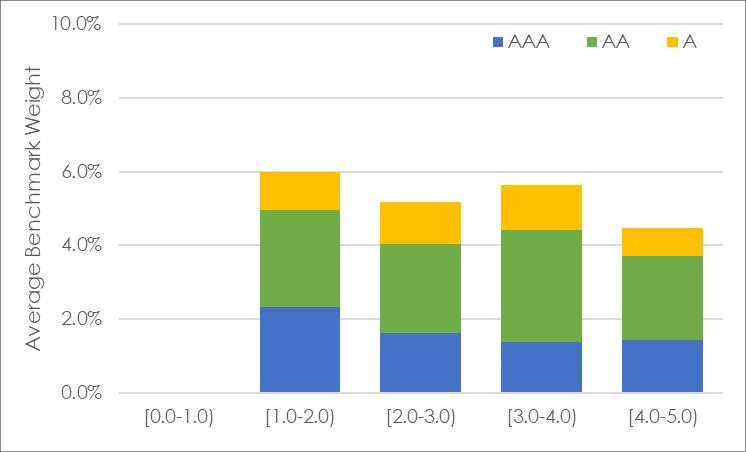
Figure 5 presents these average exposures again and further highlights the difference in composition of USD exposure. The benchmark takes a large exposure across the currency group, with density in the 1-3 year region, while the trust has less duration diversification exposure. We also observe the benchmark only allocated to quality AA bonds (specifically US treasuries)

This particular analysis highlights the significant difference between how exposure can be taken within the currency allocations, further snapshots by currency are presented in Appendix 2 below
Data source for both figures: Dimensional Fund Advisors and Consilium calculations
Overall, the attribution analysis section has identified that the underperformance during the one year period has contributed significantly to the three year performance flag. The underperformance is also able to be explained by the trust’s higher relative exposure to corporate bonds, higher exposure to the steepest yield curves, and compositional duration and credit differences within each currency allocation. However, understanding the sources of relative underperformance is only the first part of the EDD, the second part is to ascertain whether the trust consistently operated within its mandate during the three years ended 30 June 2022


Analysis 2: Analysis of risk exposure
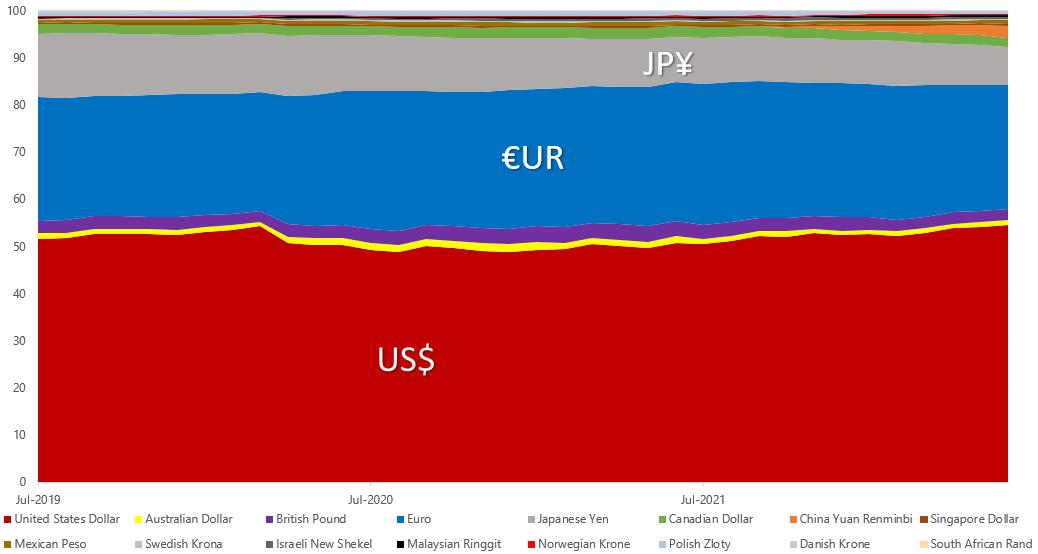
First, we look at the historical relative exposures of currency between the trust and index
Figure 6
Historical relative exposure of trust versus benchmark by currency
Data source: Dimensional Fund Advisors, FTSE
We note that the relative overweights/underweights have experienced significant variation over the historical observations, specifically the variation in relative AUD (yellow dashed line), EUR (grey line) and USD exposures (green dashed line)

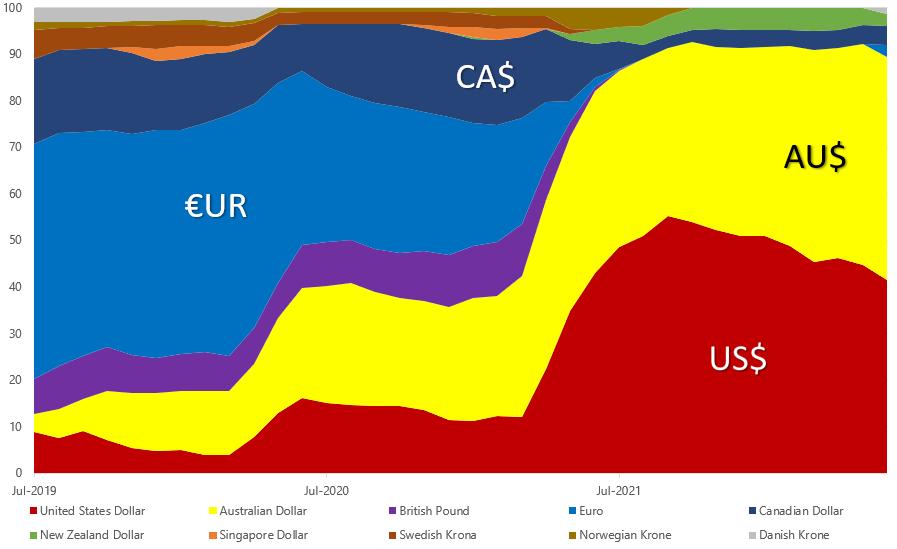
Figure 7 illustrates Dimensional’s aggressiveness in positioning where they expect the highest returns, which shown, results in far more variable exposure of the trust as per its strategy, sitting in stark contrast to the stability of the benchmarks currency exposure.
With Dimensional we discussed the high allocation to Australia and similar to other mandates managed by Dimensional around the world there is generally not a maximum exposure to the locally domiciled bonds. In this case that is the Australian Dollar which is among the steepest yield curves available to the trust. The unintended consequence for New Zealand investors is a large overweight to our trans-Tasman neighbours
Dimensional have also confirmed the trust has no relative limits for either, currency or issuing country, given the use of a cash benchmark. Rather, the absolute limits are a 75% maximum to the USD yield curve, a 50% maximum limit to the Euro, and 30% max to JPY and 25% max to GBP, CAD. For smaller markets like Singapore, New Zealand and other European curves like the Swedish Krone there is a 10% portfolio limit. We note that Chinese securities are not eligible. Dimensional’s variable maturity strategies allow up to 100% in the base currency of the account which means there is no limit on the trust’s allocation to Australian dollar securities
Checking these limits versus the exposure levels provided, the committee is satisfied the trust was invested within its investment guidelines and there was no persistent relative exposure by currency that was precluded by the fund mandate
Next, we look at credit risk. The historical relative exposures by security type are summarised below in figure 8, followed by the relative exposures by credit rating in figure 9
Data source: Dimensional Fund Advisors
Data source: Dimensional Fund Advisors
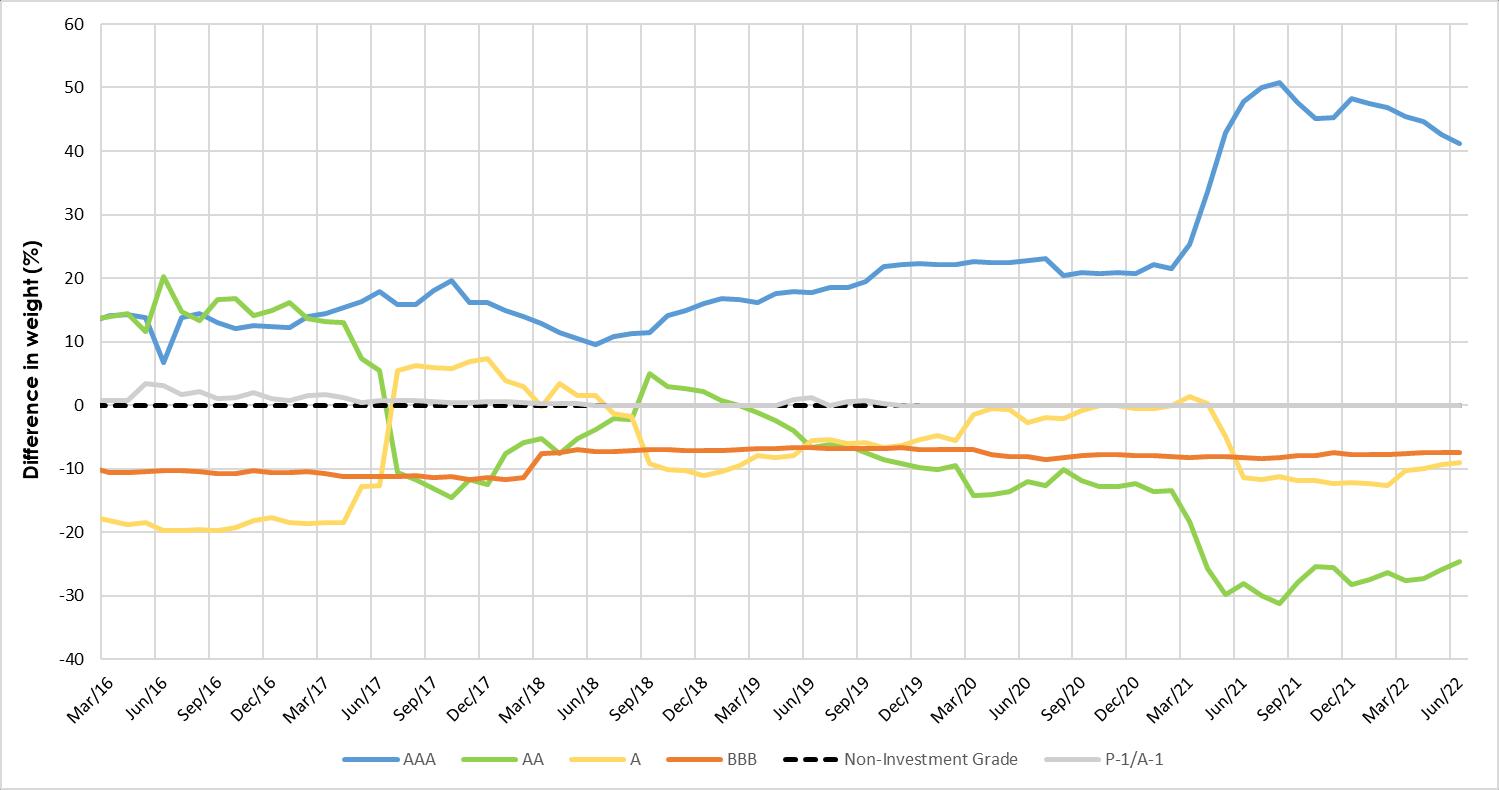
We observe a persistent overweight to corporate bonds being achieved through an underweight to government bonds. We also observe an overweight to AAA bonds achieved by underweighting to all other investment grade bonds This chart does not illustrate it, but we can confirm the trust has not taken any exposure to bonds rated below A as per its mandate
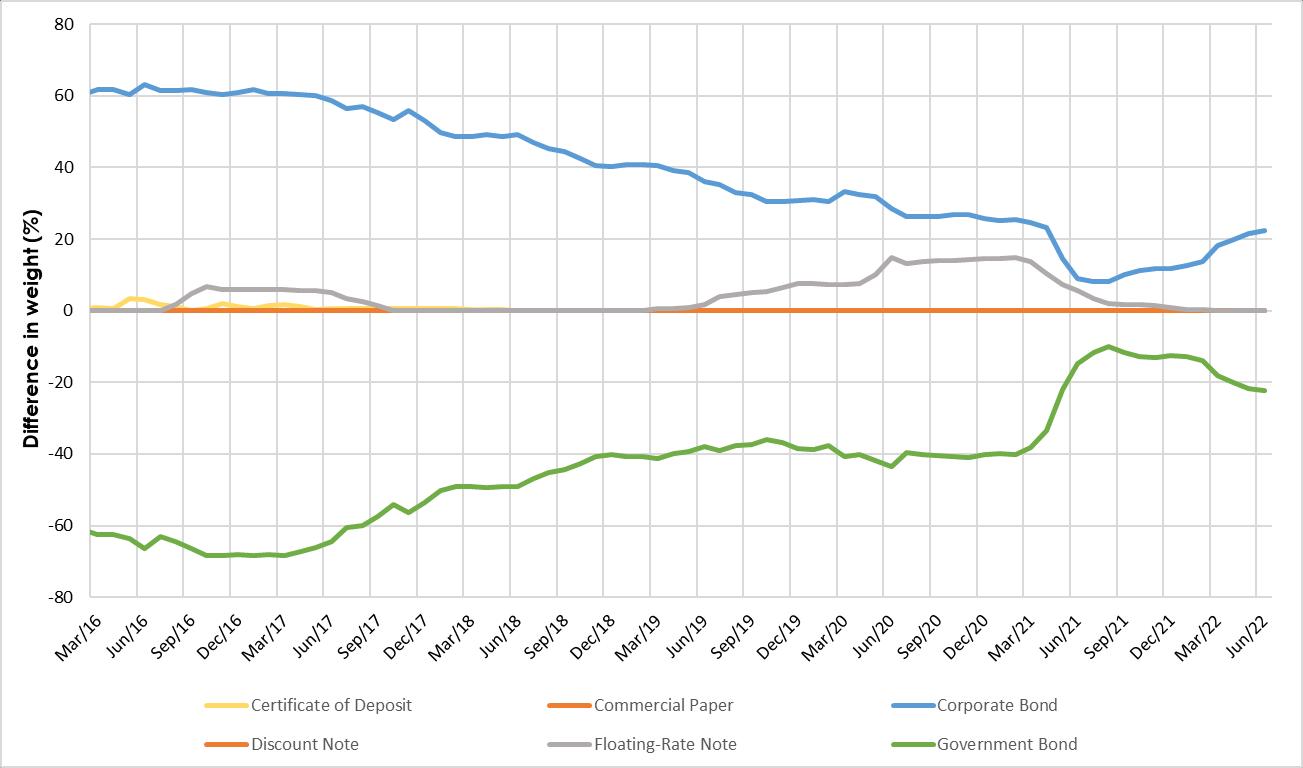
The three-year relative positioning of security type has been relatively consistent, and we are now seeing a slight uptick back in weighting to corporate bonds over the analysed period which has been a driver of underperformance.
The three-year relative positioning of the trusts credit rating has varied considerable from the previous years of relatively stable exposure. The uptick in positioning to AAA bonds beginning in March 2021 has been a material driver of underperformance
The committee finds no evidence of unacceptable exposure, although we do note its current exposures are among the most extreme relative to historical observations (in particular the USD and AAA overweights) in response to the current environment.
The historical duration is summarised below.
Figure 10 - Historical duration of trust versus benchmark
Data source: Dimensional Fund Advisors
Figure 10 shows the trust has consistently been below its mandated maximum duration of 5 years
The CIC notes that the relative exposure is consistent with the trust’s strategy, which is to reduce duration exposure as yield curves flatten. However, during the previous two years, the trust’s strategy has led it to take unfortunate duration positioning. It decreased duration in 2019 and so missed out the benefits of the surprise rate cuts and yield compression following the outbreak of COVID-19. Subsequently, the trust has increased duration before the negative impacts of a faster than expected interest rate hike cycle during 2022
Although discussions of the strategy uncovered the less than perfect structure New Zealand investors receive which has contributed to underperformance during the three-year period, the committee is ultimately satisfied the trust has at all times been invested within its investment guidelines and was taking mandated currency, security type and duration risk tilts We remain satisfied Dimensional’s approach to systematic fixed income investing is the best available to New Zealand investors at this time and we accept the performance for the three years ended 30 June 2022 and continue to recommend the fund as part of our supported model portfolios.
Disclaimer: The material contained in or attached to this report has been prepared based upon information that Consilium NZ Limited believes to be reliable, but may be subject to typographical or other errors. Consilium has taken every care in preparing this information, which is for client education purposes only. Although the data has been sourced from publicly available information and/or provided by the investment managers, we are not able to guarantee its accuracy. Past performance, whether actual or simulated, is no guarantee of future performance. This document does not disclose all the risks of any transaction type described herein, and the recipient should understand any terms including relevant risk factors and any legal, tax and accounting considerations applicable to them.
One or more of the author(s) of this report invest in the analysed security. The author(s) do not know of the existence of any conflicts of interest that might bias the content or publication of this report. Compensation of the author(s) of this report is not based on any outcome of this report.
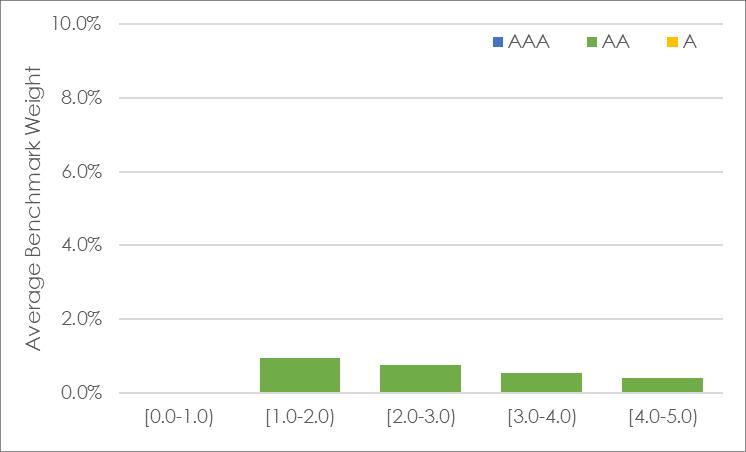
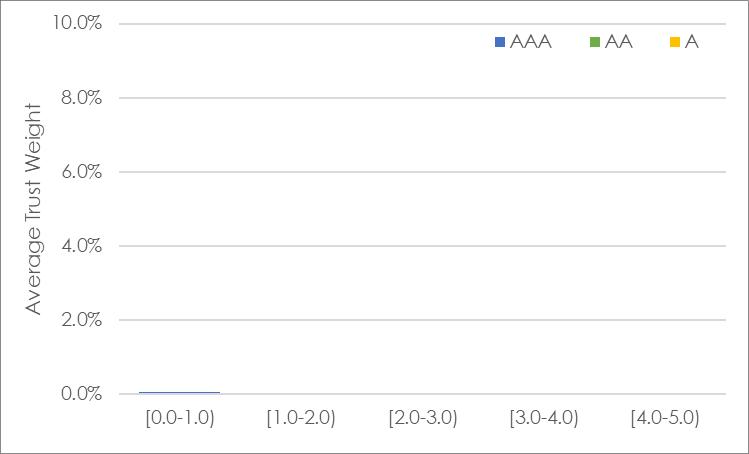
Appendix 2: Major currencies average trust and benchmark weights
United States Dollar: 3.07% underweight to the underperforming currency meant 3bps positive allocation attribution. Trust return within currency of -7.11% relative to -4.43% for benchmark meant -132bps negative compositional attribution.
Australian Dollar: 39.89% overweight to the underperforming currency meant -73bps negative allocation attribution. Trust return within currency of -7.63% relative to -5.38% for benchmark meant -92bps negative compositional attribution.
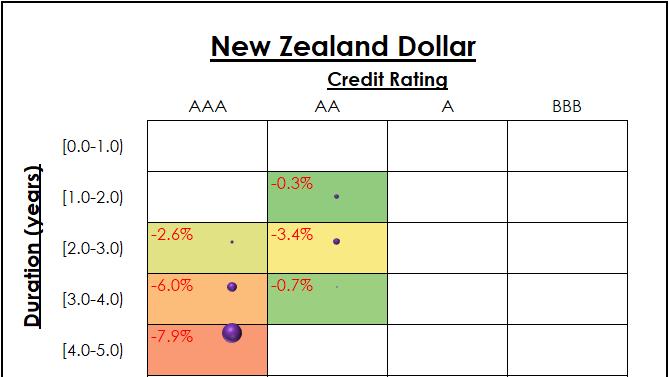
New Zealand Dollar: 4.32% overweight to the underperforming currency meant -17bps negative allocation attribution. Benchmark does not allocate to this currency so no compositional attribution.

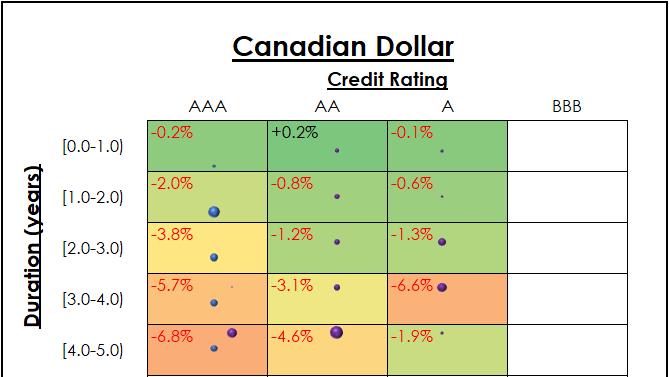
Canadian Dollar: 1.93% overweight to the underperforming currency meant 0 bps of allocation attribution. Trust return within currency of -6.00% relative to -3.64% for benchmark meant -10bps negative compositional attribution.


Euro: 28 31% underweight to the outperforming currency meant -13bps negative allocation attribution. Trust return within currency of 0.64% relative to -3.07% for benchmark meant 1 bp of positive compositional attribution.
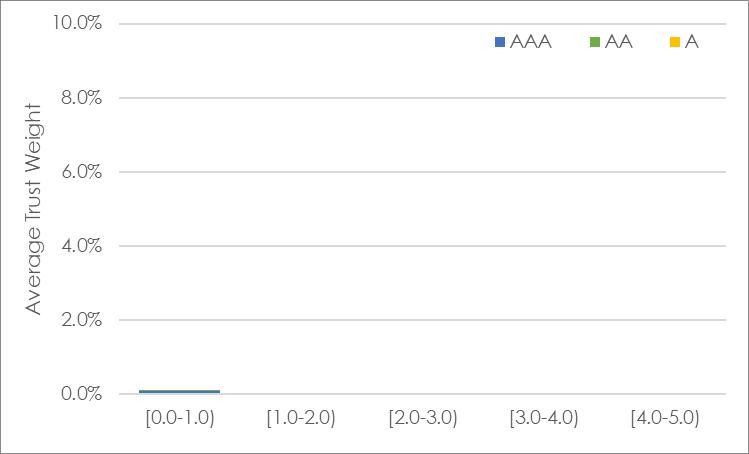

British Pound: 2.61% underweight to the outperforming currency meant -1 bp of negative allocation attribution. Trust return within currency of 0.34% relative to -3.01% for benchmark meant 0 bps positive compositional attribution.
Japanese Yen: 9.29% underweight to the outperforming currency meant -39bps negative allocation attribution. Trust does not allocate to this currency so no compositional attribution.