4 minute read
Appendix: Supporting analysis

from CIC Yearbook 2022
by Consilium

Custom benchmark
The style benchmark used to measure this trust’s expected quarterly returns is a custom index created by the CIC. This custom index includes consideration of the expected risk tilts from this trust rather than just a broad market return which was assumed when previously using the MSCI World ex Australia Index (net Div, NZD)
Advertisement
The factor exposures to construct the custom index have been evaluated from a multiple regression performed in May 2020. For this trust, the custom index is specified in table 1 below
Factor Factor loading Factor definition Notes
Risk Free 1.00x
Ken French Risk Free Rate
Market 1.00x Ken French Market factor minus Ken French Risk Free Rate
Size 0.15x
Value 0.15x
Profitability nil
Ken French Developed Market Size Factor
Ken French Developed Market Value Factor
Source: Consilium calculations, Ken French Five Factor Model
This is the average return on the three Ken French small portfolios minus the average return on the three Ken French big portfolios.
This is the average return on the two Ken French value portfolios minus the average return on the two Ken French growth portfolios.
Using a custom index for attribution analysis or analysis of relative fundamentals such as aggregate price to book or weighted average market capitalisation poses a difficulty. As the custom index is not maintained by an index provider there is no average underlying company exposures for the custom index and so attribution analysis or analysis of relative fundamentals is impossible.
When performing these analyses, we instead employ the closest benchmark available for which these analyses can be completed. For this trust that is the MSCI World ex Australia Index (net div, NZD).
Review of the investment mandate
The Dimensional product disclosure statement (PDS) applicable to Q1 2022 was dated 26 May 2020. The stated objective of the trust is:
The investment objective of the Trust is to provide long-term capital growth by gaining exposure to a diversified portfolio of securities associated with approved developed markets (excluding Australia), with increased emphasis on higher expected return securities, and adjusted to take into account certain environmental and sustainability impact and social considerations.
The Trust is not managed with the objective of achieving a particular return relative to a benchmark index. However, to compare the performance of the Trust with a broad measure of market performance, reference may be made to the MSCI World ex Australia Index (net div.) hedged to NZD
The CIC has frequent dialogue with the fund manager, and we are satisfied there has been no change to the strategy/mandate without our knowledge.
Investigation with the fund management team
Commentary from Dimensional in relation to the quarterly performance of the unhedged trust was as follows:
The trust returned -10.0% for the quarter, lagging the MSCI World ex Australia Index by 1.6%. A positive value premium benefitted performance, but the emphasis on low-emissions companies offset this benefit and drove underperformance.
Globally, equities fell in the first quarter with the MSCI All Country World IMI Index dropping 8%. Russia’s invasion of Ukraine provoked consequences from governments and financial markets. Meanwhile, crude oil spiked and energy stocks rose 19%. While equities fell broadly, value stocks outperformed, with the MSCI All Country World IMI Value Index beating the growth index by 9%. Low profitability growth stocks were particularly hard hit. Despite a negative size premium, value stocks offered some respite for small cap investors as value paid off within small caps as it did within large caps.
The portfolio was overweight value stocks by 10%, which contributed to relative performance, as value stocks outperformed growth stocks in non-Australian developed markets. The portfolio was underweight growth stocks like Shopify, which returned -52% and underperformed the overall market. However, the exclusion of high-emitting companies detracted from performance; for example, the portfolio excluded Exxon Mobil, which returned 32%. A negative size premium was also a headwind to relative performance, and the profitability premium was mixed. Ultimately, the portfolio’s sustainability considerations dominated the positive value premium and the portfolio underperformed.
Attribution Analysis
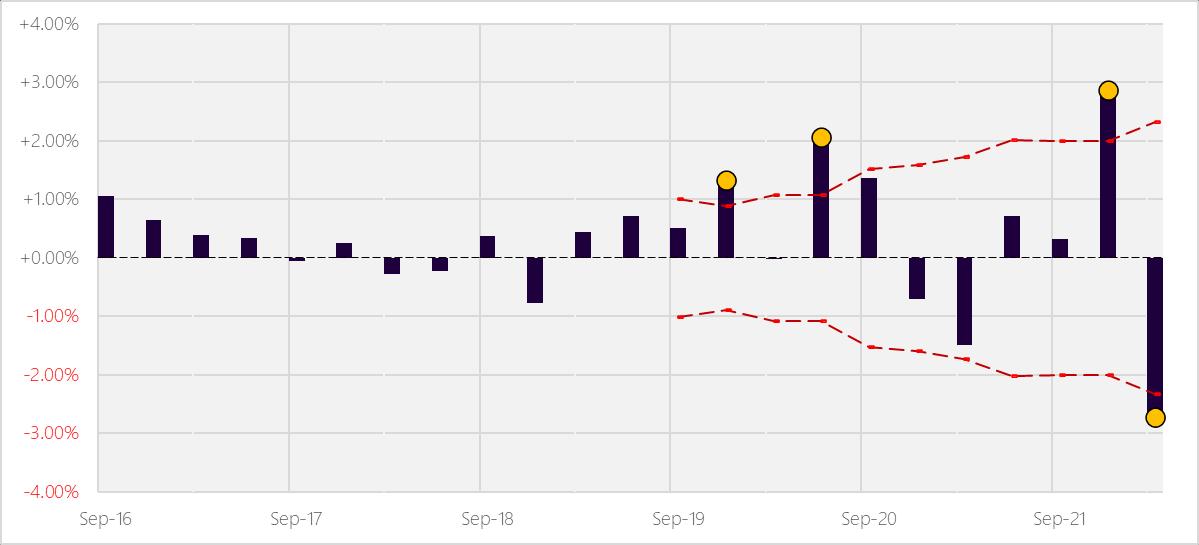
The allocation attribution of selected industries shows a cumulative impact of -77bps This is consistent with Dimensional’s fund commentary highlighting a negative contribution due to sustainability considerations
The allocation attribution by size finds a cumulative impact of -62bps This is consistent with Dimensional’s fund commentary highlighting a negative contribution due to the size premium.
The allocation attribution by book to market ratio shows a cumulative impact of +72bps. This is consistent with Dimensional’s fund commentary highlighting a positive contribution due to the value premium.
Ultimately, by far the largest aggregate contribution to differences in relative performance was generated by single stock exclusions which we are unable to identify/verify on a company by company basis.
The mandated exclusion of a number of high emissions companies caused a considerable detraction from performance; a notable example being the exclusion of Exxon Mobil which returned +32% over the quarter, contributing to 15bps of underperformance by itself
Due to the profitability premium being mixed, it was the portfolio’s sustainability overlay which swamped the positive value premium and the portfolio underperformed.
This observation is reinforced by the other factor tilts delivering attribution contributions consistent with Dimensional’s fund commentary.
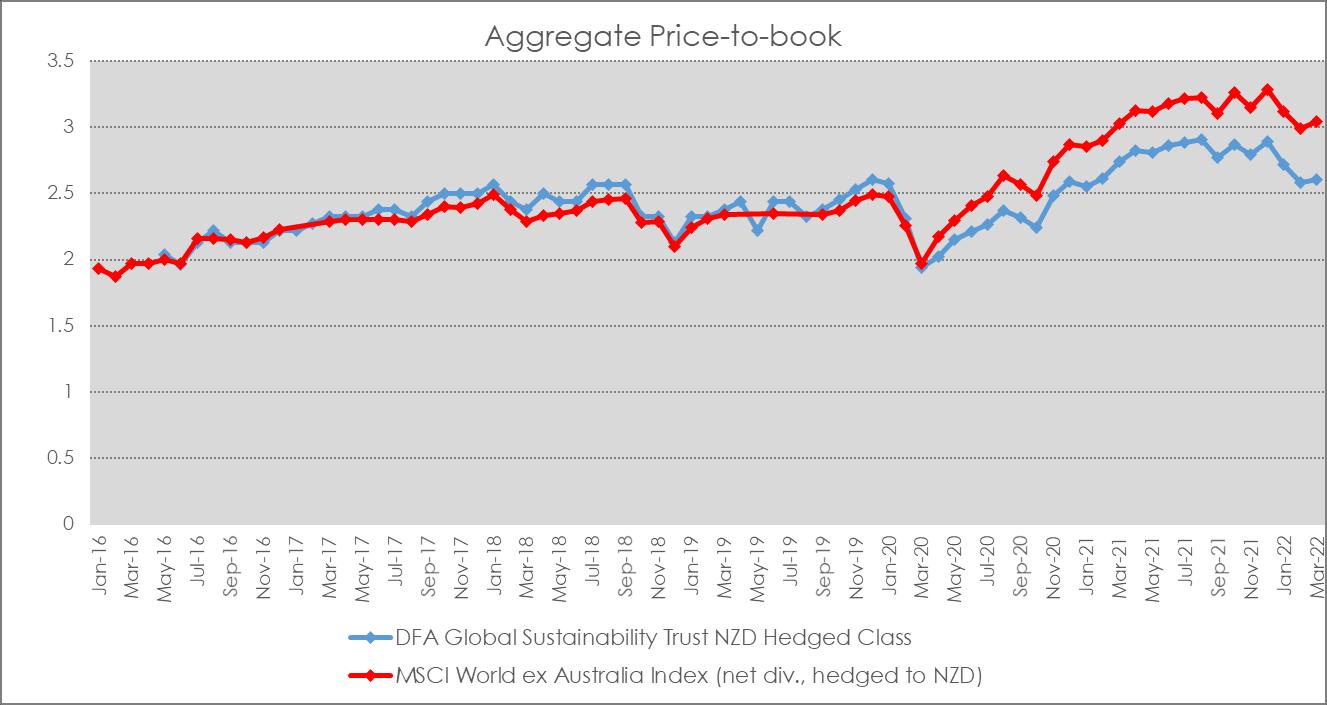
Analysis of risk exposure
Source: Consilium
We note that the change in relative price to book since the first half of 2020, this is consistent with the trust’s strategy migrating away from its initial large cap positioning, moving towards a core (size and value tilted) strategy. Whilst this has reduced a little further during the first quarter of 2022, we do not currently consider this to be a significant incremental change.
Source: Consilium
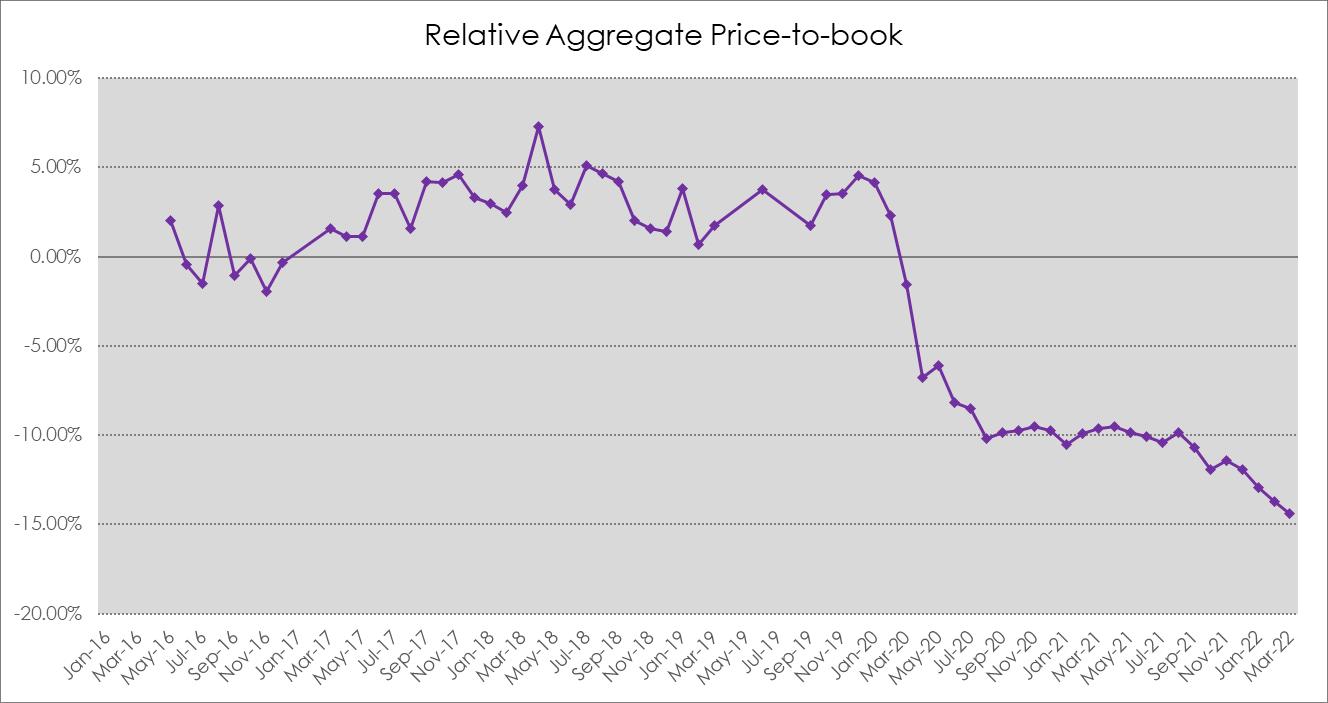
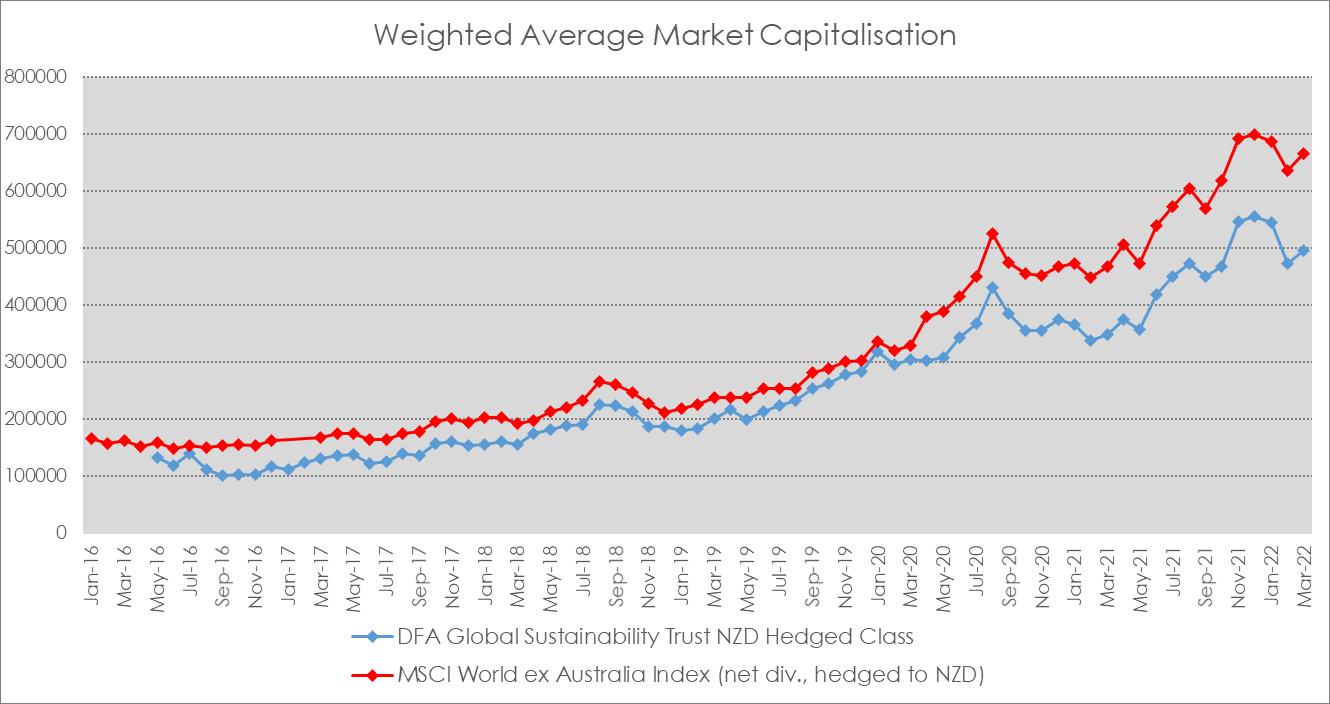
Figure 5
Weighted average total market capitalisation of trust relative to benchmark

Source: Consilium
We note, post the trust moving to a more traditional core allocation in early 2020, the relative weighted average market capitalisation has remained relatively stable.
Disclaimer: The material contained in or attached to this report has been prepared based upon information that Consilium NZ Limited believes to be reliable but may be subject to typographical or other errors. Consilium has taken every care in preparing this information, which is for client education purposes only. Although the data has been sourced from publicly available information and/or provided by the investment managers, we are not able to guarantee its accuracy. Past performance, whether actual or simulated, is no guarantee of future performance. This document does not disclose all the risks of any transaction type described herein, and the recipient should understand any terms including relevant risk factors and any legal, tax and accounting considerations applicable to them.
One or more of the author(s) of this report invest in the analysed security. The author(s) do not know of the existence of any conflicts of interest that might bias the content or publication of this report. Compensation of the author(s) of this report is not based on any outcome of this report.


