October 2022


October 2022 Volume 27 Number 10 ISSN 1468-9340

08
Nancy Yamaguchi, Contributing Editor, explores how the existence of uncertainty in the global energy market has impacted the Middle East’s downstream oil sector.
Ulrich Nanz, IPCO, Germany, discusses the opening of Duval’s sulfur processing terminal at the Port of Antwerp, Belgium.
Ganesh Kidambi, Shell Projects & Technology, and Hans Wijnbelt, Shell Catalysts & Technologies, demonstrate how low-temperature catalyst and solvent technology can help to optimise sulfur recovery and lower the carbon intensity of refining operations.
Alexandra Markle, Blasch Precision Ceramics, USA, lists the performance benefits of discrete temperature zones in a Claus reaction furnace.
Fiona George and Gerrit Bloemendal, Comprimo, provide an overview of how to select the optimum design for an onshore gas processing plant.

Harry Burton, AMETEK Process Instruments, USA, discusses how integrated analyser platforms can address common hydrocarbon processing and refining challenges.

Ralph Weiland, Nathan Hatcher and G. Simon Weiland, Optimized Gas Treating Inc., detail the effects of packing characteristics on gas treating absorber performance.
Cole Lewis, Honeywell Connected Industrial, USA, discusses how real-time asset performance optimisation can help to prevent operational energy losses and achieve peak performance in downstream facilities.

Pekka Qvist, NAPCON, part of Neste, Finland, explains how digital training solutions can help panel operators in fault situations.
Kirsten Berg and Adam Herrington, Zeeco Inc., USA, detail what to consider when designing flare systems and ancillary equipment for ammonia waste processes.
Sherri Roberts and Zach Kodesh, John Zink Hamworthy Combustion, a Koch Engineered Solutions Company, USA, consider how to improve steam flare efficiency at turndown, using staged steam injection.
Lea Clauson, DeZURIK Inc., USA, discusses the importance of elastomer selection for petroleum refinery water.
While much of the industry has been focusing on the promises of renewable energy, green hydrogen, and carbon capture – which will be important components in the transition to net zero emissions – one effective way to reduce emissions in the short-term is to operate more efficiently with what you already have: your equipment and assets. Turn to p. 47 to learn more.
Copyright© Palladian Publications Ltd 2022. All rights reserved. No part of this publication may be reproduced, stored in a retrieval system, or transmitted in any form or by any means, electronic, mechanical, photocopying, recording or otherwise, without the prior permission of the copyright owner. All views expressed in this journal are those of the respective contributors and are not necessarily the opinions of the publisher, neither do the publishers endorse any of the claims made in the articles or the advertisements. Printed in the UK.
FFCs slurry oils sell for just a few hundred dollars/ton, but when converted into Carbon Black – a key component in high-end plastics, tire manufacturing, and other rubber-based components – they can reach a market price of $2,500 USD/ton.
ET Black™: the industry technology of choice

Eurotecnica’s modified furnace black process, ET Black™, efficiently converts slurry oils into a wide range of carbon black grades, giving you access to an exciting and fast-growing industry.
With guaranteed operating flexibility and reliability, easy maintenance, and a low CAPEX, ET Black™ has become the technology of choice for industry leaders like ADNOC Refining.
Contact us at www.igoforETBLACK.com to find out more.

MANAGING EDITOR James Little james.little@palladianpublications.com
SENIOR EDITOR Callum O'Reilly callum.oreilly@palladianpublications.com
EDITORIAL ASSISTANT Bella Weetch bella.weetch@palladianpublications.com
EDITORIAL ASSISTANT Isabelle Keltie isabelle.keltie@palladianpublications.com
SALES DIRECTOR Rod Hardy rod.hardy@palladianpublications.com
SALES MANAGER Chris Atkin chris.atkin@palladianpublications.com

SALES EXECUTIVE Sophie Barrett sophie.barrett@palladianpublications.com
PRODUCTION MANAGER Kyla Waller kyla.waller@palladianpublications.com
EVENTS MANAGER Louise Cameron louise.cameron@palladianpublications.com
EVENTS COORDINATOR Stirling Viljoen stirling.viljoen@palladianpublications.com
DIGITAL CONTENT ASSISTANT Merili Jurivete merili.jurivete@palladianpublications.com
DIGITAL ADMINISTRATOR Leah Jones leah.jones@palladianpublications.com
ADMIN MANAGER Laura White laura.white@palladianpublications.com
CONTRIBUTING EDITOR Nancy Yamaguchi Gordon Cope
Annual subscription £110 UK including postage /£125 overseas (postage airmail).
Two year discounted rate £176 UK including postage/£200 overseas (postage airmail).
Claims for
APPLICABLE ONLY TO
Hydrocarbon Engineering
Much has changed here in the UK since the last issue of Hydrocarbon Engineering was published. In the space of a couple of days, we had a change in both government and monarch, following the appointment of Liz Truss as the country’s new Prime Minister and the passing of Queen Elizabeth II. And it’s fair to say that things have been a little turbulent ever since...
Although the new Conservative government immediately attempted to settle growing public anxiety by introducing a temporary cap on spiralling energy prices, its broader economic plan has created turmoil in the financial markets. A ‘bold’ package of massive tax cuts, funded by public borrowing, has seen the pound fall to record lows against the US dollar. To stem the tide, the Bank of England will likely have to hike up interest rates to restore some market stability. At the time of writing, reports suggest that the UK government plans to ride out the storm in the hope that the markets gain confidence that its economic policy will stimulate growth. But hope is very much the key word here.
Aside from its package of tax cuts, the new UK government has also unveiled a plan to bolster the country’s energy security. It has lifted the moratorium on shale gas production in England and confirmed its support for a new oil and gas licensing round, which is expected to lead to over 100 new licenses that will enable developers to search for commercially-viable oil and gas sources. The UK hopes to boost its energy resilience, in light of Russia’s “weaponisation of energy”, with the ambition to become a net energy exporter by 2040. By lifting the pause on shale gas extraction, the government plans to gather data and build an understanding of the UK’s shale gas resources (to date, only three test wells have been hydraulically-fractured in the country).

The government also intends to drive the development of renewables; nuclear; carbon capture, utilisation and storage (CCUS); and hydrogen. It has published a list of infrastructure projects that it plans to accelerate as soon as possible, including the Hynet Cluster in the northwest of England, and the East Coast Cluster in northeast England. Hydrogen projects included in the plan are the Hynet hydrogen pipeline, INOVYN hydrogen storage (Hynet Cluster), East Coast Cluster hydrogen pipeline, and Aldbrough hydrogen storage (East Coast Cluster), as well as hydrogen electrolyser capacity deployment.
Periodicals postage paid
NJ and additional mailing offices. POSTMASTER: send address changes to HYDROCARBON ENGINEERING, 701C Ashland Ave, Folcroft PA 19032.
15 South Street, Farnham, Surrey GU9 7QU, UK
Tel: +44 (0) 1252 718 999
On the topic of hydrogen, the second issue of Global Hydrogen Review magazine is out now. Turn to p. 61 and scan the QR code to download your free copy. If you like what you see, you can also sign up for a free subscription to the magazine here: www.globalhydrogenreview.com/magazine.
And I’d also like to invite you to attend Global Hydrogen Review’s inaugural Global Hydrogen Conference. This virtual conference will include a number of interesting presentations from thought leaders in the hydrogen sector, as well as live Q&As and networking opportunities. Sign up for free here: www.globalhydrogenreview.com/ghc22.
At Shell Catalysts & Technologies, we understand how small, unseen chemical reactions can affect the health of our loved ones, neighbors, and the planet at large. That’s what motivates us in our mission to Make Every Molecule Matter. Every member of our team is focused on the same goal — developing cleaner energy solutions that enable industry to tackle global climate challenges starting at the molecular level. Together, our experienced scientists and expert engineers put our diverse, unique owner-operator expertise to work — collaborating with you to create solutions that can solve your specific emissions and energy efficiency challenges.
Learn more at catalysts.shell.com/MEMM


Neste has launched a strategic study on transitioning its refinery in Porvoo, Finland, to non-crude oil refining, and into a leading renewable and circular solutions site.
Through co-processing and retrofitting of units, and benefiting from available refining assets, experience and know-how, Neste is aiming to significantly grow its renewables and circular production in Porvoo long-term.
The transformation under study would start with the co-processing of both renewable and circular feedstock, and could continue with retrofits of existing units at a later stage, with a long-term capacity potential of 2 – 4 million tpy. The targeted transformation would lead to a discontinuation of crude oil refining in Porvoo in the mid-2030s. Neste will also continue to actively study green hydrogen opportunities at the site.
Woodside Energy Trading Singapore Pte Ltd has entered into a flexible long-term sale and purchase agreement (SPA) with Uniper Global Commodities SE. Woodside will supply LNG from its global portfolio into Europe, including Germany, for a term of up to 2039, commencing in January 2023.
The quantity of LNG to be supplied under the new SPA is up to 12 cargoes per year (equivalent to more than 0.8 million tpy or
1 billion m3 of natural gas). Supply from September 2031 is conditional upon Uniper finalising its long-term strategic capacity bookings in Northwest Europe, expected by March 2023.
Woodside Energy CEO, Meg O’Neill, said: “Woodside is pleased that this latest agreement with Uniper will provide a new source of LNG for consumers in Europe who are seeking alternatives to Russian gas.”

According to a new report by the International Energy Forum (IEF) and S&P Global, global oil refining capacity dropped for the first time in 20 years in 2020, and again in 2021, exacerbating tight markets and volatile prices for fuels such as gasoline and diesel.
The ‘Oil Refining Industry Insights’ report finds that global fuel markets are expected to stay tight for years, as new capacity takes time to ramp up, and investments are muted by demand outlooks that show global petroleum demand plateauing.
“I am concerned that investors are holding back from new refinery investments based on decarbonisation forecasts that may not be borne out in reality,” said IEF Secretary General, Joseph McMonigle.
In both the short-term and medium-term, the balance for global fuel markets will be fragile, underscoring the need to maintain robust inventories and contingency plans to deal with supply disruptions, the report finds.
Following its selection as the first partner for the 32 million tpy North Field East (NFE) LNG project, TotalEnergies has again been selected as the first international partner in the 16 million tpy North Field South (NFS) LNG project.
Pursuant to the agreement, the company will obtain a 9.375% participating interest in the NFS
project – out of a total 25% interest available for international partners – while the national company, QatarEnergy, will hold the remaining 75%.
Through its combined participating interests in NFE (6.25%) and NFS, TotalEnergies will add 3.5 million tpy of LNG production to its growing worldwide LNG portfolio
by 2028, in line with the company’s objective to increase the share of natural gas in its sales mix to 50% by 2030.
Together, NFE and NFS form the wider North Field Expansion project to increase LNG production from the North Field, adding 48 million tpy to Qatar’s export capacity and bringing it to 126 million tpy by 2028.
18 - 20 October 2022
2022 AFPM Summit
San Antonio, Texas, USA
www.afpm.org/events
24 - 26 October 2022
Sulphur + Sulphuric Acid Conference & Exhibition
The Hague, the Netherlands
www.events.crugroup.com/sulphur/home
24 - 26 October 2022
RefComm Europe
The Hague, the Netherlands
www.events.crugroup.com/refcommeurope
24 - 26 October 2022
8th Opportunity Crudes Conference
Houston, Texas, USA
www.opportunitycrudes.com
31 October - 3 November 2022
ADIPEC Abu Dhabi, UAE www.adipec.com
7 - 10 November 2022
ERTC Berlin, Germany
www.worldrefiningassociation.com/event-events/ertc
16 November 2022
Global Hydrogen Conference
Virtual www.globalhydrogenreview.com/ghc22
29 November - 1 December 2022
Valve World Expo
Düsseldorf, Germany
www.valveworldexpo.com
6 - 7 December 2022
15th Annual National Aboveground Storage Tank
Conference & Trade Show
The Woodlands, Texas, USA
www.nistm.org
6 - 7 February 2023
NARTC
Houston, Texas, USA
www.worldrefiningassociation.com/event-events/ nartc/
In 1H22, US exports of petroleum products averaged nearly 6 million bpd, according to the US Energy Information Administration (EIA). This is the highest first-half-of-year exports in the EIA’s Petroleum Supply Monthly data since 1981. Nearly all petroleum products contributed to more exports, with the largest increases coming from distillate fuel oil and hydrocarbon gas liquids (HGLs).
Changes in Europe’s supply sources contributed to shifts in trade patterns for some, but not all, US exports. In the EIA’s September 2022 ‘Short-Term Energy Outlook’, it is forecast that petroleum product net exports (gross exports minus gross imports) will remain above the five-year (2017 – 2021) average through the end of 2023, suggesting gross exports will remain higher than previous years.
Lummus Technology has announced that Lihuayi Weiyuan Chemical Co. Ltd has selected its Novolen polypropylene (PP) technology for a new unit in Shandong Province, China.
Lummus’ scope includes the technology license for the PP unit, as well as basic design engineering, training and services.
“We are grateful for Lihuayi Weiyuan’s selection of Novolen, and proud to support our
customer across the full value stream, from propane feedstock to high-value PP product,” said Leon de Bruyn, President and Chief Executive Officer of Lummus Technology.
In addition to PP technology, Lummus also licensed its CATOFIN® technology to Lihuayi Weiyuan. In 2021, Lihuayi Weiyuan selected Lummus as the licensor for its CATOFIN propane dehydrogenation technology for a 600 000 tpy unit in China.
ir Liquide, Chevron, Keppel Infrastructure and PetroChina have signed a Memorandum of Understanding (MoU) to form a consortium which will aim to evaluate and advance the development of large-scale carbon capture, utilisation and sequestration (CCUS) solutions and integrated infrastructure in Singapore.
The consortium intends to research, test and develop technological, logistical and operational solutions for CCUS in Singapore.
In doing so, it will look to provide industry-wide CCUS-integrated infrastructure, primarily to support the energy and chemicals sector, by capturing and aggregating carbon dioxide (CO2) from large industrial emitters at a centralised collection facility.
The CO2 could then be utilised to make useful products, such as plastics, fuels and cement, and/or transported either through pipelines or by ships to suitable reservoirs in the Asia Pacific region, for sequestration.


Sulzer Chemtech is global market leader in reaction, separation, purification, static mixing as well as polymer processing technologies. With a comprehensive offering that includes process components all the way to complete process plants and technology licensing, we can serve a broad range of industries with key solutions to intensify processes, increase efficiency and improve product quality.
With an ever-expanding portfolio of cutting-edge products that supports circularity while reducing material and energy use as well as emissions, we are the ideal partner to support the net zero transition of businesses across the chemical and polymer value chains. We also offer our technology innovations to support the sustainable manufacturing of bio-plastics, renewable fuels, chemical recycling for unrecyclable materials as well as carbon capture technologies.


What a difference a year can make in the global oil market. In 2021, the world was emerging from the COVID-19 pandemic, and oil prices were surging. Optimism was widespread that a race was underway to return to some sort of post-pandemic normalcy. In July 2021, the OPEC+ group announced that it would relax its self-imposed production ceilings. The new agreement called for additional output of 400 000 bpd each month, beginning in August 2021. This announcement slowed, but did not stop, the upward price trend. The goal was to foster a stronger and more stable price regime that raised producer revenues without stifling global economic recovery. Had it been a simple matter of arithmetic, the ensuing 12 months would have allowed up to 4.8 million bpd of supply back to the market. However, there was no race to return to high levels of production, but rather a a slow hike. Oil supplies grew tighter as COVID-19 began to be brought under control, and demand started to recover.
When Russia invaded Ukraine in February 2022, oil prices surged and have remained strong throughout the summer, despite inflationary pressures and fears of potential recession. International sanctions are cutting into Russian output, keeping the supply side of the equation tight. Yet the OPEC+ group recently met and announced that they would initiate a cut of 100 000 bpd, citing economic uncertainty and
the possibility of expanded supply from Iran. It appears increasingly unlikely that Iran will re-enter a nuclear deal, so it is improbable that these supplies will flood the market.
However, the demand side appears weaker than expected, with consumers facing high prices and inflationary pressures. At the time of writing, several new developments are emerging. In the US, the world’s largest consumer country, inflation numbers have been worse than expected, and oil demand in 2022 may actually fall below what was seen in 2021. Around the world, central banks are raising interest rates, so the cost of money is on the rise. In Europe, the Russia-Ukraine war has been long-lived and hard-fought, with a recent rally by Ukrainian forces causing a Russian retreat.
Consumers are preparing for a winter of high energy prices. The UK has just lost Queen Elizabeth II, its longest-reigning monarch. Although the monarch does not run the government, Queen Elizabeth was a symbol of stability and wisdom not only in the UK, but around the world. As such, she was highly influential, and her loss brings a sense of uncertainty. Therefore, while the COVID-19 pandemic appears under control and economic activity is recovering, a note of caution is hard baked into the global energy market.
This article examines the oil sector in the Middle East, discussing the impacts of the COVID-19 pandemic, the Russia-Ukraine war, supply and demand developments, OPEC
 Nancy Yamaguchi, Contributing Editor, explores how the existence of uncertainty in the global energy market has impacted the Middle East’s downstream oil sector.
oil export revenue, and refining. The region could spearhead a new wave of investment in the oil sector and an effort to capture market share, particularly since consumers wish to reduce reliance on Russia. But the question remains: has caution become so firmly entrenched that even US$90 – 100/bbl oil prices cannot tempt a wave of investment?

Oil prices are famous for volatility, but the market is in the midst of the most dramatic crash-spike cycle ever witnessed. The pandemic caused immense economic dislocation and oil
demand destruction. It even brought one unprecedented day (20 April 2020) when the futures price of US West Texas Intermediate (WTI) crude went into negative territory, closing at -US$37.63/bbl. It took roughly a year before prices crept back up to pre-COVID-19 levels.
The pandemic had calamitous impacts on the Middle East and on countries all over the globe. The rate of new infections and deaths is finally tapering down. Table 1 details the total number of COVID-19 cases and deaths in the Middle East as of 1 September 2022. Over 22.3 million people have been infected, and over 237 000 have lost their lives. Moreover, new variants have emerged, and people remain on guard.
Bahrain
Iran
Iraq
Israel
Jordan
Kuwait
Lebanon
Oman
Palestine
Qatar
Saudi
Syria
UAE
Yemen
Total
Figure 1 displays the dramatic volatility in monthly average Brent crude spot prices (US$/bbl) during the 15-year period from July 2007 through to July 2022. Note that these are monthly average spot prices, and that daily price volatility has been even more extreme. In the summer of 2008, monthly average Brent prices spiked to over US$132/bbl. The Great Recession followed, and Brent spot prices dropped below US$40/bbl. By 2011, prices had climbed back up to above US$100/bbl. However, Saudi Arabia then launched an oil price war, which again forced prices down to below US$50/bbl as the Kingdom worked to outlast the competition and regain market share. Prices then fell to approximately US$30/bbl, when sanctions on Iran were lifted, and Iranian crude began to re-enter the market.
To halt the downward slump in prices, OPEC members organised a cooperative effort with key non-OPEC producers, signing a ‘Declaration of Cooperation’. The countries were nicknamed the ‘OPEC+ group’. With the OPEC side led by Saudi Arabia and the non-OPEC group led by Russia, the group agreed to production cuts that helped drain overflowing global inventories and strengthen prices. These measures helped to place prices back in the US$50 – 70/bbl range, but the unforeseen COVID-19 pandemic set all of this back. Mandatory lockdowns and stay-at-home orders caused Brent spot prices to crash to US$18.38/bbl in April 2020.
The sharpness of the price crash was mirrored by the steep take-off of price recovery in 2021 – 2022. Demand returned much more quickly than supply did; the anticipated race to return to high production has been more of a slow walk. For some oil producers, the production ceilings were never binding, and little could be done to expand output in 2021 – 2022. For others, investment in the oil sector had been stifled by weak prices and unpredictable

for years, and therefore a significant length of time was/is needed to elevate production. With little new production, oil prices continued to climb in 2021 and early 2022, and then surged to record highs when Russia invaded Ukraine in February 2022.
In March 2022, monthly average spot prices for Brent crude surged to above US$100/bbl for the first time since 2014. Global refinery margins rose despite higher feedstock costs, as refinery capacity has stagnated in many areas and shrunk in others. Gasoline and diesel retail prices hit record highs in multiple markets. During the week of 14 June 2022, the average retail prices for regular gasoline topped the US$5/gal. mark for the first time in history in the US (the world’s largest market for gasoline) – an immense shock to consumers long-accustomed to inexpensive fuel.
Prices have retreated from the June and July highs, and by mid-August, daily Brent spot prices fell to below US$100/bbl. Will the OPEC+ group try to defend a certain price level (US$90/bbl, for example) as a sustainable price? The group recently approved a small cut of 100 000 bpd, intended to promote stability, and Saudi Arabia was given approval to intervene and call special meetings at any time if adjustments become necessary.
Although importing countries have been calling for expanded supply from non-Russian sources, the OPEC+ group is adopting a stance of caution, citing weak economics and potential expansion of Iranian supplies if the nuclear deal is revived. The EU and other countries have expressed doubts about Iran’s commitment to the nuclear deal.
The current oil supply-demand balance is in flux, and far tighter than expected. Post-COVID-19 economic activities have been on an upswing, with oil demand in recovery. However, supplies have been constrained, and the Russia-Ukraine war has heightened geopolitical risk.
The West, led by the EU and the non-European G7 countries, quickly launched sanctions to hobble the Russian economy, including actions to shut in Russian exports of oil, revenue from which funds the war effort. Germany, for example, plans to ban imports of Russian crude by the end of the year –an ambitious goal. Europe is the chief market for Russian crude exports. According to BP, Russia exported 263.6 million t of crude oil in 2021, of which 138.7 million t (53%) went to Europe. Europe is also the main market for Russian refined product exports. In 2021, Russia exported 140.7 million t of refined product, 75.9 million t (54%) of which went to Europe.
Figure 2 compares Middle Eastern oil exports with Russian oil exports to Europe in 2021, as reported by BP. Russia was the source of 30% (138.7 million t) of Europe’s crude imports, as well as 38% (75.9 million t) of Europe’s refined product imports. In contrast, the Middle East provided 16% (77.1 million t) of Europe’s crude imports and 14% (26.9 million t) of Europe’s refined product imports.


Although Russia is a partner in the OPEC+ group, it is likely that there are opportunities for the Middle East to expand its market share of both crude and products in Europe, most likely by diverting flows from Asia to Europe while Russian oil works its way into Asia in the near term. In the longer term, Middle Eastern producers may be able to expand output of both crude and refined product. The most profitable markets, however, may change dramatically once the Russia-Ukraine war ends. Initially, Russia believed that what it called a ‘special military operation’ would be successful quickly, but Ukrainian resistance has been strong. Even when peace is achieved, European consumers may remain wary of returning to such a heavy reliance on Russian oil and oil products, potentially opening the door to Middle Eastern exporters.

As oil demand recovered and prices surged, the OPEC+ group announced that it would raise
Figure 2. Middle East vs Russian crude and product exports to Europe, 2021. Source: BP. Figure 3. Monthly change in oil production, OPEC Middle East, ‘000 bpd. Source: OPEC.
production gradually by 400 000 bpd beginning in August 2021. The actual growth was far slower. In the Middle East, only Saudi Arabia and the UAE are seen as having enough spare production capacity to significantly impact the market. A concerted investment programme would be needed to elevate production in most countries. Iranian output remains stifled by sanctions, and recent discussions concerning a restoration of the Iran nuclear deal have not borne fruit. The OPEC+ group estimated that Iran could bring an additional 1 million bpd to the global market, but this should not be expected anytime soon.
Figure 3 shows the change in monthly oil production by the Middle East OPEC countries during the period from January 2021 through to July 2022, as reported by OPEC. Middle Eastern OPEC crude production hit a peak of 25.08 million bpd in April 2020, as producers bumped up production in anticipation of the cuts to come. Output then plunged to 17.62 million bpd in June 2020, a drop of 7.46 million bpd in just two months. Output crept back to 20 million bpd by June 2021. OPEC+ announced that it would allow an increase of 400 000 bpd per month beginning in

August 2021. As Figure 3 illustrates, however, the monthly increases have been modest. For OPEC in total, production rose by 2.07 million bpd between August 2021 and July 2022.
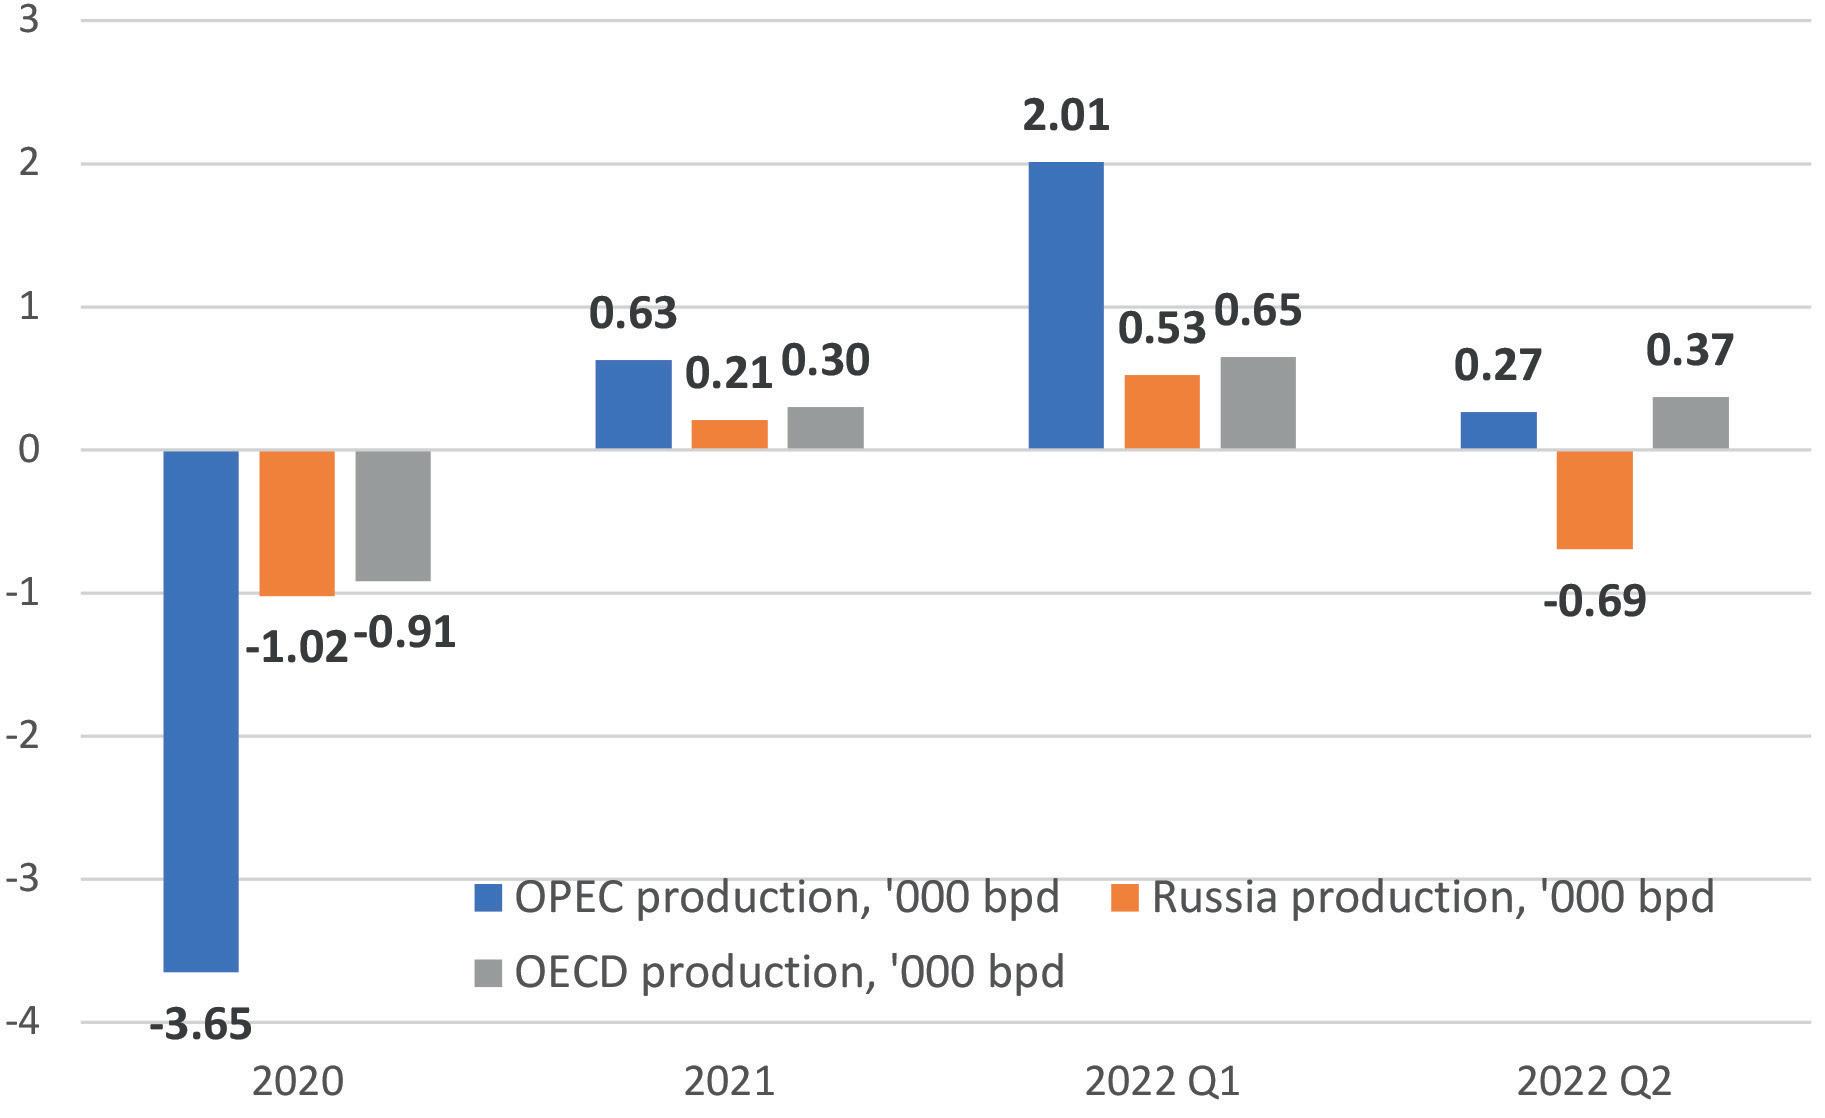
Global oil supplies have been slow to recover. Figure 4 shows the recent change in oil production in OPEC, Russia, and the Organisation for Economic Co-operation and Development (OECD). In 2020, the COVID-19 pandemic forced OPEC to shut in 3.65 million bpd. Russia cut production by 1.02 million bpd; OECD output declined by 0.91 million bpd.
In 2021, OPEC restored 0.63 million bpd of oil production, while Russia and the OECD brought back 0.21 million bpd and 0.3 million bpd, respectively. In 1Q22, OPEC production rose by 2.01 million bpd, followed by an increase of 0.27 million bpd in 2Q22. OECD production rose by 0.65 million bpd in 1Q22 and 0.37 million bpd in 2Q22. Russian output rose by 0.53 million bpd in 1Q22, but it then fell by 0.69 million bpd in 2Q22, as international sanctions hit. Russia shut in nearly 1 million bpd of production in April 2022. In net terms, therefore, there has been no restoration of Russian oil supply in 2021 through 1H22. OECD countries have expanded output by 1.3 million bpd – more than replacing their loss of 0.91 million bpd in 2020. The EIA forecasts that US production will rise by 0.5 million bpd in 2022, and by 0.9 million bpd in 2023. The OPEC countries raised output by 2.9 million bpd in 2021 and 1H22, but this falls 0.7 million bpd short of the 3.65 million bpd supply drop in 2020.
Just as oil prices have gone through severe up-and-down cycles, so too have OPEC’s oil export revenues. Figure 5 shows oil export revenues in the Middle Eastern OPEC countries Iran, Iraq, Kuwait, Saudi Arabia, and the UAE. This declined to US$448 billion in 2019, then plunged to US$251 billion in 2020. Oil export revenues were cut by more than half in just two years – a serious financial shock to countries where oil contributes the lion’s share to government revenue. Iran suffered the largest drop; crude oil export revenues of US$66 billion in 2018 collapsed to US$17 billion in 2020.
The EIA data shows that Middle East OPEC oil export revenues rebounded to US$440 billion in 2021, and revenues are forecast to hit a peak of US$722 billion in 2022. The EIA forecast assumes an average Brent crude spot price of US$98/bbl in 4Q22, followed by a slightly lower average price of US$97/bbl in 2023. The lower price will cause oil export revenues to decline to US$657 billion in 2023.
Middle Eastern refiners have often contended with low utilisation rates, which fell below 90% in 2009 (the Great Recession) and have never returned to 90% in the years since. Figure 6 tracks the changes in Middle Eastern refinery utilisation between 1980 and 2021, according to data published by BP. In the early 1990s, refinery utilisation rates were often 90% and higher. These rates trended down until 2020, when
Figurethe COVID-19 pandemic pushed them down to 75%. 2021 brought rates back to 79%. This was an improvement, yet still below what most refineries consider a profitable level. OPEC reported that in July 2022, US refinery utilisation rates averaged over 93.4%, European utilisation rates averaged 85.7%, and the selected Asian countries of Japan, China, India, Singapore and South Korea had a utilisation rate of over 90.4%.
Refinery expansions have been underway in the Middle East despite low utilisation rates, and many projects remain planned. The recent rise in oil export revenue may make some of these refinery projects possible, though there has been no rush to develop new grassroots refineries when multiple upgrades and expansions remain on the books.
Current refinery projects of note include the 400 000 bpd Jizan refinery in Saudi Arabia, which was completed in late 2021. At first, the refinery was to be built in 2018. The refinery was run at 50% capacity initially, and it plans to ramp up to full capacity in 2022. At full capacity, the refinery is designed to produce up to 75 000 bpd of gasoline, 250 000 of ultra-low-sulfur diesel, and 90 000 of vacuum residue. The vacuum residue will be used as feedstock for the integrated gasification combined cycle plant, which will be the largest of its kind in the world. The Jizan refinery started exporting product in early 2022.
In Kuwait, the 615 000 bpd Al-Zour refinery reportedly began operations in June 2022. The refinery has three 205 000 bpd crude distillation units, and one was being tested. The design plan calls for an output slate of approximately 18 000 naphtha, 53 000 bpd of kerosene, and 62 000 bpd diesel from tower 1, to be doubled when tower 2 is commissioned. The refinery includes atmospheric residuum desulfurisation units to produce low-sulfur fuel oil for use in the power sector. Al-Zour was scheduled to be onstream in 2020, but it was postponed when the pandemic hit.
In Iraq, the 140 000 bpd Karbala grassroots refinery is expected to be completed in September 2022. The refinery will start by refining 70 000 bpd of light and medium crude in 4Q22, and the plan is to ramp up to the full 140 000 bpd in 2023. This refinery is long-awaited. Construction began in February 2014. It faced numerous delays, but it is a sophisticated plant capable of producing EURO standard fuels.
In Oman, the government is working with Kuwait Petroleum International to build a joint venture (JV) refinery known as ‘OQ8’ at Duqm. This will be a 230 000 bpd deep conversion refinery with hydrocracker plus coker. The project is reportedly 92% complete, and start-up is planned for 1Q23.
In the last few years, there has been incredible volatility in the oil market, with tectonic movements across the sector: in demand, supply, storage, trade, price, policy, investment, etc.
As the COVID-19 pandemic was brought under control, the year 2021 was seen as a recovery year. It seemed there would be a race to return to normalcy. As economic activity rose, oil
 Native Sulphur
demand bounced back. But supply lagged and prices soared, and these inflationary pressures jeopardised economic recovery. Middle Eastern oil producers worked to increase production, but the gains were slow.
Geopolitical risks rose in 2022 when Russia invaded Ukraine, and oil prices spiked to multi-year highs. While Russia planned for a short ‘special military operation’, the conflict has been protracted and hard fought. In its usual cycle, market uncertainty has contributed to high prices, which has dampened demand and calmed further upward price


movement. However, it has also discouraged confident investment in the energy sector. The OPEC+ group appears to be concerned that the newest oil price surge could be followed by another cycle of weakness, and has agreed to reduce supply slightly to support prices.

OPEC oil export revenues soared in 2021, and they are forecast to climb sharply in 2022 before tapering off gently in 2023. How much revenue is enough to replenish government coffers and invest in upstream and downstream oil projects in the Middle East? OPEC cut 3.7 million bpd of oil production in 2020, and it brought back 2.9 million bpd in 2021 and 1H22. If the Russia-Ukraine war is not resolved, Russian production may be constrained and prices may remain high, potentially motivating other producers. In the Middle East, refinery throughput is rising, and four long-awaited refinery projects are either complete or nearly complete.
The years of volatility appear to have instilled caution in the oil market. Anything that swings madly up can come crashing madly down. Even with prices and revenues at multi-year highs, a reversal is always possible.
Middle Eastern countries are cautiously increasing crude production, and they have completed some downstream upgrading and expansions. Other plans may be revived or accelerated. The industry is returning, but without a rush.


 Figure 6. Middle East refinery utilisation rates 1980 – 2021, %. Source: BP.
Asulfur solidification terminal now operating in the Port of Antwerp, Belgium, is the latest example of a growing trend in the sulfur industry: downstream, post-refinery processing is being outsourced to specialist logistics companies.

Operated by Duval, a subsidiary of German chemical marketing and logistics services company solvadis, the facility receives liquid sulfur from a number of refineries in
October 202217HYDROCARBON ENGINEERING Ulrich Nanz, IPCO, Germany, discusses the opening of Duval’s sulfur processing terminal at the Port of Antwerp, Belgium.
Western Europe, and uses IPCO’s high-speed Rotoform HS technology to handle the solidification process.
Sulfur has different applications in various industries worldwide, including use in fertilizer products and in the production of sulfuric acid. Since transportation of hot liquid sulfur over long distances by ship is rather limited, the liquid sulfur extracted during the refining process needs to be converted into solid form for ease of storage, handling and transportation.
Headquartered in Frankfurt, Germany, solvadis is one of the world’s leading international service providers in terms of processing, handling and distributing commodity and specialty chemicals, and it has more than 100 years of experience in the sulfur industry.
Subsidiary company, Duval NV, was already home to a major liquid sulfur terminal in the Port of Antwerp, so this was the obvious choice when deciding the location for its new sulfur-forming facility.

This investment means that Duval is now able to receive liquid sulfur by rail, road, waterway (barges and seagoing vessels) and pipeline, and can convert it into high-quality formed solid sulfur for onward shipping and distribution by trucks, containers, barges and seagoing vessels.
Together with existing liquid sulfur storage tanks, the new sulfur-forming facility is the largest sulfur storage and processing hub in Northwest Europe.

IPCO’s Rotoform pastillation technology was selected for this particular installation. It delivers a defined granule shape and size with minimal moisture content. The location of the facility meant that environmental and safety factors were a key consideration, so low emissions during processing and handling were also important.
The site required a technology that would be able to cope with throughput rates that can vary across different shift operations. Selecting multiple lines that can be shut down and restarted at short notice provided the flexibility required.

Duval also required a partner with the engineering capacity to handle the project in a short time, and the after-sales support capability to provide a rapid response in the event of any issues arising during regular operation.
The solidification facility is based around multiple IPCO Rotoform HS lines in parallel, each with the capacity to process several tons of pastillated sulfur per hour.
IPCO’s scope of supply also included the connection to a large jacketed sulfur tank where liquid sulfur can be received by truck or ship, and a ProCool system to pre-condition the liquid sulfur temperature in the supply line. IPCO was also responsible for specifying a rubber belt conveyor for the collection of granules from the discharge end of the granulation machines, and the design of interconnecting piping for liquid sulfur; and utilities such as cooling water, steam for heating, and compressed air. The whole system is controlled from a central programmable logic controller (PLC) system that allows remote access for fast analysis and support from abroad.
Rotoform HS delivers high-quality solidified sulfur in a form that meets the Sulphur Development Institute of Canada’s (SUDIC) premium specifications, i.e. narrow size distribution of granules, low dust content, minimum moisture and a high bulk density. In addition to requiring a system that has high availability and predictable operation and maintenance costs, health, safety and environment (HSE) was also an important consideration for Duval, and Rotoform has proven credentials in this respect.
Figure 1. IPCO high-capacity Rotoform HS sulfur granulation units. Figure 2. IPCO Rotoform feed station. Figure 3. Duval’s sulfur processing terminal in the Port of Antwerp.You might be wondering what the cooling system of a nuclear reactor and a refrigerator have in common. They are examples of products where quality can not be compromised – that’s why Alleima alloys are crucial in the production of both.
Everything is new, nothing has changed. Sandvik Materials Technology is now Alleima, our quality stainless steel and alloys remain the same.


Read more at alleima.com

The liquid sulfur is received in the storage tank at a temperature that is too high to yield satisfactory results from the pastillation procedure. As such, IPCO’s solution includes its ProCool sulfur pre-conditioning technology – an air-cooled finned tube system that lowers the temperature of the liquid sulfur to the required level. The waste heat can also be used to heat the production area during the cold season.
The sulfur is first fed through a filter by means of pumps, then conveyed through the pre-conditioning unit. The patented system reduces the temperature of the product to the optimal level of 125 – 128°C, in preparation for the granulation/pastillation process. At this temperature, product viscosity is between 10 – 15 mPas, which ensures that product quality and throughput rates are optimised, excessive dust formation is avoided, and the solidified sulfur meets the SUDIC specification.
This is a reliable, low-maintenance solution. Other benefits of the technology include a simple modular design, fully-automated operation, low utility consumption, and emission-free performance.
IPCO’s high-capacity Rotoform HS sulfur granulation units consist of a heated, cylindrical stator, and a large perforated rotating shell that turns concentrically
around the stator, depositing sulfur drops across a continuously-running steel belt cooler.
A system of baffles and internal nozzles built into the stator provides uniform pressure across the whole belt width, resulting in an even flow through all holes of the perforated rotary shell. This ensures that all pastilles are of uniform size, from one edge of the belt to the other.
As the steel belt travels along the system, cold water is sprayed against the underside of the belt and heat is transferred, indirectly, from the sulfur melt to the cooling water, resulting in quick, controlled solidification. The fact that there is no contact between the molten sulfur and the cooling water means that there is no risk of cross-contamination.
A discharge temperature of less than 70°C ensures smooth downstream handling of the solid product. To eliminate the possibility of damage to the pastilles during discharge, a silicon-based release agent is applied to the steel belt as a thin film.

At the end of the belt coolers, the solid sulfur is deposited onto a collecting conveyor and transported via the handling system towards the bulk storage area. The efficiency of this single-step, liquid-to-solid process results in a quality classified as ‘premium’, as defined by the SUDIC specifications in 1977 (see Table 1).
The process also offers a number of environmental advantages. As the cooling water and sulfur never come into contact, there is no need for a water treatment system at the solidification stage; the water can simply be re-cooled and used again.
Solidification takes place rapidly – usually in less than 10 sec. – so there is little time for hydrogen sulfide to escape, resulting in very low emission values in compliance with European regulations, and there is no need for additional equipment such as scrubbers or burners. Similarly, low dust levels mean that exhaust air treatment with wet scrubbers or cyclones is not required. Additionally, with extremely low energy consumption requirements, the Rotoform process is also an economical and environmentally-friendly sulfur solidification solution.
A key benefit of installing multiple Rotoform HS units alongside one another is that individual lines can be shut down – and restarted – in minutes, enabling the capacity of the facility as a whole to be adjusted to changing throughput rates. This delivers a level of flexibility that would be impossible to achieve with a single high-capacity system. This multi-system approach also enables lines to be closed down for cleaning or routine maintenance without halting overall production.
This ability to handle variable throughput rates was proved during the commissioning process. Various start-up and shutdown scenarios with different loads per unit were tested to simulate different production rates, and the overall system was shown to offer the high levels of flexibility required.
FigureDemand for energy is set to rise as the global population and standards of living continue to grow. Current energy systems, however, are carbon-intensive and must undergo a rapid transition to lower-carbon alternatives if we are to limit the global average temperature rise to 1.5°C above pre-industrial levels, as set out by the Paris Agreement.

This scenario presents multiple opportunities for the hydrocarbon refining industry to showcase its strong innovativity, optimise operations, and offer lower-carbon solutions and products. Not only will this help to reduce industry carbon emissions, but it will also offer significant financial incentives at a time when the cost of carbon dioxide (CO2) emissions is rising, standing at €85/t (US$88/t) in the EU emissions trading scheme at the time of writing.
As part of its Powering Progress strategy, Shell has set out to accelerate its transition, in step with society, by becoming a net-zero-emissions energy business by 2050. To achieve this, the organisation will reduce emissions related to its own operations (Scopes 1 and 2) and those that result from the use of all of the energy products that it sells (Scope 3), including products derived from third-party energy feedstocks. Where emissions cannot be avoided, Shell will capture and store, or offset, any remaining emissions.
In addition to curbing carbon emissions, limiting sulfur emissions is imperative for a company’s licence to operate. However, the process of removing sulfur from gas streams can be energy – and therefore carbon – intensive. The SCOT ULTRA process is one of many options
Ganesh Kidambi, Shell Projects & Technology, and Hans Wijnbelt, Shell Catalysts & Technologies, demonstrate how low-temperature catalyst and solvent technology can help to optimise sulfur recovery and lower the carbon intensity of refining operations.
available for decreasing the carbon intensity of refining and gas processing. The Shell Blue Hydrogen Process and Shell Renewable Refining Process are two other refinery decarbonisation options.
The sulfur recovery section of a refinery or gas processing facility is not built to generate revenue, as the sulfur market price is volatile and the cash generation from elemental sulfur is small in comparison to the main revenue streams. Instead, it is built to help a company maintain its social licence to operate. Consequently, the design and success of a sulfur recovery unit (SRU) is measured in terms of its ability to meet the SOx emissions (mostly with a downstream tail gas treatment unit [TGTU]), CAPEX, operating and carbon costs, and reliability and flexibility.
This article demonstrates how SCOT ULTRA technology –the most novel version of the SCOT process with a new, drop-in solvent and a low-temperature catalyst – can enable operating units to reduce the carbon intensity of tail gas SRUs,
and increase the amount of sulfur recovered to meet stringent SO x emissions regulations. Additionally, SCOT ULTRA amine solvent, JEFFTREAT ULTRA, secures the SCOT or other TGTU to operate with greater resilience to upsets and extreme hot and cold climatic temperatures. These are important benefits for systems running close to their limits, or in regions where more frequent and intense weather extremes are driven by climate change.
The SCOT ULTRA technology is able to:
n Lower OPEX and carbon footprint, and/or increase capacity.
n Operate the hydrogenation (SCOT) reactor at a lower temperature, saving steam/fuel costs.
n Operate the amine unit at higher solvent temperature, enabling savings in cooling.
n Provide increased resilience to upsets.
n Offer greater flexibility to handle changing crude slates and upstream gas composition.

n Decrease or avoid CAPEX for greenfield developments.
Due to thermodynamic limits, sulfur recovery from modified Claus SRUs is limited to between 96% and 98%. Therefore, to meet current SOx emission regulations, which require greater than 99.9% sulfur recovery, it is now necessary to install a downstream TGTU.
The SCOT process uses a three-step approach to enable efficient and deep recovery of the residual sulfur species in the tail gas stream (Figure 1). First, the reduction section preheats the SRU tail gas using a line burner (direct reheat) or steam reheater (indirect reheat).
Figure 1. The three-step SCOT ULTRA process. 1 = preheater; 2 = direct-contact quench column; 3 = amine absorber.
At reactor inlet temperatures of 210 – 260°C (depending on the catalyst used), a catalyst-based reduction reactor section then converts the sulfur components of the tail gas (sulfur dioxide [SO2], sulfur trioxide [SO3], carbonyl sulfide and carbon disulfide) into hydrogen sulfide (H2S).
Second, the gas exiting the reactor is cooled in a two-step process: first, in an (optional) heat recovery exchanger that produces steam; and second, in a direct-contact quench column with water. Claus reactions generate a significant amount of water, which is bled from the quench column to aid the performance of the amine section.

Third, an aqueous amine solvent is used to selectively capture and recycle H2S from the cooled gas. The H2S is stripped in a solvent regenerator (also called a stripper) and recycled to the front end of the SRU. The treated gas from the absorber column is incinerated to convert unrecovered H2S to SO2 before release through the stack.
Figure 2. Swapping in SCOT ULTRA (834) can help reduce SRU carbon intensity by as much as 50% compared with previous SCOT catalysts.
Like all alternative amine-based TGTUs, SCOT is energy-intensive. This creates an opportunity to develop and deploy novel technologies designed to reduce operating costs and carbon emissions, while maintaining superior performance and sulfur recovery.
Since its first introduction in the 1970s, the SCOT process has been refined and optimised to keep pace with evolving emissions regulations and the need to reduce the carbon footprints of facilities. The original SCOT design used a conventional secondary amine (DIPA) or a tertiary amine (MDEA) for the amine absorption section. Later, low sulfur, or LS SCOT, was introduced, which used an acid-aided regeneration (formulated MDEA) scheme in the amine regenerator, resulting in reduced energy consumption in the amine reboiler while also meeting a lower SO2 specification in the flue gas.
Additionally, to meet evolving performance standards, Shell Catalysts & Technologies developed a range of catalysts, such as 734, able to operate at lower temperatures (approximately 220°C and lower) for processes such as low-temperature (LT) SCOT. Using these catalysts reduces the amount of fuel gas needed, and enables the use of indirect heating methods.
SCOT ULTRA is the latest evolution of the SCOT catalyst and solvent technologies, and integrates the latest LT SCOT catalysts (834 or 934) with the JEFFTREAT ULTRA amine solvent.
Historically, SCOT catalysts have operated at temperatures greater than 240°C. SCOT ULTRA, however, can operate at much lower temperatures; the latest SCOT 934 catalyst is effective at an inlet temperature of 200°C, and SCOT 834 at an only marginally higher temperature. This low-temperature operation requires less energy while still meeting the demanding performance requirements. This helps to reduce carbon intensity and provides potential operational savings of hundreds of thousands of dollars per year, depending on the temperature delta and unit size.
In a simulation using proprietary Shell models, SCOT ULTRA catalyst 834 has demonstrated a 50% reduction in carbon intensity and an approximately 15% higher organic sulfur yield at a 50°C lower temperature compared with using the conventional high-temperature (HT) SCOT 534 catalyst (see Figure 2).2 The information shared in Figure 2 shows that applying a more active catalyst reduces the carbon intensity as a result of lowering the operating temperature. The highest active catalyst, 934, will allow for a further reduction in carbon intensity of 10 – 20%, depending on the specifics of the unit.
The choice of amine will significantly impact the overall performance of a SCOT unit. In collaboration with Shell Catalysts & Technologies, Huntsman has developed JEFFTREAT ULTRA, a temperature-resilient, sterically-hindered amine solvent. When used as part of the SCOT ULTRA process, the amine solvent provides deeper H2S removal (lower SO2 emissions), more capacity, the ability to ‘slip’ more CO2, and better upset (H2S spike) resilience.
Additionally, compared to a conventional MDEA solvent, the amine solvent enables lower circulation rates for lower energy demand and superior H2S absorption performance. It can also operate at elevated temperatures, thus reducing or
eliminating the need for chilling while still meeting strict SOx specifications (see Figure 3).

The key to the SCOT ULTRA process is the integration of a high-performance catalyst and a high-selectivity solvent, both developed through expert knowledge and operational experience. And, although both SCOT ULTRA catalysts and JEFFTREAT ULTRA can be deployed separately, applying them together, with proper integration, brings greater benefits than the sum of each part.
For example, combining SCOT ULTRA’s superior catalyst performance with JEFFTREAT ULTRA’s higher absorption capability can reduce circulation rates by 25 – 50% compared with AAR (formulated) MDEA. The combination can also help decrease the overall carbon footprint by 54% compared with using MDEA (see Figure 4). This comes from lower reboiler duty and reactor operating temperature.
Figure 3. Swapping in JEFFTREAT ULTRA eliminates the need for chilling, thereby reducing circulation rates and overall energy consumption.
Figure 4. SCOT ULTRA technology can help reduce overall carbon footprint by 54% compared with using MDEA.

Lower carbon emissions enable numerous financial benefits, including avoiding carbon levies or attracting emission reduction incentives. At a carbon cost of US$25 – 50/t of CO2, simulations based on a catalyst and solvent swap in a 250 – 500 tpd brownfield facility show a return on investment (ROI) for SCOT ULTRA of just one year. This is solely from lower carbon costs, and does not consider the additional benefits of fewer shutdowns due to greater resilience to upsets.
SCOT ULTRA technology has now been operating at multiple facilities for several years, which has provided data for the important validation of the technology’s superior performance.
In one example, a US refinery using a conventional MDEA solvent wanted to improve the operational robustness of its SCOT unit against upsets and higher temperatures. The facilities were suffering from several operational challenges, including SRU feed gas with high CO2 concentration (35 vol%) and a Claus unit with lower-than-typical sulfur recovery, resulting in increased load on the SCOT unit. Additionally, the facility was operating with lower steam rates, and emissions were base loaded by the degasser pit vent, which is routed to the incinerator.
By dropping in JEFFTREAT ULTRA as a direct replacement for the MDEA solvent, the overall performance of the SCOT unit was improved, including increased resilience against upsets and high temperatures. Figure 5 shows the unit’s sulfur emissions
(red curves) before and after the solvent swap, and the solvent temperature (blue curves). The results show that, with MDEA, a modest 3°C (5°F) increase in solvent temperature caused SO2 limits to be exceeded. Additionally, they indicate that the unit was operating very close to maximum capacity. In contrast, using JEFFTREAT ULTRA, a 13°C (24°F) increase in solvent temperature led to a minimal change in the SO2 concentration. Overall stack SO2 decreased from 60 to 80 ppmv to approximately 40 ppmv.
The carbon intensity of the SCOT unit was also reduced by 54% as a result of 30% lower circulation rates and, with no drop-in absorption capacity, eliminating the need to chill the JEFFTREAT ULTRA solvent.
Moreover, with greater demands now being placed on shared refinery cooling systems, particularly during extreme heatwave events, the fact that deploying SCOT ULTRA technology can remove the SCOT unit from the cooling equation through a simple solvent swap helps to strengthen the resilience of the wider system.
By performing the simple solvent swap, the US refinery was also able to remain within SO2 limits. Figure 6 demonstrates how the same SCOT unit performed before and after swapping the MDEA solvent for JEFFTREAT ULTRA in the cases of similar H2S spikes (yellow lines that go beyond the analyser limit in both cases). In the MDEA case, SO2 (red curve) quickly exceeded the limit, resulting in the operator having to shut down the unit until the upset could be resolved.
After dropping in JEFFTREAT ULTRA, and despite the longer duration of the H2S spike, SO2 emissions remained well inside the limit, thus giving the refiner time to resolve the issue without the need to reduce throughput or shut the unit down.
In a cash-constrained, decarbonising world, it is important to select proven technologies that can help to reduce the carbon intensity of refineries and gas processing units, as well as meet stringent SOx specifications.
Figure 5. Swapping in JEFFTREAT ULTRA increases temperature resilience and sulfur recovery compared with conventional MDEA solvents.

SCOT ULTRA technology enables the reactor section of a SCOT unit to operate at lower temperatures (less energy for heating), and the absorber section to operate at higher temperatures and capacity (less energy for cooling and circulation). This enables greater resilience to upset and cooling challenges, and the flexibility to handle turndowns, changing crude slates and upstream gas composition.
1. SCOT is a Shell trademark.
Figure 6. Using JEFFTREAT ULTRA enables SO2 emissions to remain well within limits, despite a prolonged H2S spike.
2. The modelled scenario is a Middle Eastern gas plant with a high ambient temperature, a lean acid gas feed to the SRU (54 mol% H2S, 34 mol% CO2, trace hydrocarbons and the rest water), a 250 tpd sulfur capacity and the need to achieve 99.9% sulfur recovery.

In order to extract pipeline-quality natural gas fuels from acid gas reserves, a processing plant must start with gas sweetening – separating the sweet gas from the acid gas. Byproducts of gas sweetening, or amine treating, are the gaseous forms of hydrogen sulfide (H2S) and carbon dioxide (CO2) – atmosphere pollutants that will negatively impact the quality of local and global environments should they be released directly.
A refinery can minimise its environmental impact while meeting governmental standards through the optimal
application of the Claus process. Unlike other gas purification processes, the primary goal of the Claus process is the recovery of elemental sulfur from acid gas streams containing high concentrations of H2S rather than yielding grades of fuel. The downstream benefits of an effective sulfur recovery unit (SRU) cannot be overstated in both protecting and extending the longevity of heat exchangers, ducting, and other valuable equipment prone to acid attack, as well as mitigating the environmental impact of energy production. Modifications to the Claus process, such as a
 Alexandra Markle, Blasch Precision Ceramics, USA, lists the performance benefits of discrete temperature zones in a Claus reaction furnace.
split medium and low-pressure flow, as well as configurations in the number of catalyst beds, are made with the goal of achieving a more complete conversion of sulfur and other species into more desirable compounds.
Due to the multitude of possible species and potential reactions that occur through a Claus furnace (upwards of 300), it cannot be simulated completely using computational fluid dynamics (CFD). Researchers must make several simplifying assumptions and are unable to assume equilibrium because many reactions will continue to occur through the waste heat boiler (WHB) and out of the furnace. The 1993 study by Monnery and Moore demonstrated that equilibrium calculations were inadequate in predicting the product distributions exiting the thermal reactor.1 Because of the limitations with equilibrium models, the bulk of this article’s discussion of the kinetics will centre around the benefits experienced as a result of using the Blasch Vector Wall, relying on simulation data only as a secondary means of validation. The primary scope is observations and testimonials of SRU operators, and the proposed fundamentals of thermodynamics and chemistry that support observed results.
Over 8 million t of elemental sulfur was produced in 2011, the majority of which was as a byproduct of petroleum refining, natural gas processing, and coking plants.2 Historically, the price per ton has been low. However, sulfur has been experiencing massive fluctuations recently, from as low as US$84/t in February 2020, to the value of US$720/t in June 2022.3
There are several processing steps in the recovery of sulfur from gasification processes, the first of them being acid gas removal (AGR). This sulfur-rich gas, containing a mixture of primarily H2S and CO2, serves as the feed gas in an SRU, where it will first undergo sub-stoichiometric combustion, followed by secondary and tertiary reactions with conversion rates determined by temperature and contact time between particles. As mentioned, hundreds of species of reactions occur through a Claus unit, however the 14 most relevant are compiled to the left. After thermal cracking, which removes approximately 60% of the available sulfur, the process gas is then cooled through a WHB, before being routed through catalytic reactors to precipitate the remaining 39.9%. The final step of the process gas is the tail gas unit (TGU), where a thermal reactor combusts what little remaining contaminant is left, and exhausts below the maximum ppm.
SRU operators understood that efficiency could be increased with additional mixing, and hoped to achieve this through incorporating choke rings and checker walls into their thermal reactors. These technologies, while providing some additional back mixing, result in a broad residence time distribution with some particles back mixing, while others travel straight through. To achieve more desirable results, Blasch developed a system that provides both superior mixing, as well as radiant shielding of equipment downstream.
The first generation of vector tiles by Blasch were designed to provide additional fluid mixture through a thermal reactor unit. By placing a matrix of independently-positioned channels through the cross-section of the furnace, flow bias and the resultant residence time distribution can be controlled. The process benefits experienced by more conformity in particle path lengths are more complete reactions and higher percentage yield of desired precipitants. Field results indicate that the furnace experiences two discrete temperature zones: the hotter zone upstream of the vector wall, closest to the burner; and the cooler zone closest to the WHB.
Because the flame is prevented from directly impinging on the refractory-lined front of the WHB, both the service life of the WHB and the lifetime of the ferrules are extended.
The first chamber promotes back mixing and combustion, as radiative heat is concentrated to the front of the furnace rather than against the WHB. This results in the first chamber being substantially hotter than the rest of the reactor, and the temperature required for ignition is achieved with increased efficiency.
After the vector wall, the most common tile arrangement results in a flow that spirals along the length of the furnace. This spiral has two notable effects on the quality of the reaction: it allows for a more precise residence time distribution, and introduces a longer path length for any length of thermal reactor. In sub-stoichiometric reactions, slow-to-react species require a minimum time in contact in order to achieve complete conversion. With an increased path length and added variability, the probability of a more complete conversion increases as well.
Through the first generation of vector tiles, it was observed that the vector wall was unintentionally acting as a heat shield for the tube face of the WHB. This effect was further improved through the third generation of vector tiles, with a geometry that produced a tighter turn, as well as completely shielding the WHB from the radiative effects of the burner.
The third generation of vector tile is defined by the complete ‘hood’ geometry. It can be used in conjunction with, as an alternative to, or to replace existing first-generation tiles. This allows for each SRU to be designed to its specific process conditions, with desirable levels of mixing and temperature shielding achievable through the modularity of a mixture of tiles, tile arrangement, and ability to direct the flow through the thermal reactor.
As the temperature of a flame increases, so does the spectral energy density, i.e. the effects of radiative heat increase dramatically. The WHB face is protected from direct flame impingement by refractory material, but this material’s life is greatly reduced with increasing extremity of its environment. Decreased life results in increased cost and shorter campaign lengths. An SRU can be run more productively in a two-zone configuration because of the less extreme temperature experienced in the second
We know the equipment. We understand the processes. We deliver the reliability, safety, and value you need to succeed

Rotoflow, an Air Products business, continues to transform the hydrocarbon, LNG, petrochemical, industrial gas, and energy recovery markets with turbomachinery that powers the world’s most efficient processing facilities.


Our world-class support is growing with the addition of new service facilities, capabilities, and team members to support and service turbomachinery from nearly any manufacturer while meeting the needs of customers around the world.
Whether you need new equipment, installation and commissioning, maintenance and repair, or overhauls and upgrades, Rotoflow is here to help you keep your operations running at their best.


Experience more. Together.

stage, while still achieving the temperatures needed for the initial combustion.
CFD demonstrates this phenomenon with two simple temperature plots: one prior to the Blasch Vector Wall, and one directly after.
The reactions that occur through the thermal reactor can be divided into three parts: oxidation, pyrolysis, and the competing reactions. Oxidation occurs when H2S and ammonia (NH3) combust in an oxygen-rich environment. This is followed by pyrolysis, where the H2S and NH3 are thermally cracked under anoxic conditions. The final and slowest species of reactions occur the deepest into the reactor, with the conversion rate determined by the quality of mixing.
Temperature, or thermal energy, is only part of the necessary conditions for complete conversion; the reaction will only occur should local concentrations of all constituents exist as well. Therefore, it can be inferred that an increased number of particle collisions directly increases the probability that a specific concentration will exist at a time in the reaction furnace. In other words, turbulent mixing inside of the thermal reactor is crucial to ensuring efficiency in a system.
By creating a furnace with an initial zone that isolates the burner from the WHB, an environment exists that
promotes both oxidation and pyrolysis. This allows for the back end of the furnace to be dedicated to promoting more complete reactions through additional mixing and contact between available species. This, paired with the tighter residence time distribution, allows for greater control and efficiency in SRU operation.
The furnace directly accounts for only 50 – 60% of the sulfur recovered through the Claus process; however, the furnace performance drives efficiency of the catalytic reactions downstream.4 Incorporating a Blasch Vector Wall into a thermal reactor creates an environment that is beneficial to the kinetics involved in the Claus process. The two stages aid oxidation and pyrolysis in the front, and the slower competing reactions through the back. The radiant shielding provides another benefit of extending the life of the WHB and refractory material that lines its front face.

1. PIERUCCI, S., RANZI, E., and MOLINARI, L., ‘Modeling a Claus Process Reaction Furnace Via a Radical Kinetic Scheme’, Computer Aided Chemical Engineering, Vol. 18, (2004), pp. 463 – 468.
2. ‘Sulfur Recovery’, EPA, https://www.epa.gov/sites/default/ files/2020-09/documents/8.13_sulfur_recovery.pdf
3. Sulfur Price, https://sulfur-price.com/
4. NABIKANDI, N. J., and FATEMI, S., ‘Kinetic Modeling of a Commercial Sulfur Recovery Unit Based on Claus Straight Through Process: Comparison with Equilibrium Model’, Journal of Industrial and Engineering Chemistry, Vol. 30, (25 October 2015), pp. 50 – 63.
Bulk of radiant trapped in front zone
Hotter here
Solid perimeter for backmixing - same as choke ring
Tight residence time distribution
Cooler here
More complete Ammonia Destruction/increased capacity to process NH3 if desired
More complete Ammonia Destruction/increased capacity to process NH3 if desired
Better BTEX Destruction
Better BTEX Destruction
Better protection for tubesheet refractory/cooler temperatures going into WHB
Better protection for tubesheet refractory/cooler temperatures going into WHB

Spiral
Spiral creates much longer “contact pathway”, or overall distance in close contact to react, even with lower temperatures here
Increased velocity and temperature carried to tubesheet
Broad residence time distribution means insufficient RT for some of the reactions
More efficient use of furnace volume means increased capacity
More efficient use of furnace volume means increased capacity
Better mixing and longer distance together mean more complete reactions
Better mixing and longer distance together mean more complete reactions
Lower energy costs when co-firing or in tail gas incinerators
Lower energy costs when co-firing or in tail gas incinerators
No more fireflies at furnace exit
No more fireflies at furnace exit
Increased capacity
Increased capacity
Lower Pressure drop compared to baffles
Lower Pressure drop compared to baffles
o learn more about the Blasch VectorWallTM and its benefits, contact Tim Connors, Senior Market Manager-Energy & Chemicals at tconnors@blaschceramics.com or by phone at 518-436-1263 ext 105.

benefits, contact Tim Connors, Senior Market
or by phone at 518-436-1263 ext 105.
Gas treating is required for the removal of contaminants and components from raw sour gas streams in order to meet the required specifications in the product streams. This is achieved through the combination of different process units, and an optimal design considers the integration of all units.
For both case studies that will be discussed in this article, there was a requirement to remove hydrogen sulfide (H2S), carbon dioxide (CO2) and mercaptans from the sour gas, and to produce sales gas, sulfur and CO2 export streams. Key decisions included the selection of the locations for the removal of CO2 and mercaptans, and the most suitable technologies to be used in the acid gas removal, acid gas enrichment, and sulfur recovery units (SRUs). The assessment was based on many factors, including capital and operating costs, layout, constructability, certainty of performance, operability, turndown, hydrocarbon losses, safety, and emissions.
The key to a good design is an accurate definition of the feed composition, contaminants and products, including the required specifications and export conditions. In many cases it is the contaminants that control the selection of the units.

Table 1 shows the acid gas components that are present in the Case 1 feed stream, and Table 2 shows the required product and emission specifications. The Case 1 feed was 1600 million standard ft3/d at 80 bara and 25°C.
The first step for Case 1 was to consider the location for CO2 recovery. Figure 1 shows the three options considered for CO2 recovery for Case Study 1. Option 1 has a combined AGRU/CO2 recovery unit, using a chemical solvent. CO2 and H2S are removed from the sour gas in the same unit to meet the required gas specifications. An acid gas enrichment unit (AGEU) in the acid gas from the acid gas removal unit (AGRU) is
Fiona George and Gerrit Bloemendal, Comprimo, provide an overview of how to select the optimum design for an onshore gas processing plant.
required to recover CO2 and concentrate the H2S in the feed to the SRU.
Option 2 considered a high-pressure AGRU with a selective solvent to preferentially remove H2S with either a high-pressure solvent based or a two-stage membrane CO2 recovery unit downstream. Although the AGRU solvent in this option had high H2S selectivity, the level of CO2 removed is higher than needed, and the acid gas stream still required an AGEU to concentrate the level of H2S in the feed to the SRU.
Option 3 has a two-stage membrane CO2 recovery unit upstream of a solvent-based AGRU. Whilst the size of the AGRU is reduced, this option required multiple AGEUs to concentrate the H2S and recover the CO2


Option 1 with the combined AGRU/CRU was the recommended option for CO2 recovery because it has the smallest equipment count and layout, only one high-pressure absorber, and the lowest CAPEX and OPEX.
The next step was to consider the location for mercaptan removal. Figure 2 shows the two options considered for mercaptan removal for Case 1. A molecular sieve unit is required downstream of the AGRU to remove water and heavy hydrocarbons in order to meet the required sales gas, water and hydrocarbon dewpoint specifications.
The sour feed to the plant contains approximately 100 ppmv mercaptans, which need to be removed in order to meet the overall sulfur specification. Two options were considered for mercaptan removal. Option 1 is based on using a formulated chemical solvent in the AGRU and removing mercaptans in the molecular sieve unit. The molecular sieve regeneration gas contains heavy hydrocarbons, water and mercaptans. Water and heavier hydrocarbons are knocked out by cooling, but a physical solvent treatment unit is required in order to remove the mercaptans from the regeneration gas. Option 2 considers removing the mercaptans in the AGRU, using a hybrid solvent.
The AGRU for Option 1 had a significantly lower solvent circulation rate, reboiler duty, and CAPEX and OPEX. There is uncertainty surrounding both the level and distribution of mercaptans in the sour feed to the plant. Option 1 is a more robust design, as the molecular sieve will be able to handle these variations. Option 1 with a chemical solvent and mercaptan removal in the molecular sieve unit was the selected option.
The final step for Case 1 was to select the most suitable option for sulfur recovery. Option 1 with EUROCLAUS and


Our large range of technology solutions ensures our customers keep their costs low, reduce their carbon footprint and meet or exceed their sulphur recovery targets.
Learn more with one of our experts email: comprimo@worley.comOptimize capacity
caustic scrubbing typically has fewer items of equipment and a lower CAPEX, but has higher chemical consumption and caustic waste. Although the removal efficiency is well above 99.9%, the recovery efficiency is only 99.3%, as the sulfur is not recovered to elemental sulfur, but removed from the gas stream, producing a liquid waste stream (see Figure 3).
Option 2, the formulated amine-based tail gas treatment unit (TGTU) option, can achieve over 99.9% sulfur recovery and more than 99.9% sulfur removal efficiency, as the sulfur removed from the gas streams is recovered as elemental sulfur.
For both options, due to the fact that the acid gas from the AGRU contains a low ratio of H2S/CO2, an AGEU is required to maximise the recovery of CO2 and to concentrate the H2S in the acid gas to the SRU to avoid co-firing. The recommended solvent was a sterically-hindered solvent as it had the lowest circulation rate, heating duty, CAPEX and OPEX. This same solvent can be used in the TGTU and therefore a common regeneration system can be used, reducing the number of items of equipment required, and therefore the CAPEX. Option 2, a two-stage SRU and TGTU with the same solvent as AGEU and common regeneration, was the recommended option.
The recommended options for Case 1 were:
n Single AGRU using a chemical solvent to remove H2S and CO2 from the sour gas.
n AGEU using a sterically-hindered amine to recover CO2 in order to meet the required CO2 product specification, and concentrate the H2S in the acid gas to the SRU.
n Molecular sieve selected for dehydration and heavy hydrocarbons and mercaptan removal.
n Physical solvent treatment unit to remove mercaptans from the regeneration gas so that it can be routed to sales gas.
n Two-stage SRU and TGTU – same solvent used in AGEU and TGTU, so a common solvent regeneration system can be used.
Table 3 shows the acid gas components present in the Case 2 feed stream, and Table 4 shows the required product and emission specifications. The Case 2 feed was 1000 million standard ft3/d at 35 bara and 25°C.
Similar to Case 1, the first step for Case 2 was to consider the location for CO2 recovery. For this case, three locations for carbon capture can be identified (see Figure 4).
Option 1 has two steps within the AGRU: first removing the H2S selectively, and then removing the CO2 (see Figure 5).
To achieve high selectivity at elevated pressure, the most selective amine available must be chosen, and the solvent circulation must be minimised. Additionally, to improve the selectivity, the solvent must be made as cold as possible, requiring extensive chilling. As a consequence of the minimised solvent circulation, the adsorption of mercaptans will be limited, thus passing them to the mole sieve unit. The mole sieve unit would then require a dedicated regeneration gas treater with a substantial additional equipment count.
After the H2S removal, the CO2 would still be very dilute in a large hydrocarbon gas flow, making this high-pressure absorber an expensive piece of equipment (high pressure, large diameter, stainless steel or clad). Since there were too many uncertainties (mainly on the selectivity of the H2S removal), and given that this option would require the CO2 absorption to be online all of the time to meet sales gas specification, this option was rejected.
Option 2 considers CO2 recovery downstream of the TGTU when the TGTU solvent is hydrogenating/amine-based. If total acid gas removal is considered, the acid gas from the AGRU will contain between 60 – 70 mol% H2S. Considering the relatively large amount of acid components that need to be removed, solvent circulation is substantial. In this scenario it is best to use a hybrid solvent such that mercaptans are also adsorbed in the AGRU. For such

gas
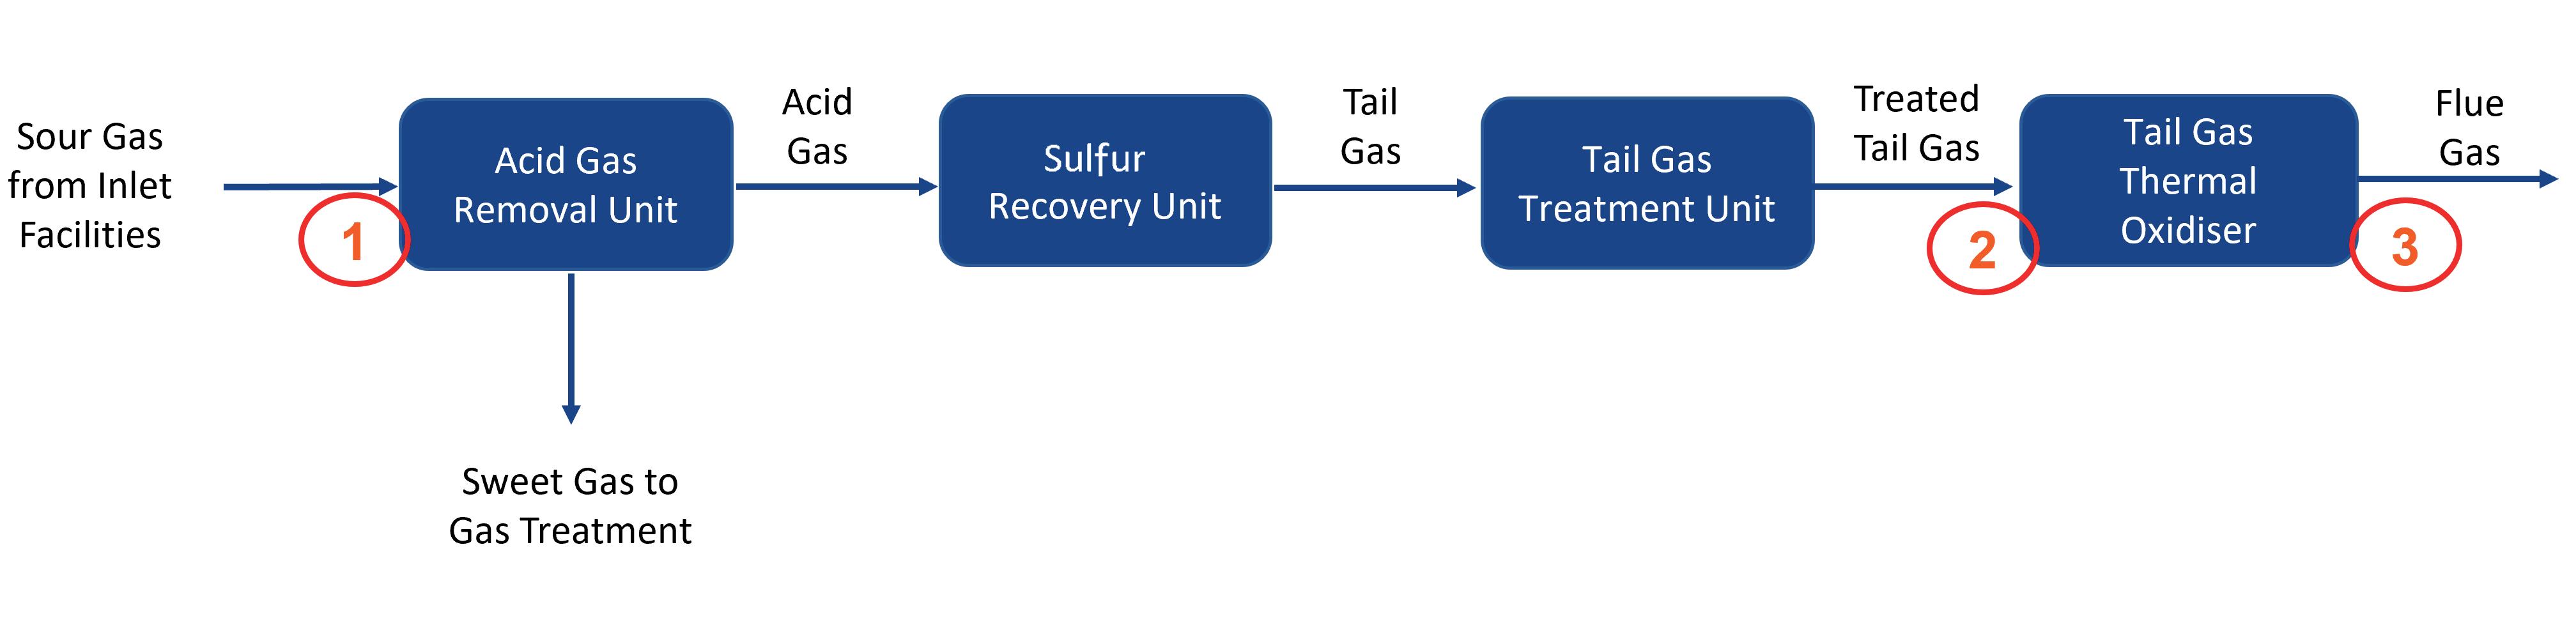
enrichment is typically not required, and the acid gas can be routed directly to the thermal stage of an SRU. The SRU can be air blown, but this will result in a substantial dilution of the CO2 by the nitrogen from air, making it difficult to absorb the CO2 downstream of the TGT absorber. Alternatively, the SRU can be fired with pure oxygen, resulting in a TGT off-gas stream that contains more than 70% CO2. This will substantially reduce the cost of the SRU/TGTU, as the equipment can be made much smaller, but comes at the cost of making pure oxygen, which requires an air separation unit. In this scenario, CO2 can be removed either with conventional amine-based technology, or with a cryogenic system. After the CO2 is removed, the remaining gas is nearly pure hydrogen which, with some additional cleaning steps, can be recovered as a valuable byproduct.
Another option is to recover the CO2 downstream of the thermal oxidiser. To do this, the gas from the thermal oxidiser has to be cooled and quenched to 55°C (typically). Since traces of sulfur trioxide (SO3) can be present, the gas is very corrosive, and a quench venturi/caustic scrubber needs to be applied. Depending on the SRU technology used (e.g. EUROCLAUS or SUPERCLAUS), the SO2 content in the flue gas can be several hundreds of ppmv. This SO2 has to be removed before the gas can enter the CO2 absorber by adding caustic to the quenching liquid. Otherwise, the SO2 will end up in the CO2 product and the CO2 specification cannot be met. This quench system is considered to be very expensive, but in combination with EUROCLAUS/SUPERCLAUS it more or less balances out with Option 2. However, considering the amount of sulfur produced and hence the amount of SO2 that needs to be
scrubbed, the cost and effort for continuously handling caustic becomes prohibitive. For these reasons, this option is not further considered for this case.
The recommended options for Case 2 were:
n AGRU using a hybrid solvent such that not only H2S and CO2 are removed, but also the bulk of the mercaptans. With this solution, the mercaptans from the mole sieve enter the SRU in a gradual flow, and large peaks are avoided.
n A mole sieve unit is considered for both dehydration and deep mercaptans removal. The regeneration gas from the mole sieves is compressed and recycled to the front end of the main absorber.
n The SRU/TGTU will be operated with pure oxygen, such that the TGTU off gas contains only water, CO2 and hydrogen, with traces of CO and carbonyl sulfide (COS), all within the required CO2 gas specification. The hydrogen can be recovered as a high-value product. If the hydrogen is not recovered, it can be burned in the thermal oxidiser, which reduces fuel gas requirement.

The two examples of gas field developments show the importance of understanding that the optimum design is dependent on feed and product specifications. As no feed is the same, no design should be the same. It is important to consider the implications of the selected design of one unit on all of the other units. It is also important to consider the impacts of changing compositions, rates and conditions throughout the lifetime of the plant to ensure future-proof, successful plant operations.

The hydrocarbon processing and refining industries have seen numerous advancements in process efficiency, maximising product quality, and meeting both environmental and workplace guidelines set by regulators globally. However, striving to maintain or improve upon these conditions has often come with its share of complications. With hydrocarbon processors striving to meet the production levels seen prior to the pandemic, and hydrocarbon-based products still witnessing relatively high demand, facilities need to maintain peak operating conditions. However, these conditions will not always be commonplace, as process upsets and sample changes can cause unplanned downtime, reducing production.
Process analysers have become a quintessential measurement tool for monitoring process and refining conditions, and their existence over the last 60+ years has seen just as much advancement as the hydrocarbon industry itself. With new industry and regulatory standards came new opportunities for developments in analyser technology and integration. This has included improvements in materials, electronics, and optical component sensitivity, as well as onboard communication systems and software design. The culmination of these iterations has led to more reliable analysers, which also require less in maintenance (reducing costs), and greater options for process monitoring.
As crucial as they are, it is important for the user – and analyser manufacturer – to not only have the right analyser for the job, but one that can perform across a variety of process and environmental scenarios. The user should specify the analysers with an understanding that they are being given a quality product, and that they will rarely need to operate the unit from their own end. While no one analyser is perfect for all possible applications, seeking to design an integrative platform that addresses user concerns should be paramount. The utility of an analyser should be addressed over a variety of factors, and through detailing these elements – and where it can improve certain industry processes – it is possible to aid users in deciding which analyser best suits their needs.
One fundamental starting point in the selection of an analyser is deciding what chemical the user needs to measure. Depending on both the atomic structure and molecular characteristics of the chemical, detection will require an analyser with the appropriate measuring wavelengths. This ultimately decides which optical components and light

Harry Burton, AMETEK Process Instruments, USA, discusses how integrated analyser platforms can address common hydrocarbon processing and refining challenges.
spectrum the unit will need to include for successful operation. Within the hydrocarbon industry there exist several optics-based analyser platforms that have become standardised for field measurement, including: ultraviolet (UV), visible (vis) and infrared (IR) spectrometers, gas chromatographs (GCs), mass spectrometers, and tunable diode lasers (TDL). While this section will not cover each platform in detail, it will discuss the basic methodologies of these techniques and the known advantages and disadvantages of each of these systems. By doing so, this will help the reader assess what analyser platform may be best suited for their needs.
GCs have become widely prolific for petroleum fluid analysis, as their price point, ease of use, and decreasing dimensional footprint became more suitable for industry markets over time. In terms of operation, it starts with a liquid sample (stationary phase) being placed in a separation column. This sample is then heated via an oven, which causes its molecular constituents to vaporise. These then distribute themselves along the column. Molecular separation is largely influenced by the vapour pressure of these molecules, as well as their affinity to remain stationary when a mobile carrier gas (mobile phase) passes over its surface. When an unreactive carrier gas such as helium or hydrogen is introduced into the system, it strips and pushes the vaporised molecules from the column to the detector – normally a flame ionisation detector. This process is referred to as ‘elution’. The resulting spectral graph, called a chromatogram, relays this information as the detector response time in the y-axis, and retention time along the x-axis. The concentration of the molecule can be determined through integration techniques.
Through technological advancements, GCs later became paired with mass spectrometers (MS). An MS seeks to measure the mass-to-charge (m/z) ratio of ions that meet its detector, with higher concentrations of a given sample producing more ions, which leads to higher intensity levels. MS units work best when dealing with molecules that have already been separated, hence why they are used in tandem with a GC. Through either electron or chemical ionisation, these newly-separated ions are then detected via similar ionisation detectors, and sorted by their molecular weight. The molecules present in the spectrum are determined through a machine algorithm,
which compares their recorded mass spectra to existing spectral libraries. The National Institute of Standards and Technology (NIST) is a commonly-used reference library, though interpretation of the spectrum is also possible with other well-sampled data libraries.
A limitation of GCs is that the elution process can only separate volatile molecules. This would exclude chemicals that are commonly found in process samples, such as carbon monoxide (CO) or carbon dioxide (CO2). CO2, in particular, is utilised predominantly in injection wells and is a strictly-regulated chemical in many countries.

At times, insufficient chromatographic separation can occur, whereby certain molecular peak responses cannot be well distinguished from one another. This is one of the reasons why MS analysers are used in conjunction with GCs, as they can help resolve overlapping ionisation peaks. GC-MS units can also measure within the ppb concentration range, which is especially useful for capturing trace emissions.
For either method, depending on the temperature needed for separation, data collection for each component can take several minutes to half an hour. This can be problematic for applications that require process observation in real time, such as workplace and environmental safety. There is also the possibility that fewer qualified technicians may face challenges when discerning the measured spectra or operating the GC-MS.
Tunable diode laser absorption spectroscopy (TDLAS) has become a notable player in the modern natural gas, petrochemical, and steel production control industries. TDLAS systems monitor process gases in the near-infrared (NIR) and IR spectral ranges due to the amount of molecular absorbance lines within that spectral regime. These molecules have both a rotational and vibrational (rovibrational) response to IR energy stimulation, and through this behaviour, multiple absorbance lines exist for measurement. The advantage of TDLAS is that it can selectively isolate these peaks due to the monochromatic light of its diode laser. This system starts with the process gas being excited by a diode laser that has an emission (light) wavelength capable of triggering this rovibrational response. Wavelengths that were absorbed by the molecule then appear as a spectral response on the detector. By varying the temperature and driving current of the diode, the wavelength of the diode laser can be shifted by as much as 1 – 2 nm.
Three key attributes (benefits) of TDLAS include its degree of specificity for detecting the analyte, its high sensitivity, and a fast response speed. TLDAS’ specificity is the result of the extremely high spectral resolution. Emission
bandwidths for TDLs are on the order of 10-4 – 10-5 cm-1, which results in the ability to isolate a single rovibrational transition line of an analyte species. A second advantage of TDLAS is its ability to rapidly tune the lasers, so techniques such as wavelength modulation spectroscopy (WMS), which yield dramatic sensitivity enhancements
Figure 1. A Claus unit.


over a direct absorption approach, are easily implemented. Because TDLAS is an optical technique, it also offers a very fast response speed.
TDLAS measurements can be performed in-situ, where the sample is probed directly from the process or through extractive measurement, the latter entailing the use of a multi-pass cell of a certain pathlength. Multi-pass configurations can increase the absorbance response of the analyte of interest by several times, altering the minimum measurement ranges down to the low ppm or ppb scale. This is also what makes TDLAS worthwhile for trace gas emission detection. A major drawback of TDLAS systems is their limited application usage. TDLAS only works with lighter gases with resolved rotational structures, which heavier hydrocarbons (containing 4+ atoms) or liquids do not have. TDLAS typically measures water (H2O), ammonia (NH3), methane (CH4), hydrogen sulfide (H2S), oxygen (O2), hydrochloric acid (HCl), and CO/CO2. With regards to multi-pass TDLAS systems, extending the pathlength to the order of hundreds of meters can increase sampling time, which can limit its applicability for safety-focused applications that require quick response times. Other hindrances to TDLAS include process scenarios with sudden temperature/pressure swings, which can cause refractive index changes in the sample. This causes the laser beam to redirect, reducing signal quality to the detector.
UV light largely defines wavelengths of less than 450 nm. Absorbance spectroscopy in this region benefits from UV-absorbing molecules seeing little to no interference from lighter hydrocarbons, in addition to CO2 and water. In the past, mercury or cadmium lamps were used to emit light in low UV (sub 350 nm). However, modern advancements have allowed for the implementation of light-emitting sources such as Xenon flash lamps, which have wavelengths encompassing both the UV and visible spectrum (visible being between 450 – 780 nm).
UV-emitting LEDs are also becoming increasingly available on the market, and can serve as low-cost alternatives for niche UV applications. The IR spectral regime lies beyond 780 nm and opens up opportunities for absorption line measurements for heavier hydrocarbons, including CO, CO2 and water. These absorption lines can be selectively chosen for measurement using a bandpass filter – a common practice for non-dispersive infrared (NDIR) sensors.
With UV, visible, and IR spectroscopy, many of the operating mechanisms required to measure in these spectral regions are conceptually equivalent to that of a TDLAS system. Put simply, one would need an illumination source, a sample cell to house the process material, and a detector. The relative simplicity in this design is why these spectroscopy techniques are one of the most prominently used methodologies for process detection. These techniques also encompass the widest variety of applications, which are not just limited to the hydrocarbon industry. Sourcing parts and components for these spectrometers is generally simple as well. Online monitoring is another worthwhile benefit of these
spectroscopic analysers, and ensures that process samples are not disturbed. This allows for a pure sample measurement to be made with a fast response time (typically 1 sec.), which is useful when monitoring especially-hazardous process constituents.
A common flaw associated with these analysers, however, is their low sensitivity ranges compared with other techniques. Detection limits are typically within the ppm range, with smaller detection ranges requiring costlier detectors, specially-tuned emission sources, or molecules with higher molar absorptivity. Sample calibration is also a common requirement, as electronic drift and sample changes will cause these analysers to deviate from their intended measurement ranges.
There are several advantages and disadvantages to the analyser types that have been listed. For users that have process components whose spectral response encompasses a variety of spectral ranges, it is worth purchasing a platform that can integrate multiple optical approaches into its design. One example of this would be AMETEK’s IPS-4 Integrated Photometric Spectrometer. This analyser incorporates the Xenon flashlamp, allowing for measurements across much of the UV/vis spectra. It can also operate in a dual-bench configuration, enabling component measurement in the IR as well.
IR measurement is facilitated using a non-dispersive, steady-state emitter, with wavelength selection being obtained through bandpass filters. In either bench configuration, UV/vis or IR, this analyser can measure up to eight sample components in a temperature-regulated enclosure.
To understand how choosing the right analyser can have an impact on process and refining performance, it is important to consider the specific challenges that are common within the sulfur recovery unit (SRU) industry and for petrol manufacturers, and showcase how a complete analyser can help in overcoming these hurdles.
For SRU facilities, there can be a multitude of compounding issues that must be mitigated to maximise elemental sulfur yields. These facilities often rely on the Claus process technique (see Figure 1), which has been known to recover as much as 95 – 97% of elemental sulfur. One common cause for drops in this efficiency can be attributed to an incorrect air-to-fuel ratio during ignition. Normally, it is desirable to reach H2S:SO2 stoichiometric ratios of 2:1 – although 3:1, 4:1 and even 5:1 are occasionally being seen – in order to maximise sulfur production, with oxygen helping to maintain this ratio throughout the process cycle.
Analysers in the Claus system are meant to adjust the amount of oxygen needed, based on the concentration levels of H2S and/or sulfur dioxide (SO2), but sudden concentration variations in the incoming gas can lead to oxygen imbalances.
Applications that benefit from the integration of multiple measurement technologies
Managing all the processes in a sulfur recovery unit (SRU) is arduous work—demanding skill, concentration, and dedication through every shift. Fortunately, the reliability, accuracy, robust design, and operating ease of AMETEK analyzers can make that tough work a little easier. AMETEK engineers have been designing industry-standard SRU analyzers for decades, and that shows in the products’ accuracy, reliability, and longevity.
Because we make analyzers for every part of the process—from acid-feed gas to tail gas to emissions, including the gas treating unit, sulfur storage (pit) gas, and hot/wet stack gas you get the convenience of one source for unparalleled engineering and support for all your analyzers, while your operators benefit from consistent interfaces and operating procedures.
For decades, we’ve been dedicated to making your SRU operation the most efficient it can be for the long term. Learn more at www.ametekpi.com/SRU.

Sulfur recovery unit workers have a lot to worry about. Analyzers shouldn’t be one of them.
Another concern with feed forward control is an overabundance of heavier hydrocarbons, due to spillover. At high temperatures, these molecules will easily react with oxygen being supplied to the furnace. This leads to the formation of water vapour, hydrogen (H2), CO and CO2, as can be seen below with CH4:
CH4 + O2 → CO2 + H2O
CH4 + H2O + O2 → CO + H2 + CO2
While H2S may stay elevated during this time, SO2 will see a fall off due to poor oxygen presence. When condensers expect to see a set amount of SO2, which is not present (due to reduced yields), this leads to a run-off in SO2 through the catalyst. This poses a significant risk to the scrubber media, as the presence of SO2 could trigger acid corrosion as it makes its way to the tail gas treatment unit (TGTU).
Given that these circumstances can have a substantial impact on potential elemental sulfur sales and process infrastructure, it is important to have an analyser that is capable of monitoring H2S along with varying C1+ molecules. Such an application showcases the benefit of utilising a dual-bench UV-vis/IR approach on process measurement. The H2S is measured by the UV bench, and the heavier hydrocarbons are analysed within the IR bench. If multiple analytes require monitoring, an analyser that can provide multi-component analysis can act as both a practical and economic investment for the user.
The production of petrol-based commodities, such as refined oils, traditionally calls for the removal of as many heavier hydrocarbons as possible through distillation and cracking. This is necessary to ensure that the quality of the product (i.e. its selling value) is maintained. On occasion, these stored products (such as kerosene) may be subjected to contamination, or the product itself will show signs of degradation. Outside of storage, petrol discolouration from the norm can also signal signs of process upsets that taint the material. This behaviour of colour alteration opens a path for analysers to measure petrol product quality.
To better understand how colour works here, let us look at two common categories of hydrocarbon-based materials: aliphatics and aromatics. Aliphatics are derived from oils and/or fats and are hydrocarbons that have both hydrogen and carbon atoms linked via single, double or triplet bonds. This would include alkanes (e.g. methane), cycloalkanes (e.g. cyclopentane), alkenes (e.g. ethylene) and alkynes (e.g. propyne). Aromatics generally display flat, ring-shaped molecular structures with π-bonds that give them higher molecular stability. This type of hydrocarbon includes benzene, toluene, styrene and phenol. Figure 2 demonstrates the differences between aliphatic and aromatic structures.

Both types of hydrocarbons exhibit differing spectral properties in the UV/vis and near-IR range, with aliphatics existing primarily in the UV regime, while darker-coloured aromatics exist in both the visible and near-IR spectrum. As colour consists of a multitude of wavelengths, and the absorbance response of colour is wavelength-dependent, it is possible to exploit this behaviour for monitoring petrol quality. One common technique for evaluating the condition of these products is the use of the American Society for Testing and Materials (ASTM) colour standards, which would include Saybolt (ASTM D156) and ASTM (D1500) colour standards. ASTM D1500 scales are suitable for aromatics due to their darker colouration, while Saybolt is employed for lighter-coloured aliphatic products.
Colour scale units are used to represent the coloration of these hydrocarbon products. For example, Saybolt ranges from +30 to -16, though the colours that these units represent range from off-white to effectively clear. When the materials colouration lies outside of the intended colour range, this can be a sign of contamination or poor process refinement. A process analyser – such as the IPS-4 – can be calibrated in such a way that it can detect the absorbance response of a particular colour (at certain wavelengths) for real-time process quality assessment (in the UV/vis or near IR). This is performed by utilising known standards of colour representation (called tristimulus colour functions), which are representative of red, blue and green colouration. Through these functions, a link can be made between colour absorbance responses and its associated colour scale unit.
The diversity in hydrocarbon-based applications and products has necessitated the need for unique solutions in dealing with complications inherent to each process type, along with operating these facilities within industry and regulatory guidelines. To this end, process analysers serve as valuable instruments for evaluating product behaviour and detecting common process faults. Analysers that can implement multiple measurement technologies into their construction provide benefits such as a reduction in the total number of analysers required, reduction in spare parts, etc, thus reducing end users’ CAPEX and OPEX spending. Operators should consider using one of these advanced continuous sample analysers in future system designs and existing analytical system updates.
Aromatic and aliphatic molecular structure.In recent years in the gas treating world, much attention has been given to two application areas: deep carbon dioxide (CO 2) removal in LNG production, and selective hydrogen sulfide (H 2S) removal. Columns containing trays or packing have radically different mass transfer characteristics, and both are widely used. Reliably designing an acid gas removal column containing trays appears somewhat more straightforward than with packing, and the effect of parameters such as weir height, numbers of passes, etc. are fairly well documented.
In a packed tower, however, a discontinuous film flows over solid surfaces through a continuous gas, and mass transfer rates can be affected by packing size, packing geometry, and brand. With structured packing, even the surface treatment of the (usually) sheet metal used in fabrication can impact the column performance. The effects of liquid and vapour volume loading are not discussed in this article, as the focus is entirely on the powerful influence of packing geometry. Packing size almost directly correlates with the effective interfacial area.

Ralph Weiland, Nathan Hatcher and G. Simon Weiland, Optimized Gas Treating Inc., detail the effects of packing characteristics on gas treating absorber performance.
Packing geometry is unique to each packing brand of a given nominal size, although the dry surface area is still the primary controlling factor. Lowered confidence when designing for packing may in part be a consequence of such a plethora of sizes, shapes and physical structures that it can be difficult to assign even a meaningful size to a given packing, let alone quantify its mass transfer performance.
This article takes a close look at the performance differences between two structured packings supplied by different manufacturers as a function of crimp size, as well as between five different random packings, selected on the basis that each has a wide range of available sizes for comparison. Candidates that are representative of first, second, third and fourth generation metal random packings were selected for study. To avoid the implications of bias, none of the packings used are identified by brand or supplier. However, Generation 1 packings are typified by the classic Raschig Ring and most forms of saddles; Generation 2 by Pall Rings under various names; Generation 3 by what might be described as shortened Pall Rings; and Generation 4 by stamped and bent web-like packings. The hydraulic and mass transfer characteristics of each packing used are as specified by the manufacturer. Each succeeding generation is an improvement on the previous one, and each is intended to utilise the interior volume of the packing pieces more effectively; retain more uniform, stable, liquid distribution;


and produce lower pressure drop or higher capacity. First-generation packings replaced the broken glass, glass spheres, and pieces of stone or coke used in the mid-to-late 19th Century, and which had unpredictable efficiency and hydraulic behaviour. The authors are aware of an absorber packed with broken beer bottles in natural gas service in New South Wales, Australia, in the 1980s –this packing was certainly inexpensive and readily available, albeit perhaps not of the highest engineering standards.
The first case study relating to the performance of a CO 2 removal unit in LNG production was carried out using a water-saturated feed gas containing 2% CO 2 balance methane, at 100°F, and treated with a solvent containing 7 wt% piperazine in 38 wt% MDEA at 120°F. Gas and solvent rates, tower diameter (48 in.), and packed depth (30 ft) were kept constant throughout. In the second selective removal study, the raw gas was water-saturated methane with 10% CO 2 and 2% H 2S at 100°F, treated using 50 wt% MDEA at 120°F. Again, gas and solvent rates were kept constant between cases, with a 48 in. tower diameter and 20 ft of packing in each case. A system or foam factor was not applied to any calculation.
The range of packings used commercially for CO 2 removal in LNG production encompasses the whole spectrum of random packings, mostly from Generations 3 and 4, as well as structured packings of modest crimp size. The absorber performance of four random packings and two structured packings were compared in terms of (a) the CO 2 level achieved in the treated gas, and (b) the magnitude of the temperature bulge within the columns.
The desired CO 2 level in the gas resulting from CO 2 removal absorbers is usually < 50 ppmv. To ensure that they can meet the treated gas specification, absorbers in this service almost invariably contain a greater depth of packing than necessary, so they tend to be lean-end pinched. This means that the treated gas CO 2 content is controlled by the lean solvent loading (moles of acid gas per mole of total amine). In recognition of this fact, the various cases were all run with the lean solvent CO 2 loading set to a value that would comfortably produce gas with less than 50 ppmv CO 2
Figure 1. How packing type, style and size affect absorber performance in an LNG unit. Structured #1 and Structured #2 designate two different 45° crimp angle packings. Top: effect of specific area on CO2 in treated gas. Bottom: effect of specific area on peak temperature.
Acid gas removal using amines is quite exothermic, and usually generates high temperatures in the absorber. A rather large temperature bulge often forms. Its size and location are determined by the relative gas and liquid traffic in the column and, of course, by the exothermicity and rate of the chemical reaction between the acid gas and the amine(s). The magnitude of the bulge is an important parameter that must be controlled, because excessively high temperatures cause amine degradation, as well as corrosion of the tower shell and internals. The maximum recommended bulge temperature is usually approximately 185°F (85°C). Unfortunately, absorbers are rarely built with any provision for measuring temperatures anywhere inside the equipment, so often the best that can be done is to infer internal temperatures from simulation. A soundly-based simulator such as OGT | ProTreat® provides a highly-accurate assessment of
Register today for the Kurita Water & Environment event and meet our experts online in a day full of information on how industries can reduce water and energy consumption as well as waste generation, while improving their overall ROI. December 14th 9 to 3 PM (CET)
every detail of what is actually happening within the tower. This includes very accurate temperature profiles that can be used to ensure that solvent degradation and corrosion rates are known, and therefore kept within limits. The whole assessment can be fully automated when the simulator is connected to OGT | ProBot TM
Because packing shapes and structures vary so widely, packing size itself is such a nebulous, ill-defined quantity that it is unsuited for use as a basis for comparison between packings. What packings present to the gases and liquids flowing through and over them, however, is surface area. This seems like a much more promising parameter to use when making comparisons. Figure 1 compares packings on the basis of what is termed their specific area, which is the area of the dry packing per unit
of packed volume. Specifically, Figure 1 (top) shows that, in terms of actual treating, the four generations of random packing all have much the same performance, even when the column is not pinched, i.e. when performance is mass transfer rate-controlled. Equivalent mass transfer performance is probably a result of these generations of packing all granting pretty much full gas-liquid access to the interior of the packing pieces, and not just their outer shell – as would be the case with Raschig Rings (first generation).
The better performance of some packings over others is mostly the result of greater surface area. When mass transfer is rate limiting (not equilibrium pinched), these results suggest that random packings are somewhat better performers than structured packing, possibly because of lower back mixing. As Figure 1 (bottom) shows, however, random and structured packings appear to display equivalent peak temperatures when the < 50 ppmv CO2 treating goal is met.
Figure 2. Thermal image and digitised data measured at various positions across the column diameter. Data is measured skin temperatures, and was corrected for radiative, conductive and convective heat loss. Simulations were also run at solvent flows 2% higher and lower than measured, showing sensitivity to solvent rate.

What is potentially interesting is that the greater the specific area (faster absorption rates or more efficient packing), the hotter the temperature bulge. This is because small packings show lower axial dispersion (mixing) than large packings do. Practically, then, there is a lower limit to packing size just from a mass transfer performance point of view. Smaller, more efficient packings are likely to have higher temperature maxima, and solvent degradation and corrosion rates therefore tend to be more severe. Thus, when selecting packing, it might be better to do so on the basis of cost per unit of specific area, with enough area to achieve the treating goal but not so much as to cause excessive temperatures from the heat of absorption. Of course, this is predicated on achieving satisfactory hydraulic (flood and pressure drop) performance.


Figure 3. Thermal image and digitised data measured at various positions in the image. See Figure 2 for further detail.
Figures 2 and 3 are temperature profiles measured in the CO 2 absorbers of two LNG trains. The absorber corresponding to Figure 2 contained 250-size structured packing, while Figure 3 refers to a nominally 2 in. random packing. The temperature profiles are as measured via thermal imaging. These results show a positive agreement between simulation and measured data. The figures indicate the extent to which the external skin temperature (measured by thermal imaging) needs to be adjusted to account for conductive, convective and radiative heat losses; and that

temperature profiles can be fairly sensitive to errors in measuring such parameters as solvent flow rates. All simulations were run using OGT | ProTreat.
Selective treating presents a whole other set of circumstances. Unlike the deep CO 2 removal of LNG production, the objective here is to remove H 2S to (usually) < 4 ppmv, and to reject as much CO 2 as possible back into the treated gas, i.e. to maximise CO 2 slip. This is done using a solvent that is reactive towards H 2S, but not towards CO 2. Usually, MDEA is the solvent of choice. If one wishes to achieve a specified CO 2 target as well, a more reactive solvent can be mixed with the MDEA to provide a blend with tailored reactivity.
Figure 4 shows how the H 2S content of the treated gas, as well as the peak (bulge) temperature, depend on packing type and size. Figure 4 (top) shows that in terms of actual treating, the three generations of random packing all have much the same performance regardless of whether the column is pinched or not. Just as for CO 2 removal in LNG production, equivalent mass transfer performance is probably a result of these packings all granting pretty much full gas-liquid access to the inside of the packing pieces, and not just their outer shell. However, the better performance of some packings over others is mostly the result of greater surface area.
When the mass transfer itself is limiting (not equilibrium pinched) these results suggest that again random packings are somewhat better performers than their structured brethren. As Figure 4 (top) shows, at least for the conditions of the case study, structured packings with specific areas below about 200 m 2/m 3 start to show unsatisfactory performance (H 2S > 4 ppmv), whereas random packings do not start to show degraded functioning until the specific area falls below approximately 100 m 2/m 3. The difference is probably the result of higher levels of turbulence in the gas and liquid flows in random vs structured packing. However, higher turbulence comes with the price of higher pressure drop (or lower gas and liquid handling capacity).


From the perspective of H2S removal, random packings show somewhat better performance for the same dry specific area. However, from the viewpoint of the temperature bulge (Figure 4 [bottom]), if a satisfactory H2S content gas is being produced, the temperature bulge is independent of packing type (structured vs random), and responds mostly to size via axial dispersion and mixing.

Referring to Figure 5 (top), when the specific area of either structured packing is below 200 m 2/m 3, more than 55% of the CO 2 is slipped through the absorber, i.e. is not removed but remains in the treated gas. With a random packing of area < 100 m 2/m 3, more than 65% of the CO 2 remains in the treated gas. However, for the same specific area, structured packing slips more CO 2 than random. Flooding (Figure 5 [bottom]) appears to be a mostly linear function of specific area, although it is interesting to note that the second generation random packing shows reduced tower capacity (earlier approach to flood).
Figure 4. How packing type, style and size affect absorber performance in a selective treating unit. Structured #1 and Structured #2 designate two different 45° crimp packings. Top: effect of specific area on H2S in treated gas. Bottom: effect of specific area on peak temperature.
Figure 5. How packing type, style and size affect CO2 slip and hydraulic performance in a selective treating unit. Structured #1 and Structured #2 denote two different 45° crimp packings. Top: effect of specific area on CO2 slip. Bottom: effect of specific area on flooding performance.

These comparisons are as unbiased as possible because OGT | ProTreat only uses data that is supplied by the manufacturer of the individual packings. Mass transfer performance in LNG and selective treating applications does not seem to depend strongly on the generation of random packing so long as the outer walls of the packing pieces are sufficiently open for the interior of each piece to be as accessible to the liquid and gas flows as the exterior. In other words, third and fourth generations are roughly equivalent, and even first and second generation packings are not strikingly inferior (except in flood capacity and pressure drop).
The latter statement pertains to mass transfer performance in gas treating. It is predicated on using specific surface area as the comparison basis, because surface area provides a uniquely-quantifiable measure of mass transfer performance, especially in chemically-reactive absorption systems where surface area is the critical, deciding parameter. The theory of chemically-reactive mass transfer suggests that for liquid-phase, diffusion-controlled systems with fast chemical reaction, the absorption rate is a function almost solely of wetted interfacial area. This work bears that out. However, it should be noted that these results may not pertain to distillation or other non-reactive mass transfer separations because then there are no fast reactions, and the importance of interfacial area must be shared with

mass transfer resistances in the vapour and liquid phases rather than being a function of interfacial area only.
The size of the temperature bulge in an absorber is an important parameter that must be controlled to ensure acceptably low amine degradation rates, and to ensure that corrosion rates are within reasonable corrosion allowances. The bulge temperature is rarely measured and even its location is hardly ever known. Thermal imaging is a practical way of providing an estimate of this information in the field. However, a high-precision, mass transfer rate-based simulation is an excellent means to expose this critical process data.
Packing performance should be conceptualised and assessed based on the dry specific area and not on packing size – which is an amorphous concept at best. Even packing brand is relatively unimportant to mass transfer, although it is crucially important in pressure drop, hydraulic capacity, and in very low pressure applications such as CO 2 capture or in vacuum service and, of course, it impacts costs. Dry specific area captures the overwhelming majority of the influence of packing parameters on mass transfer performance in most amine-based gas treating applications. For an unbiased and well-balanced decision, the OGT | ProTreat simulator can be used to provide guidance for treating performance predictions as well as the influence of packing type on the bulge temperature predictions for a specific treating service.
The industry push for sustainability is slowly turning all parts of the plant and refinery operations green as sustainability managers, C-suite management, and environmental, social and governance (ESG) teams constantly look for opportunities to reduce emissions and meet ESG goals. While much of the industry has been focusing on the promises of renewable energy, green hydrogen, and carbon capture – which will be important components in the transition to net zero emissions – one effective way to reduce emissions in the short-term is to operate more efficiently with what you already have: your equipment and assets.
Energy use in industry contributes to around 24.2% of global emissions.1 In asset-intensive industries, with many energy-intensive processes, a significant amount of Scope 1 emissions can be attributed to the daily operations and energy required to operate the motors, pumps, compressors and other process equipment that is required.
With the increasing investor pressures on sustainability performance, and government regulations on emissions, what actions can be taken in the short-term to improve ESG performance? And can they be done quickly, with minimal capital investment, fast return on investment, and only utilising

Cole Lewis, Honeywell Connected Industrial, USA, discusses how real-time asset performance optimisation can help to prevent operational energy losses and achieve peak performance in downstream facilities.
existing equipment and assets? One potential answer to these questions involves applying the right asset management strategy and energy and emissions management solutions.
The hidden cost from inefficient assets resulting from not optimising energy usage and emissions can add up quickly. Up to 50% of non-feedstock operating costs are energy related in process industries. As such, small process inefficiencies ultimately lead to large increases in cost.2
Common sources of asset inefficiencies can come from:
n Degrading or damaged equipment not operating efficiently.
n Limited visibility into the relationship between asset performance and energy consumption, which leads to unrecognised inefficiencies.
n Constantly changing plant conditions requiring real-time recommendations and insights to optimise operations.
These asset inefficiencies not only increase energy costs, but can also negatively impact ESG performance, which leads to an increased business risk. The hidden cost of not optimising asset energy and emissions can be significant, but there are software and technologies currently available that can help to solve these challenges and contribute to sustainability and profitability goals.
According to an International Energy Agency (IEA) estimate, improving operational and energy efficiency in the process industries has the potential to reduce a company’s carbon footprint by up to 15%.3 In another report by the IEA, it was discussed that energy intensity improvement is declining from previous years. From 2011 to 2016, energy intensity improved at an average rate of 2.3%/yr, while in the last five years energy intensity has only improved at an average rate of 1.5%. This decreased rate of improvement is far short of the 4.1% needed annually to reach net zero by 2050, and leaves significant potential for cost and emissions improvement.4

Figure 1. Asset inefficiencies can be present in all types of major equipment. Degrading performance can not only lead to increased costs but also sustainability, safety, and operational risk.
Sustainability and asset performance management are not new concepts to the process industries. Since the mid-1990s, asset performance management solutions have traditionally been focused on preventing downtime and improving asset reliability. However, with the growing focus on industrial sustainability, there is an increased need to include energy targets as one of the main drivers for maintenance actions. Asset performance monitoring can help identify operational and design losses and recommend maintenance actions to help improve asset energy performance. The inclusion of these energy targets facilitates the shift from the traditional focus on preventing downtime, to helping assets run at their optimum while optimising for energy and emissions.
Figure 2. Energy intensity improvement since 2017 has been significantly lower than the previous five years. The average rate of improvement needs to increase by almost 2.6% more than current levels in order to meet the net zero emissions scenario.
When trying to identify areas of emissions improvement in a plant or refinery, a ‘data first’ approach that relies on insights from advanced analytics and cutting-edge technologies is required. To avoid the challenges of typical energy and emission management solutions, a ‘crawl-walk-run’ approach is needed. This approach enables enough time for operational adoption of the new technology, as well as enough time to successfully implement it and realise value. The following steps are recommended when implementing an energy and emissions management solution: n Evaluate your current digitalisation maturity and understand what opportunities are available or potential improvements are needed. Find solutions that help

break down data and operational siloes, and allow for true transparency.
n Identify critical assets and processes that have the most potential for improvement. Following the 80/20 rule: what 20% of assets or processes have the potential to see 80% of the improvements? By doing this, the initial investment and implementation costs can be greatly reduced.
n Develop a maintenance and sustainability strategy that capitalises on access to real-time data and insights. Ensure that all individuals from the operator to C-suite adopt these solutions. By prioritising best practices in energy and emissions management, companies will experience the biggest impact and return on investment (ROI) from energy and emissions solutions.
The small steps taken to implement energy and emissions solutions in targeted phases, and slowly transforming the organisation to utilise and make decisions from these solutions, can lead to big improvements over time. Three key features that energy and emissions management solutions should provide are the ability to:
n Monitor energy consumption:
§ A vendor agnostic solution that allows for enterprise-wide performance analysis of assets.

§ Real-time monitoring and validation of energy usage and emissions.
n Visualise energy and emission performance:
§ Configure energy analytics dashboards to provide powerful insights into energy usage.
§ Quickly identify the root cause of energy and emission inefficiencies.
n Utilise powerful analytics and reporting:
§ Robust library of fixed and mobile asset models.
Improving energy intensity and managing emissions from critical assets is just one part of the puzzle towards reaching
net zero emission goals. Looking at the bigger picture, solving the enterprise emissions problem requires viewing the end-to-end emissions framework and filling the gaps in companies’ sustainability strategy through small steps and improvements. From sensors and measuring emissions at the site level all the way up to corporate reporting, the enterprise emissions management framework consists of six connected parts:
n Consult – perform a baseline assessment on sustainability strategy and emissions reduction plans. Develop risk and investment strategy for green technologies.
n Measure – identify and categorise greenhouse gas (GHG) emission sources. Collect and utilise data from sensors and processes to calculate and quantify emissions.
n Monitor – view near real-time, enterprise-wide visual intelligence on energy and emissions. Drill down from enterprise to site to asset levels, and view energy and emission data.
n Predict – obtain emissions insights, perform what-if analysis, benchmark, and offset emissions.
n Reduce – reduce emissions through efficiency improvements and by switching to renewable energy sources.
n Report – regulatory-compliant environmental reporting for mandatory and voluntary disclosure.
A complete sustainability strategy will require end-to-end scalable solutions that have the necessary traceability and transparency required for mandatory and voluntary emissions disclosures.
In summary, the emissions challenge will not be solved easily. Many technologies are currently being developed, such as green hydrogen or carbon capture, that will help address emissions from the process industries. As the adoption of these sustainable technologies grows, it will take a complete, end-to-end emissions reduction strategy to efficiently meet the needs of the net zero emissions future. Reaching a future such as this will not happen overnight, but will instead require a crawl-walk-run approach over time, utilising innovative solutions.
As part of this approach, implementing an energy and emissions management solution can have a real impact on reducing energy costs and emissions from critical assets and equipment. Using existing equipment, improvements from energy and emissions management software solutions can be seen quickly, with minimal capital investment, to help save costs and the environment.
1. ‘Emissions by sector’, Our World in Data, https://ourworldindata. org/emissions-by-sector
2. ‘Optimize Energy Costs in Petroleum Refineries, Part I’, Chemical Processing, (21 February 2012), https://www. chemicalprocessing.com/articles/2012/optimize-energypetroleum-refineries-part1/#:~:text=Energy%20use%20 accounts%20for%20approximately%2050%25%20of%20 refining%20costs
3. Based on IEA data and customer net zero strategies.
4. ‘Energy Efficiency 2021’, IEA, (November 2021), https://www.iea. org/reports/energy-efficiency-2021
Figure 3. Enterprise emissions framework for developing a complete emissions strategy.

 Pekka Qvist, NAPCON, part of Neste, Finland, explains how digital training solutions can help panel operators in fault situations.
plant, but it also familiarises them with different situations that can arise, such as standard routine operations, start-ups, emergency shutdowns, possible upsets, and different troubleshooting scenarios. If operators had to learn all of this from a veteran operator, it would take a long time and they would have to be onsite at the exact moment when something extraordinary happened.
As such, a simulator is a great tool when it comes to learning about how to handle different scenarios. It provides a good understanding of the plant and what is
happening behind the panels – in a safe environment. With simulator training, panel operators can practice and learn to operate according to safe procedures, without risking the plant’s operations.

An OTS arms trainers and panel operators in a process plant with the efficient tools not only for training, but also for testing the operation of the plant safely, as it simulates a real-life plant and brings it to the virtual world in form of a digital twin. Cloud OTS is an even more modern way to handle basic training, as the simulators are based in the cloud. This novel approach offers features that change the way that process plant operators are trained. Above all, it is a tool that can be quickly deployed in a ready-to-use format, without the need for onsite hardware installations and configurations.
One of the driving forces behind the development of the cloud-driven OTS was the COVID-19 pandemic, which made remote work the new standard in many companies, and resulted in an understanding that staff training also required new approaches.
Figure 1. Simulation training brings a real-life plant into the virtual world, making training and testing safe and exciting.
One of the most beneficial approaches is the cloud-based training solution, through which the competence of the process plant operators can be developed independently of location. The cloud simulator can be accessed from anywhere in the world through the internet with secure connectivity, and it provides a multi-user, classroom-like experience without the need for a physical classroom. This way, portions of an actual process plant or a generic plant can be accessed by personnel outside of the site.
A cloud-based solution shown on one or maybe a couple of monitors cannot be compared to a full-blown simulator, but it is a much lighter solution than a simulator in a classroom, i.e. it is a learning solution that is reachable from anywhere in the world, and can be delivered to the customer in a couple of weeks instead of months, which is the timeframe required when delivering a tailored operator training simulator.
The cloud simulator provides the possibility to offer training that is equivalent to classroom-based training, via multi-user sessions. This is powered by public cloud computing capabilities, and is cyber-secured by nature.
Unlike training sessions in a classroom, the cloud-based OTS offers a highly-scalable and flexible environment, allowing for the dynamic adding or removing of seats. This also makes it very cost effective, as the resources are only used when needed. For internationally-operating companies, one of the key points is that the training is easy to scale out globally. It is also hardware-independent, because all of the calculations are made in the cloud. This means that all modern computers can be used to access the simulator.
Figure 2. NAPCON cloud OTS provides full operator simulator training capabilities anywhere and anytime, over a cyber-secure internet connection.

As cloud OTS can be deployed very quickly, it is a great way of handling the initial trainings of, for example, a
greenfield process plant that will start up in a couple of years. The teaching can then become more specific as the plant’s specifications become clearer.


After receiving the theoretical basic knowledge of the plant that is being built, the cloud OTS can be finished in a relatively short time. After this, training can start immediately. The principle is to first learn on a more general level, and then gradually dive deeper into the subject alongside the design and construction phases of the greenfield plant. This way, no potential training time is wasted, and when the commissioning of the plant is approaching, the training can be moved to a fixed simulator that has been developed in the meantime, and that is an exact match of the plant.
The cloud simulator is enabled by today’s technology that makes it possible to digitally model a whole plant, with all process and automation systems in place. It is an example of how an agile development of digital systems permits the swift creation of new solutions that really meet the training and competence development needs.
A large classroom with an array of monitors can be overkill if there is only a need for training some smaller parts of a big process. With the cloud solution, however, it is possible to create a detailed copy of a single process that can then be run on just a couple of monitors, or in some cases even on a single laptop.
Additionally, there is no requirement to attend a physical training class, but rather to become familiar with the actual process from anywhere where there is an internet connection. This means that the cloud simulator could also be an effective learning tool in technical universities and schools, complementing specific theoretical lectures, for example.
When a large process plant is up and running, or when the start-up of a new plant is approaching, it can be wise to have a dedicated classroom with an in-house training simulator that allows for the possibility of replicating and assessing the operational readiness of all of the plant assets.
One such example of this is a full-scale OTS that simulates all of the possible production states, such as start-ups, shutdowns, or special breakdown situations. It is also possible to cover process phenomena, plant equipment and process automation within the training.
In the classroom, the training can be made very realistic, including the use of alarm signals that sound when the operator’s attention is required for a specific issue. It also includes all of the reporting that must be done to ensure that every step of the protocol for dealing with a specific topic has been taken. A comprehensive digital trail of training sessions and reporting capabilities allows for the monitoring of staff competence development, and training progress when needed.
The emulated user interface in both the classroom simulator and the cloud simulator creates high-fidelity training simulations regardless of which DCS is used in the plant that the training is intended for. As part of the ongoing training programme within a plant, the operators can also focus on specific process phenomena to gain a deeper understanding of different process models through the detailed graphical user interface. This way, even a relatively novel operator can learn how to handle different problems in advance, and be able to make the right decisions when the scenario is for real.
The emulated DCS also provides the operators with a very similar user interface and user experience to the real DCS. As a result, both training and learning happens in an environment that matches the actual operator panels – in the form of a digital twin.
With the addition of cloud OTS, all of the training does not have to take place on the premises, as the cloud set-up permits flexible training rooms, resulting in the capacity to train multiple units and trainees simultaneously. The OTS offers the

instructor an easy-to-use graphical interface for introducing various faults and disturbances not only to the process, but also to automation and instrumentation systems. Learning to solve unexpected issues safely, according to the proper procedures, is an important part of the OTS training scenarios.
Aside from training simulators, a gamified training tool is a modern way to boost plant operating skills in refineries. The simulation-based educational games are not only aimed at the plant operators, but all plant personnel, in order to improve their competencies.
Training through simulation games is a flexible way to practice operating skills and level-up the competencies through solving fault problems in a fun way. Gamified training is also a way to engage the younger generation of operators to practice different situations that they do not face in everyday work.
Games coupled with theoretical eLearning modules can provide a comprehensive, basic-level training package focused on specific topic areas that are required for refining or process industries, such as distillation, furnace operation, heat exchangers, boiling or condensation.
Simulation-based educational games offer an efficient way to complement other training methods. It is an independent learning method that also makes it possible to utilise standby time during work shifts. All simulation
games utilise the same platform, which makes extending the training easy. Additionally, the games are available anytime and anywhere. As they use the same process simulation engine as the OTS, the simulation of the processes is just as accurate as with the OTS, but permits learning in a fun way.

Digital training solutions are an important part of the toolset for organisation-wide competence development. Highly-trained staff are essential to ensuring that an industrial plant is operated in a safe way but under optimal process conditions, maximising the value of the refined products. Bridging the gap between theory and practice is simple, with different digital training tools tailored specifically to the different phases of the learning curve. Hybrid availability both onsite and remotely is not only a benefit but a standard for the post-pandemic world.
NAPCON provides a comprehensive digital toolset to fit different phases of an operator learning path. The OTS will turn a process plant into a safe training environment. This can be tailored to most process industries, and for greenfield plants. The Cloud OTS enables the global use of the simulator through the public cloud, offering features that are changing the way that process plant operators are trained. Lastly, simulation-based educational games offer gamified training that sits well with the younger generation’s ways of approaching life.

Ammonia flaring is on the cusp of change due to the global drive for decarbonisation. Climate-focused countries are enacting legislation to reduce the use of fossil fuels, which can take the form of a direct tax on carbon dioxide (CO2) production at facilities, taxes on end use fuels such as gasoline and diesel, or incentives to use fewer carbon-intensive fuels such as ammonia or hydrogen. Ammonia as a direct-fired liquid fuel or as a transport media for hydrogen within the hydrogen supply chain will find greater utility in the coming years and decades because it has no bound carbon within the molecule.
Due to these societal pressures, momentum has been building in the traditional ammonia industry toward the creation of ammonia using renewable energy sources. Termed ‘green hydrogen’ or ‘green ammonia’, every step in its creation, transport and utilisation as fuel does not require fossil fuels. Full-scale production is only a few years away, with one vendor spending billions of dollars to bring world-class green hydrogen-based ammonia online by 2025.
There are already projects online, or coming online within the next couple of years, that will use ‘blue’ ammonia or hydrogen as a replacement for fossil fuel combustion. Blue ammonia differs from green ammonia in that it is produced through existing fossil fuel-based production methods, but then limits its carbon impact through sequestration and offsets.
What does this mean for the future of flaring? It may be very diverse. Ammonia and/or hydrogen will be found in any facility that makes the switch to a low carbon footprint. Natural gas replaced with hydrogen as a burner or pilot fuel is increasingly
 Kirsten Berg and Adam Herrington, Zeeco Inc., USA, detail what to consider when designing flare systems and ancillary equipment for ammonia waste processes.
Figure 1. Example of a flare system designed to handle ammonia facility waste gas, featuring a windscreen to assist with effective combustion.
Kirsten Berg and Adam Herrington, Zeeco Inc., USA, detail what to consider when designing flare systems and ancillary equipment for ammonia waste processes.
Figure 1. Example of a flare system designed to handle ammonia facility waste gas, featuring a windscreen to assist with effective combustion.
requested by end users. Designing combustion equipment to provide effective destruction efficiency (DE) for chemical, petrochemical and gas processing applications presents specific challenges that must be assessed on a ‘per case’ basis. For industries producing chemical compounds where the nature of the chemical itself makes ignition and high DE difficult to achieve, including ammonia, specific flare design practices must be employed to ensure clean and efficient combustion.
A number of factors contribute to the difficulty of ammonia combustion: it is a nitrogen-based compound, has low flame propagation speed, low heating value, and low flame temperatures. Meeting these challenges requires specific design criteria for ammonia flares (see Figure 1 on p. 55).
To facilitate the technically-complete combustion of ammonia (99% or higher), it is necessary to restrict the exit velocity of the waste gas to ensure that the ammonia has adequate residence time for high DE combustion. Zeeco has accumulated test data demonstrating a correlation between ammonia flame stability and exit velocity that supports this design philosophy. If a flare system is not designed with this key metric, a higher potential for incomplete combustion and/or an unignited release of the waste gas exists.
For example, Figure 2 illustrates that the maximum design exit velocity for waste gas containing ammonia is dependent upon the flare tip diameter. In general, as the flare tip diameter increases, there is a larger volume of gas and higher heat release from the flame. Thus, designing the flare tip diameter based on controlling the exit velocity assists in maintaining a flame temperature that is higher than the ignition temperature of ammonia, and improving overall flame stability.

Testing performed on 100% ammonia gases by a chemical plant in Houston, Texas, US, further illustrates these points. The flow rate of the gas was varied to evaluate the influence of exit velocity at the flare tip discharge point on the combustion efficiency. Testing was performed on a nominal 12 in. dia. utility type flare tip with a full flame retention ring. The following were options that were fitted to the tip as part of the evaluations:
n Extended large diameter windshield assembly that enclosed the discharge of the flare tip and the pilots.
n Gas injection assist ring at the flare tip exit point to produce turbulence and increased air inspiration into the combustion zone.
n Multiple pilots (maximum three) were available to determine the impact of ignition flames on the combustion process.
The testing included analysis of the performance of the flare tip assembly using various flows of ammonia, one to three pilots, a gas injection ring, the extended windshield, and combinations of the above. The amount of ammonia present in the plume from the flare was determined using a heated probe that sampled in a position relative to the measured temperature (to ensure that the probe was in the hottest portion of the plume). See the typical ammonia test flame colour in Figure 3. The conclusions from the testing were:

n Ammonia will burn to technically-complete combustion (99% or higher) if the exit velocity at the flare tip discharge point is kept very low. The acceptable velocity is a function of the nominal flare tip diameter (see Figure 2).
n Higher flare gas exit velocities result in the inspiration of too much ambient air into the combustion zone, which dilutes the ammonia/air mixture to below the combustible limit. Ammonia has a lower explosive/combustible limit that is 16% in air. This is in comparison to most hydrocarbons that have LEL values that are from 1 to 3%. This means that the ammonia and air mixture can easily be diluted to a point where the ammonia will not burn.
n Ammonia needs to have a reliable source of ignition. This is typically provided by a very reliable pilot flame and enough pilots around the perimeter of the flare tip. If the ignition source was removed during the testing, the ammonia would not sustain a stable flame.
n A windshield is very useful in limiting the amount of air inspirited into the ammonia flare gas stream to facilitate ignition of the gases in an area that is protected from crosswinds.
n Burning of the ammonia vapour eliminates any ammonia smell. This process will also produce NOx. Any mole of ammonia will produce one mole of NOx. The temperature of combustion in an ammonia flame is much lower than in a hydrocarbon flame. The NOx produced will typically be colourless nitrogen oxide (NO) and nitrogen dioxide (NO2).
Figure 2. Typical maximum design exit velocity vs nominal flare tip diameter. Figure 3. Typical ammonia test flame colour.Based on these findings, ammonia can be burned in a flare system with very high efficiency, if the flare system is designed correctly.
Extensive testing and validation performed at Zeeco’s testing facility generated innovative advances in design considerations for the burning of ammonia process gas.
Commonly, the portion of the flare referred to as the ‘flare tip’ is the upper 10 ft of the flare system. As ammonia waste gas enters the flare tip body, access to air and uniform mixing to promote combustion plays a critical part in fully combusting the compound. To achieve even distribution of the waste gas throughout the entire flare tip body, ammonia flare tips need to include flow distribution devices to properly disperse the waste gas, exposing the waste stream to ignition sources, as well as increasing access to combustion air.
For instance, on typical utility flare tips, windshields are flush with the flare tip exit, and the pilots are arranged on the outer perimeter of the windshield. A flame stabilisation system provides uniform flame stability for initial ignition, as high heating value gas can propagate combustion with ease after initial ignition is accomplished. In contrast, for ammonia combustion, the windshield design should be modified to ensure that the effects of wind are minimised, and interaction between the ignition point, air and fuel is concentrated in this area.
Pilots are placed at strategic locations to increase stability and to be as close to the flare tip perimeter as possible for ignition. Zeeco designs and uses a specialty flame stabilisation system for low heating value gases such as ammonia. With this system in place, the flare tip, pilots, and flame stabilisation tabs are synchronised to promote the highest achievable flame stability. All components interact to provide a highly stable combustion zone, so that the ammonia burns freely, and the flare system achieves high DE.
Physical behaviour of the gas can be modified when flaring ammonia. As mentioned earlier, the effect of exit velocity on the combustion of ammonia waste gas is dramatic, and design constraints can be put in place to promote stable combustion. Zeeco typically elects to increase the flare tip barrel diameter in conjunction with the use of diffusion apparatuses for ammonia applications. In doing so, ammonia can be slowed to an acceptable exit velocity and diffused throughout the flare tip, promoting proper mixing and stable combustion over a uniform area.
Such systems will need the ability to vent their vessels in the event that a fire occurs in the facility. Therefore, flare systems will need to be able to be sized and designed for these fluids. Whether these gases would need to be vented to a new low-pressure flare system, designed in the traditional way, or within an existing system, would be determined on a case-by-case basis.
Social acceptance of ammonia is the foremost concern of operators using the product. The low odour concentration
threshold will quickly alarm operators, and possibly the surrounding communities, of a leak or poorly-performing flare system. Addressing this concern in the FEED stage will start the equipment off on the right path in the crucial first steps.
Aside from the combustion design for ammonia facilities, ancillary equipment should be assessed and evaluated. For instance, Liquid Seal Drums (LSD) are commonly used as a safeguard to separate the flare system from the upstream header and equipment. Because ammonia is soluble in water, when a relief stream containing ammonia flows through the LSD, the water will absorb some of the ammonia, forming a corrosive ammonia solution. Often, the LSD is designed as such that all of the water is removed with the waste gas during a flaring event, and LSD is refilled upon completion of the flaring event. In this case, corrosion due to an ammonia water solution is not likely.
However, if there are flow rates expected where the water will not be removed and replaced, further consideration may be needed. Requiring the LSD to be made of specialty materials, coating the inside of the LSD, and/or maintaining the quality of the water by continually skimming and routine cyclical draining/refilling of the water are all possible methods to reduce the effect of ammonia streams through an LSD.
Because ammonia flares are designed to have low exit velocities and low heat releases, noise caused by the flare itself should be minimal. However, ammonia streams are typically high-pressure streams from the upstream equipment in the plant. A portion of this pressure drop will translate to noise that will travel through the plant’s waste stream piping. Because the flare tip is the only exit point for that waste stream, and because of the necessary design characteristic for the flare tip, the tip can act as an amplifier for the noise produced in the upstream piping. Operators experiencing unexpected noise levels at the exit point of an ammonia flare should take into consideration the high amount of pressure drop from the upstream piping or at the relief source.
There are many design aspects to consider when designing flare systems and ancillary equipment for ammonia waste processes. With the influence of more stringent emission regulations on the horizon, progress toward sound inherent design of flare systems to relieve waste will become more crucial. Through further testing and innovation, flare system providers such as Zeeco will have the opportunity to develop new solutions to provide clean, efficient and effective flaring solutions for ammonia and urea plants.
1. ‘Generating a Cleaner Future’, Air Products, https://www. airproducts.com/campaigns/ft-hydrogen-summit#:~:text=Air%20 Products%2C%20together%20with%20ACWA,tons%20per%20 year%20of%20CO%E2%82%82.
2. ‘Zero Ammonia Emissions Project’, https://f.hubspotusercontent10.net/ hubfs/7724363/Zeeco-En_June_2020/pdf/Zero-Ammonia-EmissionsProject-3.pdf
• ‘A Roadmap to the Ammonia Economy’, https://www.sciencedirect. com/science/article/pii/S2542435120301732#:~:text=Ammonia%20 produced%20from%20renewables%20is,as%20a%20potential%20 jet%20fuel

Steam-assisted flares are a proven technology that can effectively combust waste hydrocarbons in refineries, petrochemical plants, and other applications. Over the past 15 years, new technology has enabled flare emissions measurements that were previously impossible. These measurements have shown that at high turndown, steam-assisted flares can be operated in such a way that the destruction efficiency is significantly lower than the expected 98%.
This data was the basis for new regulations addressing flare operations. To compound this issue, plant operators have steadily decreased the amount of vent gas sent to flares, increasing the level of turndown at which the flares normally operate. The reduction of vent gas flows is an overall positive outcome, reducing waste and carbon dioxide (CO2) emissions, but this challenges the flare to operate effectively at even smaller flow rates.
This article will describe the technology that facilitates the high turndown operation of a steam-assisted flare, while maintaining high destruction efficiency.
New regulations addressing flare operations have been implemented for the refinery (40 CFR 63.670) and ethylene (40 CFR 63.1103) sectors. These new regulations have increased operational restrictions, which can have a

significant impact during high turndown operations, where most flares operate the majority of the time. Flares subject to these regulations must meet the Net Heating Value of Flare Combustion Zone (NHVcz) value of 270 Btu/ft3 any time that regulated material is sent to the flare. The equation for the NHVcz value requires the calculation to include all assist steam that is sent to the flare, as well as the vent gas. This means that at very low vent gas flow rates, the flare can approach and/or drop below the minimum allowed NHVcz.
While the solution for this seems to be simple –reducing the steam flow until the NHVcz is above the minimum – the actual operation of the flare is more complicated. For proper operation of steam-assisted flares, most flare vendors recommend a minimum amount of steam be sent to the flare to protect the tip during low flow conditions. This minimum steam, often called cooling steam, helps to prevent flame pulldown that can damage a tip over time. The cooling steam also keeps the steam injectors cool, as the steam temperature is cooler than flame. In addition to this, the cooling steam keeps the steam lines warm so that when a flaring event requires a rapid increase in steam flow there is not a large amount of condensation in the line that could form a slug of water,
Sherri Roberts and Zach Kodesh, John Zink Hamworthy Combustion, a Koch Engineered Solutions Company, USA, consider how to improve steam flare efficiency at turndown, using staged steam injection.producing water hammer that can damage equipment. Given that the minimum steam rates cannot simply be decreased without having adverse effects on equipment life, many flare operators will be forced to add supplemental gas to their vent gas to meet the NHVcz limitation of 270 Btu/ft3. The addition of supplemental gas can be a significant operating expense, and can also increase greenhouse gas (GHG) emissions.
The Steamizer XP flare tip (see Figure 1) is the latest steam flare technology from John Zink Hamworthy Combustion (JZHC), a Koch Engineered Solutions company. In recent years, it has been installed as a solution for many flare users in order to meet demanding flare regulations. It can offer improved smokeless capacity and lower steam usage during all operation points. Additionally, to improve ease of operation, it has only one steam injection location vs the multiple locations that older style designs employ. Control of the steam injection in older designs must be carefully coordinated to ensure proper operation of the tip, and to avoid damaging it.
The flare tip also has a much longer tip life than older designs. One recent example is when several tips endured steam outages during the unprecedented freezing conditions along the US Gulf Coast in 2021. None of the tips in the area had to be replaced, while other steam flare technologies required replacement immediately after the freezing event.
Additionally, the Steamizer XP offers very stable combustion in olefin applications. Older designs can have unstable combustion, particularly in ethylene service, which can result in severe noise and vibration. There are still minimum steam requirements with the Steamizer XP tip that may require additional fuel gas to meet the NHVcz limit.

Aware of the developing regulations and their potential impact, the need for lower steam rates at turndown conditions became a focus of JZHC’s flare technology development. From that effort, a patented Staged Steam technology was developed, which was then applied to the Steamizer XP design. The Staged Steam XP has very low steam consumption at turndown. This low steam requirement is a significant benefit to meeting the stricter US Environmental Protection Agency (EPA) rules at turndown, and minimises or eliminates the need for supplemental fuel gas.
Traditional steam injection systems use fixed discharge nozzles, and are designed to operate at specific design steam flow rate. Typically, the design steam flow rate is achieved with a steam pressure of around 100 psig (6.7 barg), which achieves steam discharge velocities of greater than 1500 ft/sec. When operating at design conditions, the tip achieves near maximum efficiency (lowest steam to hydrocarbon ratio for smokeless combustion) due to the momentum of the steam being at its maximum (steam momentum is what entrains air and mixes it with the vent gas).
When operating at high turndown, the steam flow can be around 1 – 3% of the design rate. These low flow conditions result in steam pressures in the range of 0.15 – 0.015 psig (0.01 – 0.001 barg), which result in steam discharge velocities of around 50 – 150 ft/sec. The ability of the steam to entrain air and mix it with the vent gas is very poor at these low-momentum conditions, resulting in the need to increase the steam rate to achieve smokeless combustion. Increased steam flow at turndown can force an operator to add supplemental fuel gas to meet the NHVcz limitation, and ensure good combustion efficiency from the flare. It is ironic that the best operators – those who minimise vent gas flow to their flares – can be punished for responsible operation by being forced to dump supplemental fuel gas into their flare header.
The patented Staged Steam XP flare tip uses multiple steam nozzle designs to significantly improve efficiency at turndown. In addition to the traditional steam manifold described above, additional steam manifolds are added to the tip. These additional manifolds are designed to flow low volumes of steam at high pressure. This allows the tip to operate at higher efficiency during turndown conditions. As these manifolds are specifically constructed to operate at the lower flows, much less steam is required to provide the momentum for keeping flame off the flare tip and achieving
 Figure
The Steamizer XP.
Figure
Steam comparison olefin service.
Figure
The Steamizer XP.
Figure
Steam comparison olefin service.


smokeless combustion. It is also important to note that even with the additional steam manifolds, steam operation with the patented Staged Steam XP is still very simple. All steam is injected into the same location of the flare tip, which eliminates the possibility of misoperation of the flare tip, creating internal burning and unstable combustion.
Figure 2 shows the lower S/HC ratios that are possible using the patented Staged Steam XP flare tip (Advanced XP-SS Flare). The graph also shows a comparison with a standard steam flare tip that uses upper and lower steam injection.
While the obvious improvements from the patented Staged Steam XP are steam savings and enhanced performance at turndown conditions, this also allows flare users to meet the NHVcz while minimising or eliminating supplemental gas. Meeting the NHVcz allows the flare to operate within regulations, the purpose of which is to promote good flare destruction efficiency. Operating costs are reduced by lower steam consumption and decreased supplemental gas consumption. Additional benefits from this solution are the carbon emissions reductions from the lower supplemental gas requirements, and reduced fuel burned by the boiler.

Calculator, the following is an example comparing steam savings and CO2 emission savings from an SA-style (older internal tube design) flare with upper and lower steam rings vs the patented Staged Steam XP. The SA-style flare tip
would require 1200 lb/hr for the cooling steam rate, while the Staged Steam XP flare tip would only require around 600 lb/hr for the cooling steam rate. This is easily seen as a more than 50% saving on steam alone, while the CO2 emissions savings on producing the steam would equate to around 320 tpy. There would also be additional CO2 emission savings if the lower steam rate resulted in a reduction in supplemental assist gas to meet the NHVcz requirement.
In response to today’s increasing demands for minimising flaring and lowering CO2 emissions, innovative solutions are available to help steam flare users meet these goals. This is especially critical with updated flare regulations that can require supplemental gas at turndown conditions, which is counter-intuitive for lowering CO2 emissions. When those requirements were implemented, steam flare users had to pick between possibly limiting the life of their flare tip by going below the recommended cooling steam rates, or spending additional money and increasing emissions by adding supplemental fuel gas. The Steamizer XP technology combined with Staged Steam technology provides high performance with lower operating costs and emissions than traditional steam flare designs.
• ALLEN, D. A., and TORRES, V. M., ‘TCEQ 2010 Flare Study Final Report’, (2011).
• ‘Greenhouse Gases Equivalencies Calculator - Calculations and References’, Environmental Protection Agency, https://www.epa.gov/energy/greenhouse-gases-equivalenciescalculator-calculations-and-references


Water plays an integral part in the petroleum refining process. A tremendous amount of water is used in a refinery – from mixing and separating the crude oil, to cooling the distillation tower with cooling water, and finally discharging the treated wastewater to surface water or wells. This is a general overview of the petroleum refining process, highlighting the composition of water at different stages in the refining process. However, this article will specifically discuss the importance of proper elastomer selection for seals in valves, pumps and gaskets in refinery processing equipment that handles these varying water compositions.
In the petroleum refining process, crude oil is first prepared for refining in the desalter. The main purpose of the desalter

Lea Clauson, DeZURIK Inc., USA, discusses the importance of elastomer selection for petroleum refinery water.
is to remove impurities such as sulfur, salts and contaminants from the crude oil by mixing it with water to separate it into a brine water stream and the desalted crude. Some crudes contain high concentrations of hydrogen sulfide (H 2 S), which is corrosive to metal processing equipment, so amines are added to the crude to tie up H 2 S and transport it with the brine water stream to wastewater treatment processing. 1 Next, the desalted crude is heated to 398°C (748°F) before it enters the crude oil distillation unit (CDU), also known as the atmospheric distillation unit. Figure 1 is a typical flow diagram of the desalter and CDU used in petroleum oil refining.
The CDU is the front end of the petroleum refining process. Its purpose is to use heat to separate the desalted crude, which is a mixture of hydrocarbon compounds. The mixture is separated into fractions with similar boiling points, molecular weights and
properties. 3 These fractions include fuels such as gasoline, diesel fuel, jet fuel and others. The separated fuels then continue on for further processing.
Acids such as hydrochloric acid (HCl) build up in the CDU overhead systems and create highly-corrosive steam condensate that is damaging to process equipment. Amines are base chemicals that are injected into the overhead system to neutralise the acids and combat the corrosive environment. 4 They are organic compounds derived from ammonia, where one or more hydrogen atoms are replaced by an alkyl group that is attached to one or more nitrogen atoms. 5 The primary use of amines is in medications, nylon, and water purification.

Amines are injected into two different areas of the petroleum refining process. They are first injected into the desalter to tie up H 2 S and send it, with the brine water stream, to wastewater treatment processing. Secondly, amines are injected into the CDU overhead system to neutralise corrosive HCl. The overhead stream from the CDU mixes with cooling water from the cooling tower, and the cooling water cools and condenses the vapours in the CDU. As a result, amines are found in both wastewater and cooling water applications in a petroleum refinery.
Elastomers are used as seals in valves, pumps and gaskets in refinery processing equipment. The integrity of these seals is critical to controlling volatile organic compound (VOC) emissions from


wastewater systems. VOCs are usually industrial solvents that may have short- and long-term adverse health effects on operators. 6 The allowable VOC discharge limit for a refinery is set by the Environmental Protection Agency (EPA). The EPA’s job is to enforce the environmental laws in order to protect human health and the environment. 7 In a petroleum refinery, VOCs are typically industrial solvents such as benzene, hexane and toluene which may end up in the wastewater stream and could potentially contaminate the groundwater. If a refinery exceeds the allowable VOC limit, it will be required to clean up its processes and pay a fine.
As such, careful consideration is required in elastomer selection to prevent premature degradation as a result of incompatibility with the process media. Elastomer selection is typically ruled by two factors: chemical compatibility, and operating temperature. The incompatibility of an elastomer with a media can be physical or chemical. In a physical interaction, the elastomer will absorb the media liquid and swell, harden or crack. In a chemical interaction, the elastomer will undergo structural changes from degradation of the chemical components within the elastomer. The chemical degradation often reduces physical properties such as tensile strength and hardness. Higher operating temperatures often increase the degradation of the elastomer. The increase in temperature can create unwanted crosslinks in the elastomer, and may also decrease its flexibility. 8
Case studies have found polytetrafluoroethylene (PTFE) to have superior chemical and temperature resistance to amines compared to elastomers. 8 However, PTFE is generally not used as a sealing material in many applications because it lacks a critical physical property: resistance to compression set. Compression set is a
material’s ability to return to its original thickness after prolonged compression stresses at a given temperature and deflection. 9 Unlike elastomers, PTFE takes a compression set after one use. As such, PTFE is not a suitable seal material for many valve designs, pumps and gaskets without the means to provide memory (the ability of a material to bounce back to its original shape after compression). Memory is created in a PTFE seal by adding a spring, a snap ring, or another live-loading mechanism such as an elastomer.
If PTFE material is not a suitable sealing material, then elastomers are typically used as an alternative. There are many types of elastomers, and each has its own chemical and temperature resistance characteristics. The most common elastomers used for water service are acrylonitrile butadiene (NBR) and ethylene propylene diene monomer (EPDM). The general compatibility of NBR and EPDM with amine and demineralised water, also known as deionised water, is shown in Table 1.

Although NBR is suitable for demineralised water, which is the start-up process media in cooling tower applications, it is not suitable with the amines that are present in the CDU overhead systems. The cooling tower water cools and condenses the vapours in the CDU overhead system that contains amines. The amines will cause the NBR to swell, soften or dissolve, which degrades the sealing ability of the part.
Elastomeric swelling in a seal such as a valve seat can create an additional interference between moving parts, and may potentially tear the seat and create higher torque requirements to actuate the valve. Figure 2 is an amine chemical attack on a fluoroelastomer seal. The chemical attack caused the seal to swell, and increased the interference.
Although perfluoroelastomers (FFKM) offer the best amine resistance, these are suitable for static seals but not recommended for dynamic sealing of a valve seat without additional support. 11 In addition to this, FFKM can be an expensive elastomer depending on the size of the component. The most economical and chemically-compatible elastomeric material that is suitable for use with amines is EPDM.
Besides defined process media and conditions, there are also undefined media and conditions. Undefined media may include media abnormalities such as amine injections; undefined conditions may comprise start-up, shutdown, emergencies or cleaning, which may include spikes in pressure and temperature. Spikes in temperature can also affect elastomer selection. NBR is rated to 180°F whereas EPDM is rated to
Figure 2. An example of a fluoroelastomer seal that has swollen as a result of an amine chemical attack (source: Gallagher Seals).10


250°F. These undefined conditions need to be considered and evaluated, as these undisclosed conditions are often more detrimental than the defined operating conditions, and can negatively impact the life of the elastomeric component.
The longevity of elastomeric seals used in valves, pumps and gaskets is critical to the continuous operation of a petroleum refinery and the avoidance of costly downtime, which results in loss of production. It is also critical to containing VOC emissions in wastewater discharge and to avoid costly environmental fines that are issued by the EPA.
Proper elastomeric material selection in a petroleum refinery requires experience and refining process knowledge to recognise that wastewater and cooling water includes not only water, but also additional chemicals such as amines. Amines are used to tie up H 2 S in the brine water stream that enters the wastewater treatment processing from the desalter, and to neutralise the acids that are produced in the overhead stream from the CDU.
While NBR is suitable for demineralised water, it is not suitable for amines. EPDM is chemically-compatible and offers higher temperature resistance to amines than NBR. It is also economically-favourable over fluorinated

copolymers. As such, it is best practice to specify EPDM for most process water applications in a petroleum refinery.
1. BASU, S., ‘Impact of opportunity crudes on refinery desalter and wastewater treatment performance-Part 1’, Hydrocarbon Processing , Water Management, Headworks Int’l, (2018).
2. BEYCHOK, M., ‘Crude Oil Distillation Unit.png’, Wikimedia Commons, (2020), www.commons.wikimedia.org/ wiki/File:Crude_Oil_Distillation_Unit.png
3. NICHOLS, L., ‘Uses of Fractional Distillation’, Chemistry LibreTexts, (2022).
4. VETTERS, E., ‘Neutralising amine selection for crude units’, ProCorr Consulting Services, (2021).
5. ‘Physical Properties of Amines with Characteristics’, BYJU’S, (2022), www.byjus.com/chemistry/physical-properties-ofamines/
6. ‘What are volatile organic compounds (VOCs)?’, US Environmental Protection Agency (EPA), (2022), www.epa.gov/ indoor-air-quality-iaq/what-are-volatile-oranic-compounds-vocs
7. ‘Basic Information on Enforcement’, US EPA, (2022), www.epa.gov/enforment/basic-information-enforcement
8. WAYUTA, S., ‘Physical and Chemical Resistance of Elastomers in Carbon Dioxide-Loaded Aqueous Monoethanolamine Solutions During Amine-Based Carbon Dioxide Capture’, The University of Regina (Canada) ProQuest Dissertations Publishing, (2013), www.proquest.com/docreview
9. ‘Compression Set of Elastomeric Materials’, Stockwell Elastomerics, Inc., (2022), www.stockwell.com/ compression-set-testing/
10. Permission granted by Gallagher Fluid Seals, Inc., https://www.gallagherseals.com/
11. ‘When to Use Perfluoroelastomers’, Eclipse Engineering Inc., (2022), http://eclipseseal.com/blog/seals/seals-seasonsperfluoroelastomers/