14 minute read
A springboard to success


Harry Burton, AMETEK Process
Instruments, USA, discusses how integrated analyser platforms can address common hydrocarbon processing and refining challenges.

The hydrocarbon processing and refining industries have seen numerous advancements in process efficiency, maximising product quality, and meeting both environmental and workplace guidelines set by regulators globally. However, striving to maintain or improve upon these conditions has often come with its share of complications. With hydrocarbon processors striving to meet the production levels seen prior to the pandemic, and hydrocarbon-based products still witnessing relatively high demand, facilities need to maintain peak operating conditions. However, these conditions will not always be commonplace, as process upsets and sample changes can cause unplanned downtime, reducing production.
Process analysers have become a quintessential measurement tool for monitoring process and refining conditions, and their existence over the last 60+ years has seen just as much advancement as the hydrocarbon industry itself. With new industry and regulatory standards came new opportunities for developments in analyser technology and integration. This has included improvements in materials, electronics, and optical component sensitivity, as well as onboard communication systems and software design. The culmination of these iterations has led to more reliable analysers, which also require less in maintenance (reducing costs), and greater options for process monitoring.
As crucial as they are, it is important for the user – and analyser manufacturer – to not only have the right analyser for the job, but one that can perform across a variety of process and environmental scenarios. The user should specify the analysers with an understanding that they are being given a quality product, and that they will rarely need to operate the unit from their own end. While no one analyser is perfect for all possible applications, seeking to design an integrative platform that addresses user concerns should be paramount. The utility of an analyser should be addressed over a variety of factors, and through detailing these elements – and where it can improve certain industry processes – it is possible to aid users in deciding which analyser best suits their needs.
Choosing the right analyser
One fundamental starting point in the selection of an analyser is deciding what chemical the user needs to measure. Depending on both the atomic structure and molecular characteristics of the chemical, detection will require an analyser with the appropriate measuring wavelengths. This ultimately decides which optical components and light
spectrum the unit will need to include for successful operation. Within the hydrocarbon industry there exist several optics-based analyser platforms that have become standardised for field measurement, including: ultraviolet (UV), visible (vis) and infrared (IR) spectrometers, gas chromatographs (GCs), mass spectrometers, and tunable diode lasers (TDL). While this section will not cover each platform in detail, it will discuss the basic methodologies of these techniques and the known advantages and disadvantages of each of these systems. By doing so, this will help the reader assess what analyser platform may be best suited for their needs.
GCs have become widely prolific for petroleum fluid analysis, as their price point, ease of use, and decreasing dimensional footprint became more suitable for industry markets over time. In terms of operation, it starts with a liquid sample (stationary phase) being placed in a separation column. This sample is then heated via an oven, which causes its molecular constituents to vaporise. These then distribute themselves along the column. Molecular separation is largely influenced by the vapour pressure of these molecules, as well as their affinity to remain stationary when a mobile carrier gas (mobile phase) passes over its surface. When an unreactive carrier gas such as helium or hydrogen is introduced into the system, it strips and pushes the vaporised molecules from the column to the detector – normally a flame ionisation detector. This process is referred to as ‘elution’. The resulting spectral graph, called a chromatogram, relays this information as the detector response time in the y-axis, and retention time along the x-axis. The concentration of the molecule can be determined through integration techniques.
Through technological advancements, GCs later became paired with mass spectrometers (MS). An MS seeks to measure the mass-to-charge (m/z) ratio of ions that meet its detector, with higher concentrations of a given sample producing more ions, which leads to higher intensity levels. MS units work best when dealing with molecules that have already been separated, hence why they are used in tandem with a GC. Through either electron or chemical ionisation, these newly-separated ions are then detected via similar ionisation detectors, and sorted by their molecular weight. The molecules present in the spectrum are determined through a machine algorithm, which compares their recorded mass spectra to existing spectral libraries. The National Institute of Standards and Technology (NIST) is a commonly-used reference library, though interpretation of the spectrum is also possible with other well-sampled data libraries.
A limitation of GCs is that the elution process can only separate volatile molecules. This would exclude chemicals that are commonly found in process samples, such as carbon monoxide (CO) or carbon dioxide (CO2). CO2, in particular, is utilised predominantly in injection wells and is a strictly-regulated chemical in many countries.
At times, insufficient chromatographic separation can occur, whereby certain molecular peak responses cannot be well distinguished from one another. This is one of the reasons why MS analysers are used in conjunction with GCs, as they can help resolve overlapping ionisation peaks. GC-MS units can also measure within the ppb concentration range, which is especially useful for capturing trace emissions.
For either method, depending on the temperature needed for separation, data collection for each component can take several minutes to half an hour. This can be problematic for applications that require process observation in real time, such as workplace and environmental safety. There is also the possibility that fewer qualified technicians may face challenges when discerning the measured spectra or operating the GC-MS.
Tunable diode laser absorption spectroscopy (TDLAS) has become a notable player in the modern natural gas, petrochemical, and steel production control industries. TDLAS systems monitor process gases in the near-infrared (NIR) and IR spectral ranges due to the amount of molecular absorbance lines within that spectral regime. These molecules have both a rotational and vibrational (rovibrational) response to IR energy stimulation, and through this behaviour, multiple absorbance lines exist for measurement. The advantage of TDLAS is that it can selectively isolate these peaks due to the monochromatic light of its diode laser. This system starts with the process gas being excited by a diode laser that has an emission (light) wavelength capable of triggering this rovibrational response. Wavelengths that were absorbed by the molecule then appear as a spectral response on the detector. By varying the temperature and driving current of the diode, the wavelength of the diode laser can be shifted by as much as 1 – 2 nm. Three key attributes (benefits) of TDLAS include its degree of specificity for detecting the analyte, its high sensitivity, and a fast response speed. TLDAS’ specificity is the result of the extremely high spectral resolution. Emission bandwidths for TDLs are on the order of 10-4 – 10-5 cm-1, which results in the ability to isolate a single rovibrational transition line of an analyte species. A second advantage of TDLAS is its ability to rapidly tune the lasers, so techniques such as wavelength modulation spectroscopy (WMS), which yield dramatic sensitivity enhancements
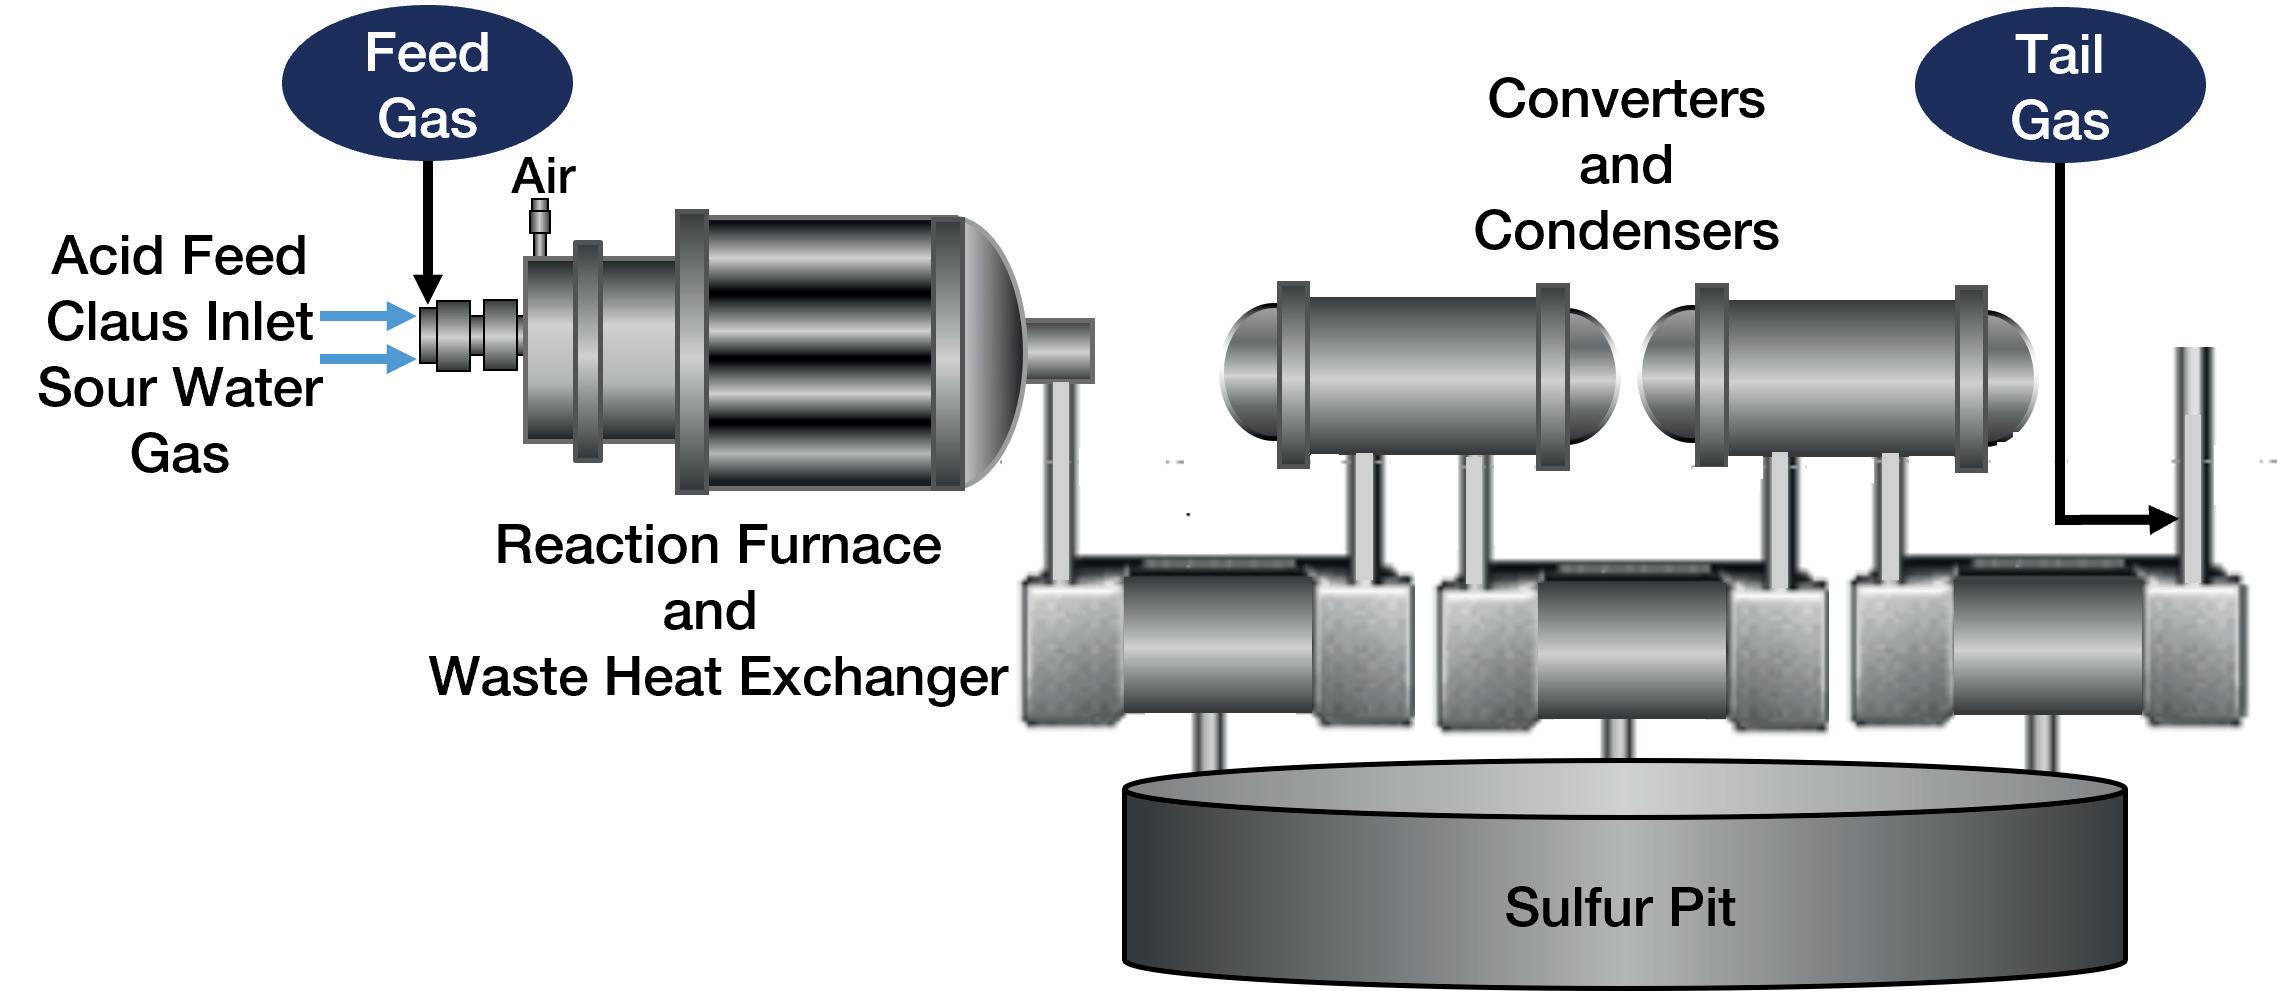
Figure 1. A Claus unit.
over a direct absorption approach, are easily implemented. Because TDLAS is an optical technique, it also offers a very fast response speed.
TDLAS measurements can be performed in-situ, where the sample is probed directly from the process or through extractive measurement, the latter entailing the use of a multi-pass cell of a certain pathlength. Multi-pass configurations can increase the absorbance response of the analyte of interest by several times, altering the minimum measurement ranges down to the low ppm or ppb scale. This is also what makes TDLAS worthwhile for trace gas emission detection. A major drawback of TDLAS systems is their limited application usage. TDLAS only works with lighter gases with resolved rotational structures, which heavier hydrocarbons (containing 4+ atoms) or liquids do not have. TDLAS typically measures water (H2O), ammonia (NH3), methane (CH4), hydrogen sulfide (H2S), oxygen (O2), hydrochloric acid (HCl), and CO/CO2. With regards to multi-pass TDLAS systems, extending the pathlength to the order of hundreds of meters can increase sampling time, which can limit its applicability for safety-focused applications that require quick response times. Other hindrances to TDLAS include process scenarios with sudden temperature/pressure swings, which can cause refractive index changes in the sample. This causes the laser beam to redirect, reducing signal quality to the detector.
UV light largely defines wavelengths of less than 450 nm. Absorbance spectroscopy in this region benefits from UV-absorbing molecules seeing little to no interference from lighter hydrocarbons, in addition to CO2 and water. In the past, mercury or cadmium lamps were used to emit light in low UV (sub 350 nm). However, modern advancements have allowed for the implementation of light-emitting sources such as Xenon flash lamps, which have wavelengths encompassing both the UV and visible spectrum (visible being between 450 – 780 nm).
UV-emitting LEDs are also becoming increasingly available on the market, and can serve as low-cost alternatives for niche UV applications. The IR spectral regime lies beyond 780 nm and opens up opportunities for absorption line measurements for heavier hydrocarbons, including CO, CO2 and water. These absorption lines can be selectively chosen for measurement using a bandpass filter – a common practice for non-dispersive infrared (NDIR) sensors.
With UV, visible, and IR spectroscopy, many of the operating mechanisms required to measure in these spectral regions are conceptually equivalent to that of a TDLAS system. Put simply, one would need an illumination source, a sample cell to house the process material, and a detector. The relative simplicity in this design is why these spectroscopy techniques are one of the most prominently used methodologies for process detection. These techniques also encompass the widest variety of applications, which are not just limited to the hydrocarbon industry. Sourcing parts and components for these spectrometers is generally simple as well. Online monitoring is another worthwhile benefit of these spectroscopic analysers, and ensures that process samples are not disturbed. This allows for a pure sample measurement to be made with a fast response time (typically 1 sec.), which is useful when monitoring especially-hazardous process constituents.
A common flaw associated with these analysers, however, is their low sensitivity ranges compared with other techniques. Detection limits are typically within the ppm range, with smaller detection ranges requiring costlier detectors, specially-tuned emission sources, or molecules with higher molar absorptivity. Sample calibration is also a common requirement, as electronic drift and sample changes will cause these analysers to deviate from their intended measurement ranges. There are several advantages and disadvantages to the analyser types that have been listed. For users that have process components whose spectral response encompasses a variety of spectral ranges, it is worth purchasing a platform that can integrate multiple optical approaches into its design. One example of this would be AMETEK’s IPS-4 Integrated Photometric Spectrometer. This analyser incorporates the Xenon flashlamp, allowing for measurements across much of the UV/vis spectra. It can also operate in a dual-bench configuration, enabling component measurement in the IR as well.
IR measurement is facilitated using a non-dispersive, steady-state emitter, with wavelength selection being obtained through bandpass filters. In either bench configuration, UV/vis or IR, this analyser can measure up to eight sample components in a temperature-regulated enclosure.
To understand how choosing the right analyser can have an impact on process and refining performance, it is important to consider the specific challenges that are common within the sulfur recovery unit (SRU) industry and for petrol manufacturers, and showcase how a complete analyser can help in overcoming these hurdles.
Applications that benefit from the integration of multiple measurement technologies
Solutions to common SRU deficiencies
For SRU facilities, there can be a multitude of compounding issues that must be mitigated to maximise elemental sulfur yields. These facilities often rely on the Claus process technique (see Figure 1), which has been known to recover as much as 95 – 97% of elemental sulfur. One common cause for drops in this efficiency can be attributed to an incorrect air-to-fuel ratio during ignition. Normally, it is desirable to reach H2S:SO2 stoichiometric ratios of 2:1 – although 3:1, 4:1 and even 5:1 are occasionally being seen – in order to maximise sulfur production, with oxygen helping to maintain this ratio throughout the process cycle.
Analysers in the Claus system are meant to adjust the amount of oxygen needed, based on the concentration levels of H2S and/or sulfur dioxide (SO2), but sudden concentration variations in the incoming gas can lead to oxygen imbalances.
Another concern with feed forward control is an overabundance of heavier hydrocarbons, due to spillover. At high temperatures, these molecules will easily react with oxygen being supplied to the furnace. This leads to the formation of water vapour, hydrogen (H2), CO and CO2, as can be seen below with CH4:
CH4 + O2 → CO2 + H2O CH4 + H2O + O2 → CO + H2 + CO2
While H2S may stay elevated during this time, SO2 will see a fall off due to poor oxygen presence. When condensers expect to see a set amount of SO2, which is not present (due to reduced yields), this leads to a run-off in SO2 through the catalyst. This poses a significant risk to the scrubber media, as the presence of SO2 could trigger acid corrosion as it makes its way to the tail gas treatment unit (TGTU).
Given that these circumstances can have a substantial impact on potential elemental sulfur sales and process infrastructure, it is important to have an analyser that is capable of monitoring H2S along with varying C1+ molecules. Such an application showcases the benefit of utilising a dual-bench UV-vis/IR approach on process measurement. The H2S is measured by the UV bench, and the heavier hydrocarbons are analysed within the IR bench. If multiple analytes require monitoring, an analyser that can provide multi-component analysis can act as both a practical and economic investment for the user.
Petrol product colour measurement
The production of petrol-based commodities, such as refined oils, traditionally calls for the removal of as many heavier hydrocarbons as possible through distillation and cracking. This is necessary to ensure that the quality of the product (i.e. its selling value) is maintained. On occasion, these stored products (such as kerosene) may be subjected to contamination, or the product itself will show signs of degradation. Outside of storage, petrol discolouration from the norm can also signal signs of process upsets that taint the material. This behaviour of colour alteration opens a path for analysers to measure petrol product quality.
To better understand how colour works here, let us look at two common categories of hydrocarbon-based materials: aliphatics and aromatics. Aliphatics are derived from oils and/or fats and are hydrocarbons that have both hydrogen and carbon atoms linked via single, double or triplet bonds. This would include alkanes (e.g. methane), cycloalkanes (e.g. cyclopentane), alkenes (e.g. ethylene) and alkynes (e.g. propyne). Aromatics generally display flat, ring-shaped molecular structures with π-bonds that give them higher molecular stability. This type of hydrocarbon includes benzene, toluene, styrene and phenol. Figure 2 demonstrates the differences between aliphatic and aromatic structures.
Both types of hydrocarbons exhibit differing spectral properties in the UV/vis and near-IR range, with aliphatics existing primarily in the UV regime, while darker-coloured aromatics exist in both the visible and near-IR spectrum. As colour consists of a multitude of wavelengths, and the absorbance response of colour is wavelength-dependent, it is possible to exploit this behaviour for monitoring petrol quality. One common technique for evaluating the condition of these products is the use of the American Society for Testing and Materials (ASTM) colour standards, which would include Saybolt (ASTM D156) and ASTM (D1500) colour standards. ASTM D1500 scales are suitable for aromatics due to their darker colouration, while Saybolt is employed for lighter-coloured aliphatic products.
Colour scale units are used to represent the coloration of these hydrocarbon products. For example, Saybolt ranges from +30 to -16, though the colours that these units represent range from off-white to effectively clear. When the materials colouration lies outside of the intended colour range, this can be a sign of contamination or poor process refinement. A process analyser – such as the IPS-4 – can be calibrated in such a way that it can detect the absorbance response of a particular colour (at certain wavelengths) for real-time process quality assessment (in the UV/vis or near IR). This is performed by utilising known standards of colour representation (called tristimulus colour functions), which are representative of red, blue and green colouration. Through these functions, a link can be made between colour absorbance responses and its associated colour scale unit.
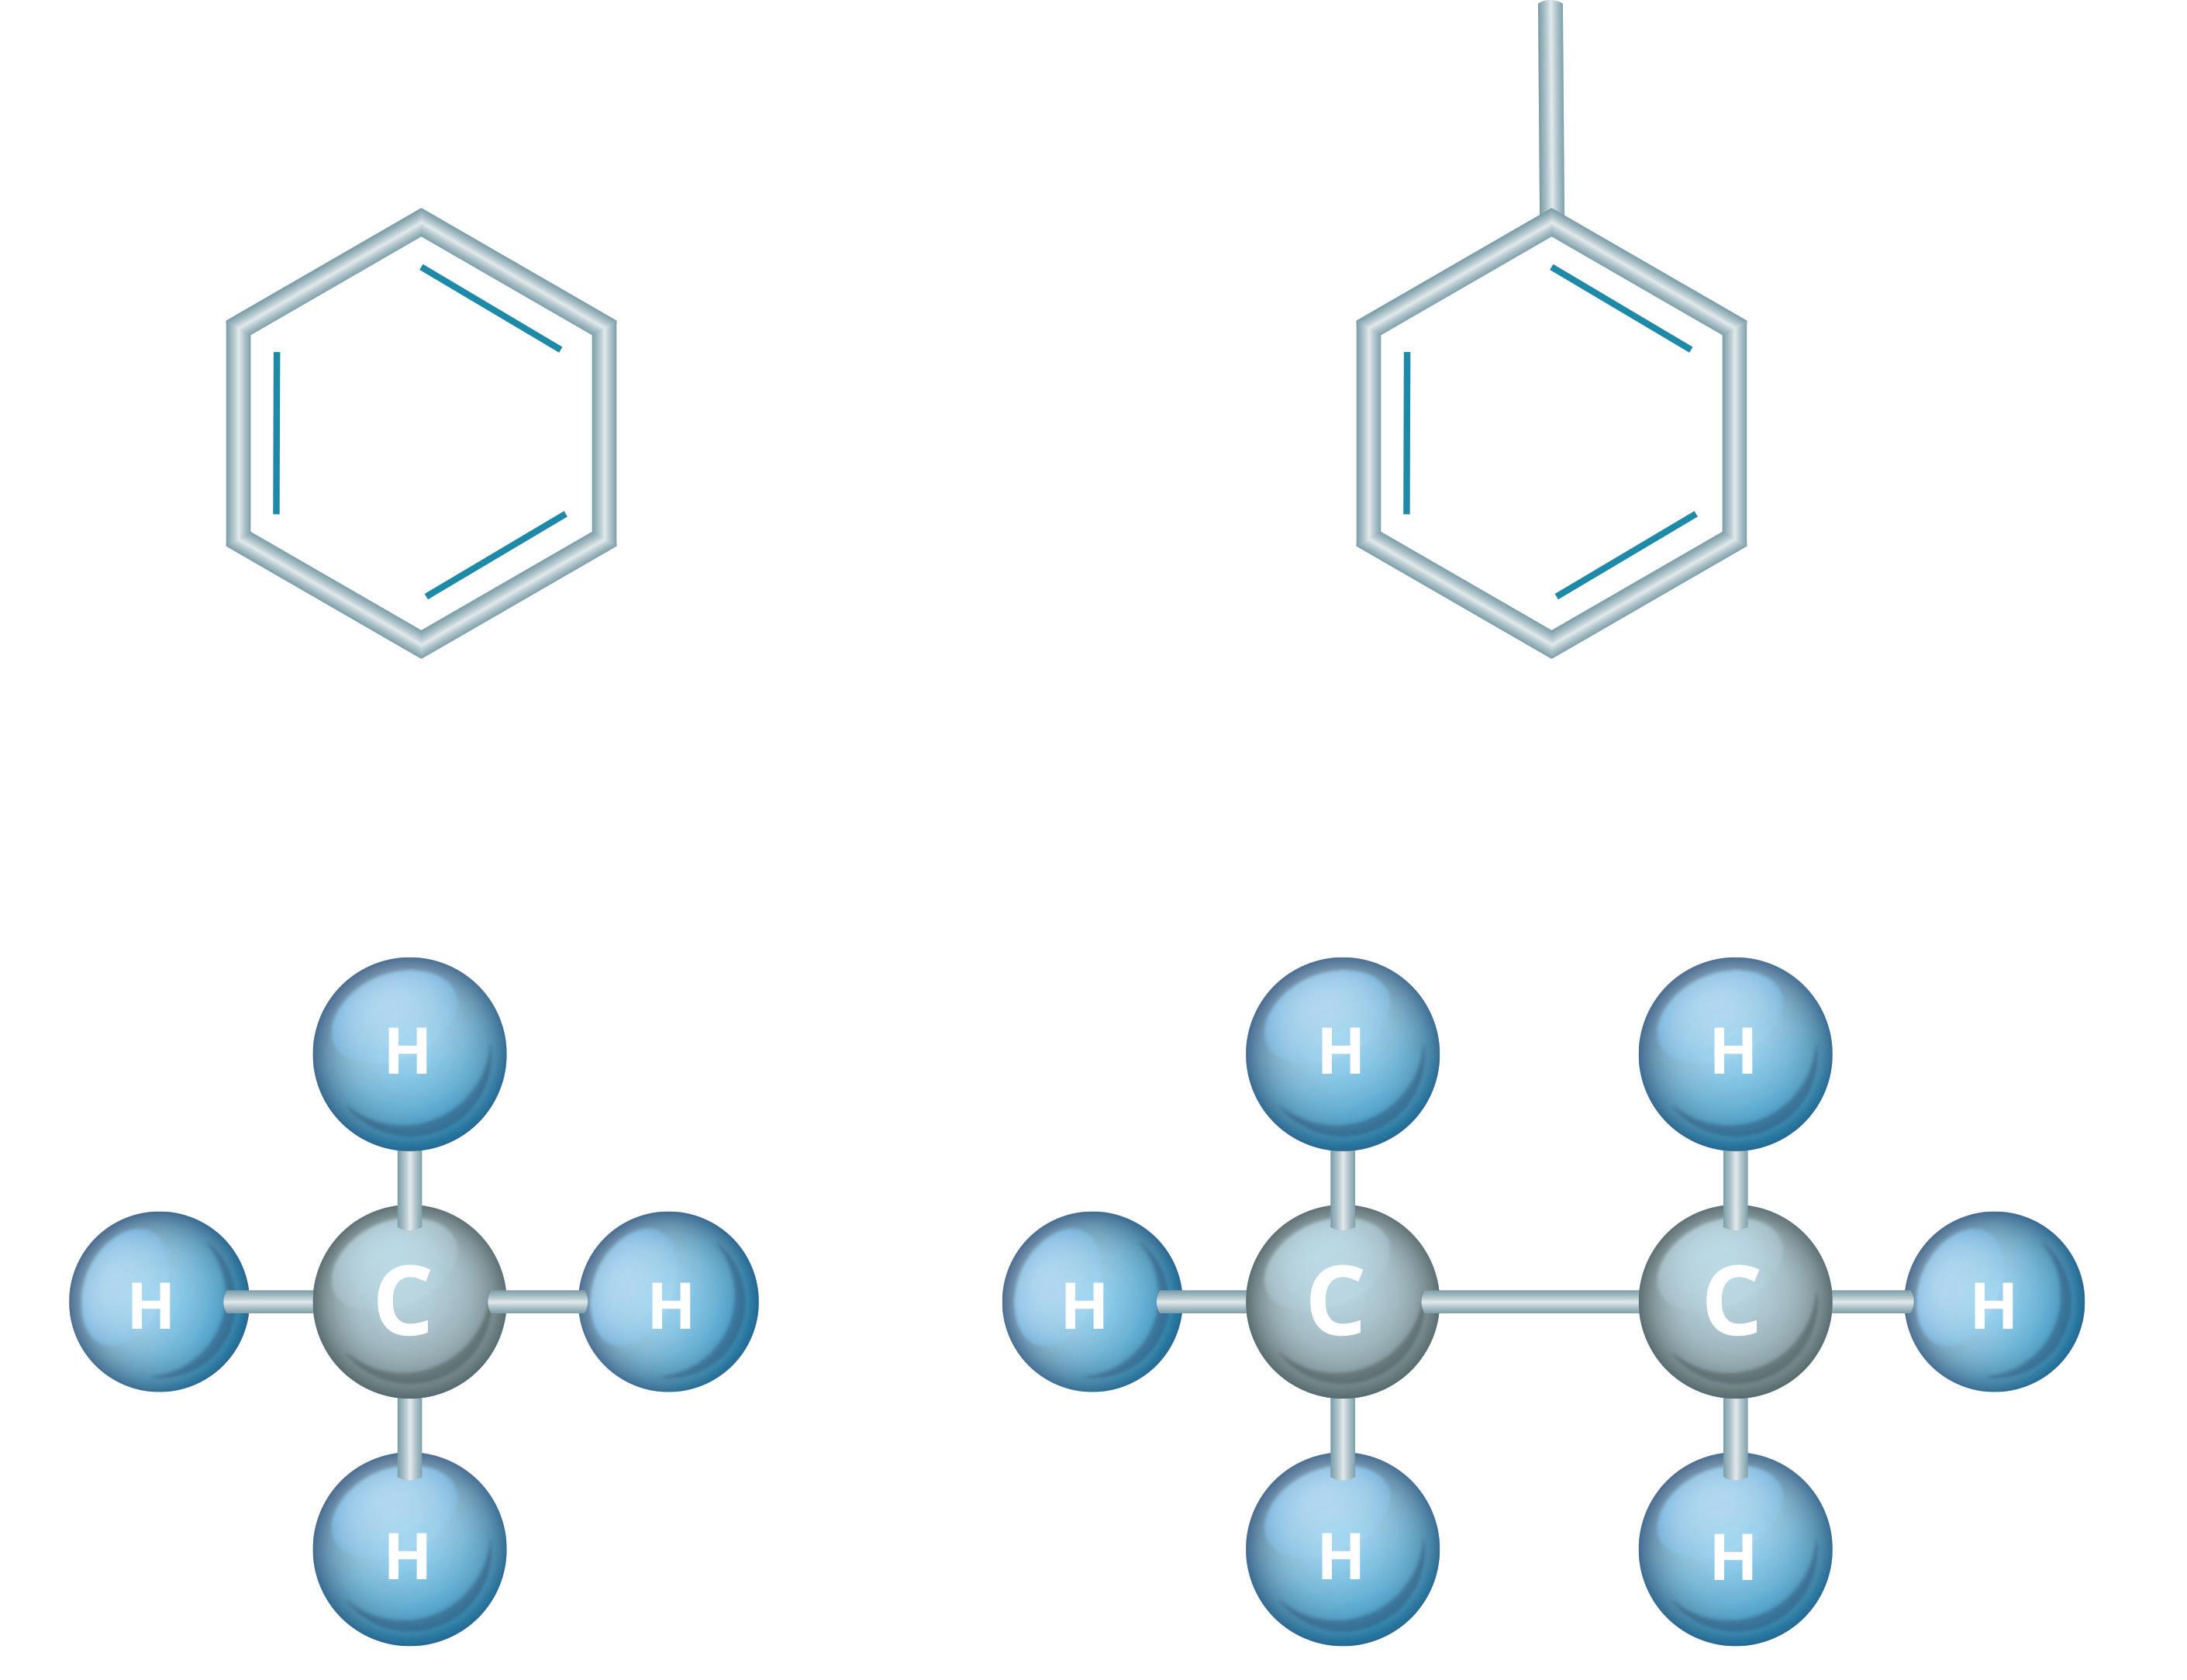
Figure 2. Aromatic and aliphatic molecular structure.
Conclusion
The diversity in hydrocarbon-based applications and products has necessitated the need for unique solutions in dealing with complications inherent to each process type, along with operating these facilities within industry and regulatory guidelines. To this end, process analysers serve as valuable instruments for evaluating product behaviour and detecting common process faults. Analysers that can implement multiple measurement technologies into their construction provide benefits such as a reduction in the total number of analysers required, reduction in spare parts, etc, thus reducing end users’ CAPEX and OPEX spending. Operators should consider using one of these advanced continuous sample analysers in future system designs and existing analytical system updates.