
Profitability “Best Practices” for Legal & Professional Services Firms

Introduction
Here it is – in this document we lay out everything that we know, think, and believe about how legal and professional services firms should analyze and report on profitability. This document is intended for Iridium clients that are kicking off their Profit module implementations, but will also provide significant insights on profitability reporting for any law firm management or financial professional. All concepts and practices that are detailed in this document are all fully supported by the Iridium BI Profit module.
Let’s Talk About “Rigorous Analysis”
The staff at Iridium has spent years studying and implementing profitability systems for law firms. We are confident that the Iridium BI Profit module has taken law firm profitability analysis to a level that has never been previously seen or even thought possible. Our clients are demanding, and we are committed to implementing their most challenging requirements.
Iridium is defined by rigorous analysis, innovation, quality, value, and service. You can see these values in this document and in our products.
Extremely Confidential Documentation

It would be a tremendous loss for Iridium if any of our competitors ever got their hands on a copy of this document. So, we are asking that you please, please, please help us to protect our hard-earned intellectual property and do not distribute this document outside of your firm.
This document contains confidential and proprietary information to Iridium Technology LLC and cannot be shared, distributed, reproduced, published without writt en permission from Iridium Technology LLC. This document should only be read by employees of Iridium Technology, Iridium clients, and Iridium prospects.
Iridium Technology – Profitability Best Practices | © 2022 Iridium Technology – now a part of BigHand 2
Iridium Technology – Profitability Best Practices | © 2022 Iridium Technology – now a part of BigHand 3
of Contents Overview ........................................................................................................... 3 The Purpose of Profitability Analysis 4 The #1 Best Practice: “Keep it Simple!” ........................................................ 4 Quick Introduction ............................................................................................. 5 The Income Statement 5 Data Sources...................................................................................................... 6 Data Sources 6 Residual Calculations 7 Profit Accounts .................................................................................................. 8 Profit Accounts - Introduction 8 Profit Account Types ..................................................................................... 9 Profit Account Categories ............................................................................. 9 Cost Data ......................................................................................................... 10 GL Costs ...................................................................................................... 10 Payroll Costs ................................................................................................ 10 Revenue Data ................................................................................................... 11 Revenue Data Granularity............................................................................ 11 HR Data............................................................................................................ 12 Defining Timekeepers 12 Timekeeper Assignments and FTEs ............................................................ 13 Allocation Process............................................................................................ 14 Allocation Factors 14 Allocation Matrix .......................................................................................... 17 The “Residual/Wash-up” Rule ..................................................................... 18 Dimensions for Analysis 19 Iridium’s Profitability “Thesis” ......................................................................... 20 Profit Scenarios ............................................................................................... 22 Iridium BI: Ten Profit Scenarios 22 Work Period Basis (Recommended Scenarios) 22 Collected (Billed) Period Basis (Alternate Scenarios) 24 Flexible Profitability Analysis ........................................................................... 26 Profit Scenarios 26
Table
Filtering Costs.............................................................................................. 26
Estimated Cost Rate 27
Estimated Realization .................................................................................. 27 Best Practices Topics ....................................................................................... 28
Should your Profit Cube Reconcile to your Income Statement? 28
Cost Smoothing – Timekeeper Level .......................................................... 29 Cost Smoothing – Matter Level 29
Calculating Cost Rates based on Alternate Hours 30 Part-Time Timekeepers 30
Calculating Profitability based on Standard or Adjusted Hours .................. 31
Timekeepers with High Costs (and Low Revenue/Hours) 31
Split Assignments 32 Non-Timekeeper Revenue .......................................................................... 32
Departed Timekeepers 33
Partner Compensation/Draws 33 Profitability Information Access 34 Profitability Dashboard Access ................................................................... 35
Special Topics .................................................................................................. 36
Bring us Your Toughest Customizations! 36 Handling Exceptions .................................................................................... 36
Loading Data from External Data Sources 37 Ad-Hoc Analysis (Power Users) ................................................................... 37 Multi-Currency Support .............................................................................. 38
The “PLACEHOLDER” Concept 38
Multiple Profitability Scenarios (Part 2) 38
Participating Attorney Slicing 39
GL Transactions for Timekeepers ............................................................... 39 Handling Inter-Office Cost Transfers 40 Appendix 1: Iridium BI Profit Dashboards .......................................................... 41 Home Page ................................................................................................... 42 Profit Manager – Role Overview Page 43 The Unit Page ............................................................................................... 44 Selection / Comparison (List Pages) ........................................................... 45 Client Detail Page 46
Iridium Technology – Profitability Best Practices | © 2022 Iridium Technology – now a part of BigHand 4
Overview
Welcome to the Iridium BI “Profitability Best Practices” white paper. This document will help you to learn how leading law firms are implementing tailored profitability analysis and reporting solutions. You will learn about the typical implementation decisions that firms need to make, and how those decisions will impact your analysis and reporting results. Every profitability implementation is different, and this document will spur discussions about the unique aspects of your firm’s profitability requirements.
The Purpose Of Profitability Analysis
Determining accurate profitability for the many components in your firm is a critical tool for improving overall firm performance and results. The most common key drivers behind a Profit module implementation are:
To help individual partners see the profitability of their book of business, allowing them to adjust leverage, rates, etc.
To identify the least profitable areas in your firm (clients, practice areas, timekeepers, etc.), allowing the firm to adjust course
To streamline the generation of monthly, quarterly, and annual profitability reports
To empower attorneys and firm managers to explore their profitability on a near real-time basis with role- based dashboards
To use profitability data as an input into the partner compensation process
The #1 Best Practice: “Keep It Simple!”
After years of experience with implementing profitability solutions for leading law firms around the globe, we can offer this “best practices” advice:
Wherever you can, keep it simple. You will have many decisions to make, and in most cases, you should go with the simplest choice. That means fewer allocation methods, fewer rules, and fewer exceptions.
We can say without a doubt that the firms which have simpler implementations are more satisfied with the results
Each time you reduce complexity, you:
Improve the ability to communicate the profitability calculations to the partners and firm management
Iridium Technology – Profitability Best Practices | © 2022 Iridium Technology – now a part of BigHand 1
Improve the overall trust in the profitability values and calculations
Reduce the culture where partners will continually feel entitled to lobby for more exceptions
Reduce the time required to rebuild/process the cube Improve the performance of ad-hoc queries and dashboards
— Reduce the amount of time that the finance staff will spend validating and justifying the cube values
— If there must be complexity, it is best to build up your allocations in an iterative manner since it is much easier to explain and refine than to start with complex rules
Quick Introduction
We will start with the clear statement that no two law firms are alike, and an out-of-the-box profitability solution will not meet the needs of your firm. This is the basic premise of our system architecture and design: each client must be able to customize all aspects of the profit module –with no limitations. So, while we are providing a generic overview in this section of how we think law firm profitability should be calculated, we want to emphasize that we fully expect to configure and customize our solution to match your firm requirements.
The Income Statement
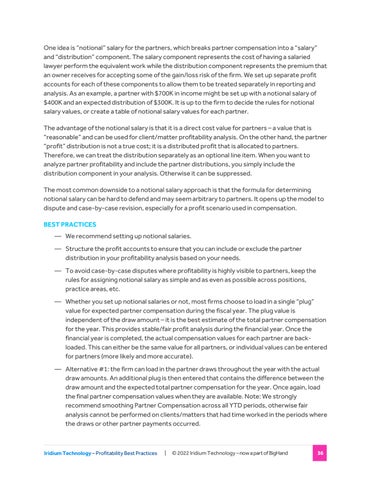
The screenshot below shows a sample Income Statement from our Profit dashboards:
Iridium Technology – Profitability Best Practices | © 2022 Iridium Technology – now
of BigHand 2
a part
If you are reading this document, then you are of course familiar with these two basic equations:
o Gross Profit = Revenue – Direct Cost
o Profit = Revenue – (Direct Cost + Overhead Cost)
The power of the Iridium BI Profit module is that you have full control over every piece of data and the rules behind the equations – with no limits. Direct Costs are assigned to a single timekeeper. Typical direct costs are salary, bonus, taxes, benefits, etc. Your firm determines which costs are direct, and how you want to combine them and report on them. Overhead Costs are assigned to timekeepers by allocation methods. Typical overhead costs are Admin, IT, HR, Rent, etc. Your firm determines the allocation rules – again with no limits.
Profitability is calculated at the level of Timekeeper + Matter in each period. The cube then aggregates those values to report profitability by Office, Department, Team, Parent Client, Client, Matter Responsible Attorney, etc.
Data Sources
The Iridium BI Profit module allows firms to load in revenue, costs, and other data from multiple sources. Examples of sources could be your Practice Management System (“PMS”) General Ledger, PMS Time & Billing, Payroll, FTE spreadsheets, etc. There are no limitations on including the data sources that your firm needs.
These are the Data Sources that are typically defined in a client implementation:
REV
• Revenue values include billable hours, billable fees, billed fees, collected fee, writedowns and write-offs, etc.
• Revenue is loaded from the Iridium BI Revenue module. This assures that the Profit module and the Revenue module will be in reconciliation.
• We do not require you to purchase the Iridium BI Revenue module in order to load revenue into Profit module
GL-IS
GL-BS
• GL-IS indicates Income Statement data from your PMS GL
• This is the expense data from your GL
• GL-BS indicates Balance Sheet data from your PMS GL
• Note that many firms will not bring any balance sheet data across, and for those that do this, it will typically be limited to partner compensation information
PAYROLL
• Typically, compensation data will come directly from your payroll system, but in exceptional cases a firm may be storing compensation data in its GL
• The main idea here is to load these costs as direct cost for timekeepers. Typically, all payroll systems have these costs in this format (per person) whereas the GL only has aggregated data.
• Iridium provides tables that serve as a staging area for loading your payroll costs
Iridium Technology – Profitability Best Practices | © 2022 Iridium Technology – now a part of BigHand
3
Other
• Firms have the option to load additional costs from any external system
• As an example, your firm might have costs for the Ukraine office only available in a spreadsheet
Residual Calculations
For some firms the payroll costs will not tie to the GL costs in the corresponding accounts. As an example, the payroll for January may total to $3.3 million in the payroll system, but the GL accounts may total $3.4 million. Your firm then has a choice: should we load that missing $100K residual, or do we stick with the $3.3 million value in the payroll file? And if your firm decides to load the missing $100K, how should it be allocated?
BEST PRACTICES:
We fully support either loading the residual or suppressing it. It is really your firm’s choice.
— If we had to recommend a choice, it would be to load the GL residual. The costs are in the GL, so they are probably real costs that should be included in your profitability analysis.
— If you will load the residual costs, we will create a Profit Account for “PAYROLL-RESIDUAL”, and allocate it to timekeepers based on your choice of method.
PROFIT ACCOUNTS
A Profit Account is a grouping of costs and/or revenue that will make up your income statement. Typically, there is a “many to one” mapping between your GL accounts and Profit account. Each firm has a profitability implementation decision: how many Profit Accounts should I define, and what GL accounts will we map to each Profit Account? Note that the Profit Accounts are a key concept in your profitability analysis, and this is one of the decisions that has the biggest impact on the complexity of your profitability implementation. The two options are:
1. Aggressive Rollup (recommended): Aggressively roll up GL accounts into Profit Accounts. An example of this strategy would be if a firm has 300 GL accounts and rolls them up into 15-20 Profit Accounts. The advantages of this strategy include smaller cube size, better performance, faster processing, and easier reconciliation.
2. Less Aggressive Rollup: An example of this strategy would be rolling up 300 GL accounts into 60 Profit Accounts.
Let’s look at an example of two GL accounts to determine how we should design the Profit Accounts:
Iridium
–
Best
| © 2022
4
Technology
Profitability
Practices
Iridium Technology – now a part of BigHand
The question is “for these two GL accounts what are the reporting and analysis requirements?”. There are several basic options:
Report on them as individual line items (rows)
Combine them into a single line item (row) for “Professional Insurance”
Roll them up into a more generic line item (row) for “Insurance” and add 5 other GL Insurance accounts
Roll them up into an even more generic line item for “Firm Business Expenses”, combining them with 50+ other GL accounts.
So how do we determine which solution is best? There are two basic questions:
1. Will both costs use the same allocation method? If not, then they should be in separate Profit Accounts. (Alternatively, we can define a Profit Account variant and leave it defined as a single Profit Account)
2. Will the firm want to see these costs broken out as separate line items when reporting on profitability? If “No” and they have the same allocation method, then we will want to combine them.
BEST PRACTICES
— Choose “Aggressive Rollup”, and keep the number of Profit Accounts to around 20 or less.
A key benefit of aggressively rolling up is that your cube is more “defensible”. Think of it this way: the more profit accounts and allocations that you have, the more opportunities that there are for the lawyers in your firm to question the allocations and request more exceptions. So once again, we strongly recommend that you keep it simple by limiting the number of Profit Accounts.
Profit Account Types
Each Profit Account is assigned to a Profit Account Type. This is a high-level grouping of Profit Accounts that defines the first tier of the Profit Account hierarchy. The list of the types is defined by Iridium and cannot be changed. But you still have the choice to assign every Profit Account to one of the Profit Account Types.
Please note for each Profit Account Type, there is a measure in the cube with the same name. So, assigning the Type to each Profit Account controls what val ue will be calculated in the associated measure.
Iridium Technology – Profitability Best Practices | © 2022 Iridium Technology – now
5
a part of BigHand
Profit Account Types (Fixed):
Profit Account Type Description
Revenue
Direct Cost
Overhead Cost
Gross Profit
Profit
• Revenue that is assigned to timekeepers (typically assigned directly and not allocated)
• Costs that are passed directly through to the associated timekeepers
• Costs that are processed by the profitability engine and are allocated to timekeepers based on the rules and methods defined by the firm
• This is a system-defined Profit Account and cannot be removed or modified by clients
• This is a system-defined Profit Account and cannot be removed or modified by clients
Profit Account Categories
Each Profit Account is also assigned to a Profit Account Category. This is a second level grouping of Profit Accounts. These are not predefined like the Profit Account Types, so you can define new Profit Account Categories.
Default Profit Account Categories (can be modified by client):
Profit Account Category Description
Revenue
Direct Cost
Overhead Cost
BEST PRACTICES:
• Revenue that is assigned to timekeepers (typically assigned directly and not allocated)
• Costs that are passed directly through to the associated timekeepers
• Costs that are processed by the profitability engine and are allocated to timekeepers based on the rules and methods defined by the firm
If you want to do an analysis with a rollup of Profit Accounts that is different from the pre -defined Profit Account Types, this is your chance to do it. For example, your firm might have four Profit Accounts associated with Occupancy, and you could then define a Profit Account Category for Occupancy to roll them up for reporting and analysis.
6
Iridium Technology – Profitability Best Practices | © 2022 Iridium Technology – now a part of BigHand
Cost Data
Once you have defined your Profit Accounts, the next step is to create the mapping between the GL Accounts and the Profit Accounts, and then load the cost data.
GL Costs
This is a pretty straight-forward operation: For each GL cost account, the first question is whether or not you want to bring the cost from the GL into the Profit module. There are three reasons to exclude the GL Account from the mapping:
The account is inactive, and there are no costs in the years for which the profit module will be populated
The account costs will be loaded from another source, such as payroll costs. In this case please note you still might want to map this account since the residual amount should be calculated, loaded, and allocated.
The account is not appropriate for loading into profitability – for example, it is an account that your firm is manually suppressing in the firm Income Statement
Payroll Costs
Each firm will need to determine the granularity of the payroll costs that they will bring into the profit module. Your payroll system may allow you to provide 20 or more “types” of costs: New York unemployment tax, life insurance deduction, retirement account contribution, health insurance, etc. This level of granularity is not required or applicable to profitability analysis. You will need to roll up these costs into Profit Accounts such as Salary, Bonus, Benefits, etc.
The table below shows a typical set of Payroll Profit Accounts. Your firm is encouraged to edit the payroll Profit Accounts and create new payroll Profit Accounts if necessary.
Profit Account Details
COMP-SALARY
COMP-BONUS •
COMP-PARTNER
COMP-OTHER
Iridium Technology – Profitability Best Practices | © 2022 Iridium Technology – now a part of BigHand 7
• Salary costs
Bonus
costs. Some firms will create several additional bonus Profit Accounts to be able to report on different types of bonuses
• Partner-specific costs
• Can be used to hold retirement account matching, insurance, and other miscellaneous payroll costs
BEST PRACTICES:
Sticking with the mantra of “Keep it Simple”, we encourage clients to limit the granularity of payroll costs to 4-6 Profit Accounts. So, if you are thinking about creating a Profit Account for “Benefits”, think about how this will be represented when reporting on profitability. Do you really need to know that $16 of the partners $360/hour cost rate was for Benefits? If so, then define a Profit Account for Benefits.
Iridium Technology – Profitability Best Practices | © 2022
– now
8
Iridium Technology
a part of BigHand
Revenue Data
Revenue data is typically loaded directly from the Iridium BI Revenue module. This assures that the Profit module and the Revenue module will reconcile. We do not require you to purchase the Iridium BI Revenue module to load revenue into Profit module.
Revenue Data Granularity
Revenue is typically copied directly from the Iridium BI Revenue module, including many of the detailed metrics available e.g. Billable Hours, Billable Fees, Fees To Bill, Fees Billed, Fees Collected, Fees Write Up (Down), Fees Write Off etc.
The detailed revenue data is aggregated to the granularity of period + timekeeper + matter. So, if an attorney had ten time entries in January on three different matters, then the Profit module would roll that up into three entries for the period (one per matter).
While there is no limit on how many different types of revenue your firm can track in the Profit module, typically firms go with one of these options:
A single revenue account for “Revenue – Fees”
Two revenue accounts: “Revenue – Fees”, and “Revenue – Fees Non-timekeeper”
Iridium Technology – Profitability Best Practices | © 2022 Iridium Technology – now
9
a part of BigHand
HR Data
One of the biggest deliverables of your profitability implementation is to assign and allocate costs in each period to the timekeepers in your firm. The costs are then further applied to the matters for that timekeeper within the financial year. Since many allocations are based on the office or title of the timekeeper, it is important that you have accurate assignment data for each timekeeper. Specifically, you need to load the office, department, team, and title for each timekeeper (note that “title” is the Iridium BI nomenclature for “rank” or “personnel type” for ADERANT Expert clients). Your firm will also need to load the FTE for each timekeeper in each period.
Defining Timekeepers
Only working attorneys that are defined as timekeepers in the Profit module will be able to receive allocations and keep their direct costs and revenue. That does not necessarily mean that all people who are working attorneys in the Revenue module must be timekeepers in the Profit module. Logically we can split the working attorneys from the Revenue module into timekeepers and nontimekeepers. We can configure special rules tailored to your firm to determine who is and who is not a timekeeper in the Profit Module. For example, you may have a certain group of people who could be described as assistants, but they still may be doing some work and generate revenue. If you do not want to measure the profitability for these assistants, you would not define them as timekeepers in the Profit module. In this case, they would not get any costs allocated, and all their revenue and direct costs could/would be reallocated to the real timekeepers.
Defining the exact list of timekeepers in a year is the key aspect of the Profit implementation!
Your firm will use the table below to define the timekeepers within your profit module implementation:
Item Details
What is the Timekeeper Criteria?
• Will the Profit module timekeepers be defined using the Title (for Expert clients sourced from Rank or Personnel Types)?
• What are the other criteria for defining timekeepers?
• Out of the box there is a filter implemented that timekeepers must have more than 100 annualized billable hours in the financial year otherwise they will be downgraded to non-timekeepers. Your firm can adjust the cutoff value. Some firms choose to go with zero as the cutoff value: if an employee has one billable hour in the year, then they are considered a timekeeper and will be included in profitability reporting and analysis.
• Note: If there are timekeepers defined who have no revenue then it is not possible to allocate their cost to matters and therefore the PLACEHOLDER matter is used in this case.
Which Titles are considered to be Timekeepers?
• Based on the timekeeper criteria, we will create a list of the titles/personnel types that will be considered timekeepers
Iridium Technology – Profitability Best Practices | © 2022 Iridium Technology – now a part of BigHand 10
Are there any exceptions?
• Your firm will have the chance to define rules for who is a timekeeper in a financial year to handle your exceptions. For example, your firm might have a rule that the associates are not considered timekeepers in their first two periods after joining the firm while they go through training.
Timekeeper Assignments and FTEs
Each timekeeper should have an FTE greater than zero in any period where they will receive cost allocations (depending on the allocation rules).
Your firm will use the table below to describe the handling of assignments and FTEs within your profit module implementation:
Item Details
Source of the HR Data?
• What is the system of record for Office, Department, Team, and Title assignments? Is it Payroll, the PMS, or a spreadsheet?
• What is the system of record for FTE values? Is it Payroll, the PMS, or a spreadsheet?
• The ideal source for all these values would be the PMS Granularity of the HR data
• For each timekeeper and period combination, we should track the following: o Office, Department, Team, and Title (this is called assignment) o FTE
• Does the system of record provide the same Titles as defined in the previous section, or will there be a mapping/translation required?
Non-Timekeepers
• It is highly recommended to keep both timekeepers and non-timekeepers in the HR data
• We often need to preprocess non-timekeeper revenue and cost and assignments for non-timekeepers help to achieve this goal
• Non-timekeepers would be flagged in the bi.ProfitCopyHr table with Type = “N”
Split assignments
• Iridium Profit module supports split assignments. This means that each timekeeper can be assigned to more than one organizational unit in each period where the FTE would be split across these.
• E.g. a timekeeper can have these two assignments (records in the HR table): o New York office, Litigation department, Associate title, FTE 0.75 o New York office, Commercial department, Associate title, FTE 0.25
Note: Loading and validating assignment and FTEs for all timekeepers is a key implementation deliverable. Your firm needs to make sure that there are no gaps (missing assignments, timekeeper with hours but no FTE, etc.).
Iridium Technology – Profitability Best Practices | © 2022 Iridium Technology – now a part of BigHand 11
Allocation Process
At this point we have determined the sources of our revenue and costs and who we consider timekeepers for profitability purposes. If every aspect of revenue and cost could be directly assigned to a timekeeper, the profitability calculation would be mostly complete. In pract ice, much of the costs and perhaps also some of the revenue cannot be directly assigned to timekeepers and instead must be allocated.
Cost is primarily calculated from the GL journal and payroll costs. Some cost may be assigned to timekeepers as direct costs with a minimum of allocation (mostly compensation or direct support staff costs), but a large portion of the cost is allocated from organizational units (offices, departments or the firm as a whole) to the timekeepers in them as overhead costs.
Generally, the assignment of traditional fee revenue to active timekeepers is straightforward. They did the work, so they are assigned the revenue. The problem is that not all revenue comes from active timekeepers. Collections revenue may arrive after the person who did the work departs the firm and some revenue will normally be generated by non-timekeepers. Occasionally, there are practices that operate under non-traditional fee agreements where revenue may accrue to the practice or a team and not individual timek eepers. In these cases, some type of revenue allocation may be required.
Though there are typically revenue allocation decisions that the firm must make, the overwhelming work of allocations in profitability still relates to the fair allocation of cost. This section covers the allocation process in detail, and introduces the key concepts of allocation factors, the allocation matrix, title points, etc. While these factors are discussed in terms of their use in cost allocation, the same mechanisms may be used for revenue allocation as well, either as revenue allocated to timekeepers or as offsets to cost.
Allocation Factors
An “Allocation Factor” defines a numerical value for each timekeeper in each period that is used to proportionally allocate costs to him/her. These factors are calculated and stored in the HR table (measure group). They are also available in the cube for browsing. For example, if a timekeeper has an allocation factor of 0.5 in a period, and the total of the allocation factors for all timekeepers in their department is 10.0, then that attorney will be allocated 5% of the department expenses.
You can say that if a timekeeper has one or more non-zero allocation factors then they are a timekeeper receiving cost allocations. On the other hand, non-timekeepers should have all allocation factors set to zero.
Each factor can be conceptually associated with an allocation method based on a weight calculated from Title Points (weightings), FTEs, Headcounts, or any other value. Your firm is provided with a “blank whiteboard”: there are no restrictions on how many methods (and factors) can be defined,
Iridium Technology –
Best Practices | © 2022 Iridium
– now
12
Profitability
Technology
a part of BigHand
and you can define new allocation methods.
The methods listed below have been pre-defined in the Iridium BI Profit Module. Again, consider this list to be a starting point. If your firm requires a custom allocation method such as “based on shareholder points” then Iridium can implement that method for you. Note that Iridium has done dozens of custom allocation methods for our clients, and we have never been stumped.
The allocation process is typically a two-level allocation. Technically this may happen in one step, but conceptually we allocate the costs first to timekeepers and then to their matters. Please note that all the following allocations methods are related to timekeepers only. The matter allocation is almost always based on hours worked on each matter.
Method Details
Title Points – FTE
• This method defines points for each Title. For example: Partners 3, Associates 2, Paralegals 1
• The costs are then further adjusted by FTE, so a 0.5 FTE timekeeper will only receive half of the points/costs that a full-time timekeeper with the same rank will receive.
• Note Title can be substituted with Personnel Type or other dimension
Title Points – Headcount
Billable Fees
• Same as above, but with no FTE adjustment
• Timekeepers with larger billable fees will receive more costs
• Example: We think that attorneys with higher billable fees use more accounting resources, so we will allocate Accounting Department costs based on percentage of billable fees.
Billable Hours
(No Allocation)
• Timekeepers with larger billable hours will receive more costs
• Example: We think that attorneys with higher billable hours use more IT resources, so we will allocate IT Department costs based on percentage of billable fees.
• This is not actually a method, but is included here to indicate that some costs will pass directly through the profitability processing engine and remain with their associated timekeepers
• While this method is typically only used for direct costs such as compensation, occasionally clients will directly assign overhead costs. As an example, training might be considered as overhead, but the training cost for an individual might be loaded and assigned only to that individual.
Assistant (Secretary) Assignment
Office Square Footage
• Allows you to define percentage share of assistant assignment for allocation of costs/revenue
• “That assistant is assigned 30% to partner Jane, so Jane will receive 30% of that assistant’s cost”
• Allows you to define percentage share of occupancy costs based on office square footage for each timekeeper
• “Partner X has an office of 200 square feet. The total office space is 1000 square feet, so partner X will receive 20% of the occupancy cost for the office.”
Other (Custom)
• For example: Allocate by partner shares. If you require custom methods, Iridium is glad to discuss options with you. And again, we have not been stumped yet…
Iridium Technology – Profitability Best Practices | © 2022 Iridium Technology – now a part of BigHand 13
BEST PRACTICES
It is suggested to stick with just a couple of allocation methods, and many Iridium clients are satisfied using only the method “Title Points” for all allocations
Note that you can still filter groups of timekeepers out of cost allocations. For example, you can allocate partner retreat costs using Title Points, but limit the recipients to equity partners (2 points) and income partners (1 point).
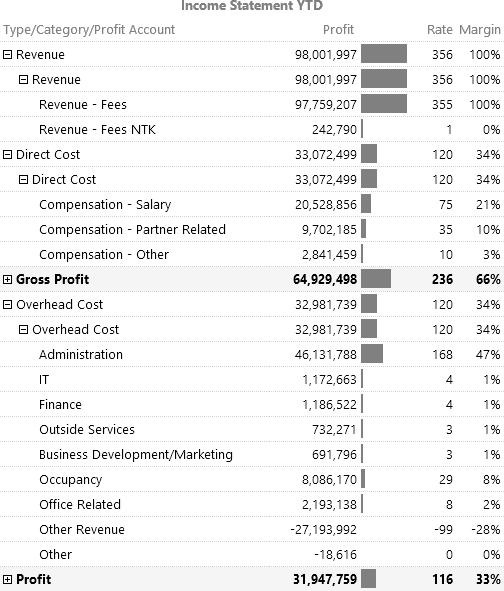
TITLE PROFILES
Many firms want to define allocations where different Titles get different allocations, for example “partners get 3 points, associates get 2 points, and other timekeepers get 1 point. Here is a sample set of Title Points:
Notes:
Instead of Title (Rank), ADERANT clients can use Personnel Type or Work Type. These title points are implemented as multiple allocation factors (as described previously)
Title Point Profiles are the mechanism to define and apply title points to allocations. Each firm can define as many Title Point profiles as they need, and then assign point values to each Title in the profile. For example, a firm might define two Title Point Profiles: “All Timekeepers”, and “Lawyers Only”. The power of having multiple point profiles is that you can set up allocations where only partners or only lawyers receive costs. It is not a requirement that a title has the same points in all profiles; i.e. partners can have 3 points in one profile and 2 points in another.
Iridium Technology –
Best Practices | © 2022
– now
14
Profitability
Iridium Technology
a part of BigHand
These are the examples of common Title Point Profiles:
Title Point Profile Details
ALLTK
LAWYERS
PARTNERS
• All timekeepers will receive costs based on their assigned points
• Only lawyers will receive costs
• Only partners will receive costs
Note that the granularity of the Title Point Profiles is based on the Titles that your firm has chosen. So, if you are loading two types of partners such as equity and non-equity, then you can assign them different points within Point Profiles, or even have separate Title Point Profiles for PARTNERS-EQUITY and PARTNERS-NON-EQUITY.
Allocation Matrix
The Allocation Matrix allows the firm to define allocation directives for any given Profit Account to load costs from one or more of the sources and allocate it to timekeepers in a specific allocation group using a specific allocation factor (method). If the allocation matrix is empty and no directive exists, then no cost will be allocated to anyone and the cost table will remain empty.
Examples of the allocation directives:
For Profit Account “IT” load the cost from GL and allocate it to the timekeepers in the respective office using a “Partner 2, Others 1” method (factor)
For the Profit Account “Training” see if the timekeeper ID is stamped on the GL record and in that case directly load the cost to this timekeeper. Otherwise allocate it to all timekeepers in the respective office + department combination using a “headcount” method (factor).
— After all directives have been applied, there should be no costs that remain unallocated. If there are leftover costs, then the firm will want to define a “wash-up rule” to make sure that any costs that were skipped are allocated to timekeepers. (The wash-up rule is covered in detail in a separate section below).
SOURCES OF COSTS
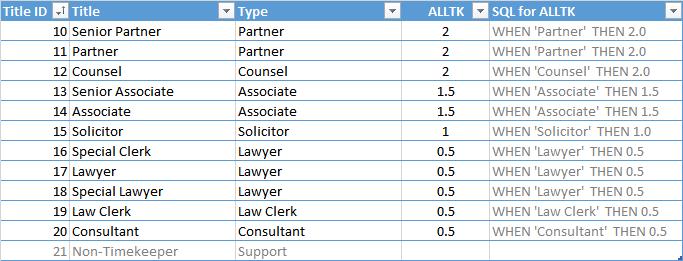
Currently there are 6 sources which can be used to load the costs from:
IMP – (“IMPORT”) this represents an external source from which the costs can be loaded. Technically there is a table called bi.ProfitCostImport that needs to be pre -loaded with the exported data – typically from an external payroll system.
Iridium Technology –
Best Practices | © 2022
– now
15
Profitability
Iridium Technology
a part of BigHand
—
GL-WA – this represents the portion of the GL journal entries that are stamped with working attorney. This method (if used) will have priority over the remaining methods. Please note, the cost will only be picked up if the person is defined as timekeeper in the Profit module.
GL-PP – this represents the portion of the GL journal entries where both office and department are practicing (“P”) offices/departments.
GL-PS – this represents the portion of the GL journal entries where office is a practicing (“P”) office AND the department is support (“S”) department
GL-SP – this represents the portion of the GL journal entries where office is a support (“S”) office AND the department is a practicing (“P”) department
GL-SS – this represents the portion of the GL journal entries where both office and department are support (“S”) offices/departments.
You can define separate allocation directives (in the allocation matrix) to handle the costs in each source differently. The following picture presents this information graphically:
ALLOCATION GROUPS
An “Allocation Group” defines a business unit that will receive allocations but also constrains the source of the cost to the same unit.
For example, the “OD” allocation group represents a combination of offices and departments. If you use this group, then all costs in each Profit Account will be grouped by office and department and each unit will only be allocated to the people in the same office and department combination. E.g. Training costs in the San Francisco office, Intellectual Property department will be only allocated to the 10 attorneys working in that office and department. If the cost exists in GL but in HR no one is assigned to that unit in that period, no allocation will take place; in which case, we will be relying on the wash-up rules to allocate the cost to someone either in the office or department or firm-wide.
Iridium
–
Best Practices | © 2022
– now
16
Technology
Profitability
Iridium Technology
a part of BigHand
These are the default Allocation Groups:
Firm-wide: Allocate the costs to all timekeepers across the firm, regardless of the office or department where the costs originated
Office: Allocate these costs to all timekeepers within the office (as defined in HR) where the costs originated
Department: Allocate these costs to all timekeepers within the department (as defined in HR) where the costs originated
— Office + Department: Allocate these costs to all timekeepers within the office and department combination (as defined in HR) where the costs originated
Team: Allocate these costs to all timekeepers within the team (as defined in HR) where the costs originated (Team represents either profit center or cost center)
Company, Office Group (“super office”) and Department Group (“super department”) are also supported.
Firms can also define other allocation groups, but we have found that the above allocation groups cover the needs of the vast majority of firms.
BEST PRACTICES
Since the entire Allocation Process is customizable there can be other rules and pre/post processing defined
It is strongly suggested to stick to simple rules
The “Residual/Wash-up” Rule
You can say that the allocation directives are working like a sieve: As each allocation rule is applied another portion of the costs are assigned to timekeepers. In some cases, there will be some costs left in the sieve after all the directives have been applied. This typically occurs in allocations by office + department, where there are no timekeepers in an office + department combination during a period. To make sure that all costs from the GL will be allocated to timekeepers, we can define a wash-up rule. A typical example of a wash-up rule would be “take any costs that were not allocated and push them out firm-wide using Title points”.
Please note that in the case where we are loading the direct costs from an external payroll system, we do not call this a wash-up – we refer to this as a “residual”. Apart from the different name, there are no other variances. In other words, no matter how we load the cost whether from GL or from payroll we always try to match the GL balance as the last step for the selected profit accounts.
Iridium Technology – Profitability Best Practices | © 2022 Iridium Technology – now
17
a part of BigHand
BEST PRACTICES
For firms that have simple allocations and rules, a wash-up rule is typically not necessary. This also provides for a good validation: if there are any costs not allocated then we need to investigate why.
As your firm defines more granular allocation rules, the chances of requiring a wash-up rule go up. Specifically, when you have rules that are doing allocations within the office + department combination, then there is a good chance that you will get unallocated costs.
The wash-up rule is predefined to be using firm-wide allocation. The reasoning behind this is that if the regular allocation directives are defined reasonably well and the quality of the data is good, then there should be a zero balance or only a small amount in this account that needs to be allocated. If the amount is relatively large, then we will work with the firm to add/refine allocation directives and/or improve the data quality to reduce the wash-up amount.
Dimensions for Analysis
Once the allocations have been applied, users can analyze and report on profitability using the following dimensions that are defined in the profit cube:
Dimension
Office
Department
Team
Title
Working Attorney
Matter
Participating Attorney
Payor
Additionally, you can slice/filter by many other attributes on the clients, matters, attorneys, etc.
Are there any additional groups or filters that your firm requires?
Description
• Included in core product. This includes Office Group hierarchy
• Included in core product. This includes Department Group hierarchy.
• Included in core product
• Included in core product
• Included in core product. Although the dimension contains all personnel in the firm, only timekeepers should have data (revenue, cost, hours, etc.)
• Included in core product. This includes hierarchies: Parent Client, Client, Matter Billing Attorney, Matter Responsible Attorney, Client Responsible Attorney, and many others…
• Included in core product
• Included in core product
• Included in core product: Matter Type, Client Type, Open Date, etc.
• Iridium can configure/customize the dimensions and attributes supported based on your firm requirements
Iridium Technology – Profitability Best Practices | © 2022 Iridium Technology – now
18
a part of BigHand
Iridium’s Profitability “Thesis”
Law firms have been doing detailed profitability analysis for decades, and they have always been limited by the capabilities of their systems and applications. This has resulted in the adoption of “best practices” methods that in many cases have severe shortcomings and distort the true profitability statistics.
Iridium is pleased to offer a solution that offers multiple scenarios for how firms can calculate profitability, and we will cover those scenarios in detail in the next section. But before we introduce you to the profitability scenarios that are available, we want to have a general discussion about our best practices methods which enable law firms to calculate profitability with far greater accuracy than has been previously achieved.
This is our thesis for law firm profitability calculations:
Every worked hour has a single cost, and it should only be calculated in the work period
— The revenue generated by the hour of work can become collected revenue many months later
There are two basic profitability approaches:
o Start with the Costs
§
If you start with the costs, then you must find all your associated collections and shift them back to the periods where the costs occurred
§
This is because the collected revenue in any period in your GL is mostly unrelated to the costs in the same period
o Start with the Collected Revenue
§
If you start with the collected revenue, then you must find all your associated costs and shift them forward to the periods where the collections occurred
§ This is because the costs in any period in your GL are largely unrelated to the revenue in the same period
§
Variant: Start with the Billed Revenue. Conceptually this is identical to starting with the collected revenue.
Any method that calculates profitability where the costs are not strongly tied to the collected revenue is inherently flawed
Iridium Technology – Profitability Best Practices | © 2022 Iridium Technology – now a part of BigHand 19
To understand Iridium’s thesis, let’s look at a couple simpl e profitability questions:
Question Traditional Answers
We collected $60,000 this month from Client X for Richard’s work. What was our profit for Client X on those collections?
• Option 1: That $60K represents 150 hours collected. Richard’s cost rate this month is $300/hour. Therefore, the costs should be $45K, and the profit is $15K.
• Option 2: Richard’s costs this month were $40K. The total collections this month were $120K. So, the $60K in collections should get half of this month’s costs. So, the costs are $20K, and therefore the profit is $40K
• Many other options are available, but they all have the same flaw that the work cost is based on Richard’s current cost rate.
Richard did $100K in Billable • Richard’s costs this month are $40K, so the profit is $60K. We understand that
Work this month. What is the profit on that work?
this is just an estimate, but it is the best we can do. Once we know the final collections we can tell you the profitability.
• But the problem is we will then use the traditional method above and the costs will be calculated based on Richard’s cost rate at the time of collections.
Iridium Best Practice Answer
• That work was performed 4-6 months ago. We will go back and get the cost of the work based on Richard’s costs in those prior months. We come up with an exact cost for the work performed of $25K, so the profit is $35K. That is the only correct way to determine profitability.
What was our profit on Richard in 2014?
• Option 1: We collected $800K, and his costs in the year were $380K, so the profit was $420K
• Option 2: Richard had $900K in billable/billed work, and his costs were $380K, so the profit is $520K.
• Again, there are many options but they all have the similar mismatch between costs and collections.
• We will not know the exact profit until we see how much is billed and how
much the client pays. But in the interim we can offer you four profit scenarios to analyze possible profitability outcomes: Super Optimistic, Optimistic, Pessimistic and Expected.
• We can do those traditional methods – no problem. We understand why you might want to use them for the annual review of your timekeepers and other scenarios.
• We also offer other scenarios which offer four choices for projecting/ estimating future profit. And we want to emphasize that these scenarios are especially applicable when looking at client or matter profitability.
Iridium Technology – Profitability Best Practices | © 2022 Iridium Technology – now a part of BigHand
20
The biggest problem with the traditional methods is the time shift between costs and revenue, and this is manifested in several unwelcome side effects:
If you look at a timekeeper’s profitability for the year based on collections, a large percentage of the collections may have incorrect costs since the costs are from this year’s work and a large percentage of the collections are from the previous year’s work
Departed timekeepers can overstate client or matter profitability, since the departed timekeeper may have zero costs in the period the revenue was collected (etc.)
Note that we classify all of these side effects as “time shift” issues.
So how does Iridium solve the time shift issues? The key element is being able to break down the collections to “super time slips” where we can read the work period. This works in both directions:
— If you are starting with the costs, for revenue we only bring in the collections that are associated with the work period that the work was done
If you are starting with the revenue (collections), we go back to the work period when the work was done to get the costs
Note, Iridium recommends to start with costs because it is possible to work easily with the revenue that is still in WIP/AR phase. This is not possible when you start with revenue (collections).
In conclusion, we urge clients to avoid the traditional methods, and if they are going to use them to be sure to be aware of the shortcomings.
Best
| © 2022
21
Iridium Technology – Profitability
Practices
Iridium Technology – now a part of BigHand
Profit Scenarios
Now that we have covered the basics and introduced our profitability thesis, let’s look at the options for profitability analysis which are supported in Iridium BI. Note that multiple scenarios are supported simultaneously – there is no need for the firm to make a choice of one scenario exclusively.
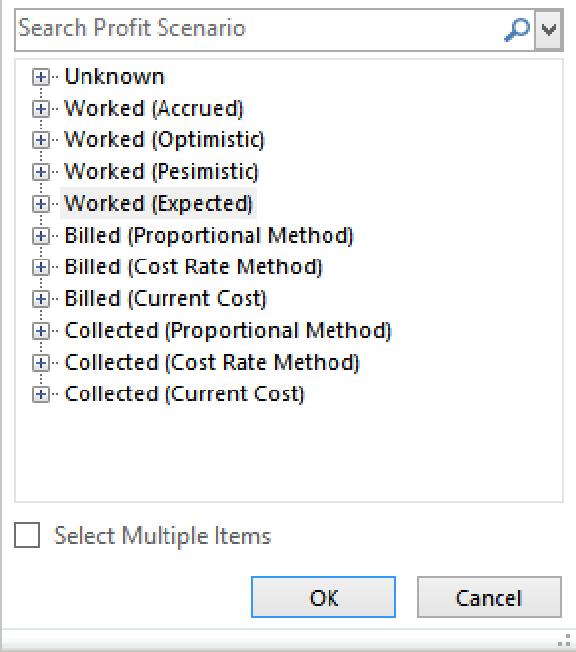
Iridium BI: Ten Profit Scenarios
Based on feedback from our clients and prospects, Iridium has implemented ten distinct scenarios that are available for profitability analysis. Again, the firm is not required to limit themselves to one scenario; all ten scenarios are available and the firm can choose in which situations each method is appropriate. One note of caution: while our product can support multiple scenarios simultaneously, we encourage firms to limit the number of scenarios in order to maximize cube performance and reduce processing time.
Work Period Basis (Recommended Scenarios)
With the Work Period basis scenarios, we look at a block of work that is constrained by a Work Period. For example: looking at the work Jennifer did for Client X in 2014, what is the profitability? We offer four scenarios: Accrued, Optimistic, Pessimistic, and Expected. Each scenario has a different revenue calculation, but in all scenarios the costs remain constant. These are our preferred scenarios for profitability analysis because it accurately ties the costs of the work exactly to the cash that is collected based on that work and also accurately projects future profitability.
Emphasis: The Work Period Basis is starting with the costs, and tying them to the future collections
–
Best Practices | © 2022
– now
22
Iridium Technology
Profitability
Iridium Technology
a part of BigHand
Profit Scenario Details
Worked (Accrued)
• This scenario simply assumes that the Revenue = Fees To Bill as they were accrued in the period.
• It ignores any write downs, write offs, WIP, AR. Alternatively it can be customized to include some of these.
• So in essence all billable work (Fees To Bill) performed is counted as collected revenue
• Comments: While this scenario is available and fully supported, we think that most people would agree that this is not a realistic outcome. We do not consider using the Super Optimistic scenario to be best practices, but some firms may want to use it for timekeeper profitability analysis.
Worked (Optimistic)
• We start by looking at the work in a Work Period, and assume all WIP and AR will be billed and collected. So, Revenue is equal to Fees Collected + WIP + AR on the work.
• This scenario assumes that no WIP or AR will be turned into additional writedowns or write-offs. Note there may be existing write-downs or write-offs
• Comments: While this scenario is available and fully supported, we think that most people would agree that this is not a realistic outcome. We do not consider using the Optimistic scenario to be best practices.
Worked (Pessimistic)
• Revenue is Fees Collected to date, and the matter has negative profitability until the costs are covered by incoming collections
• This scenario assumes that all WIP or AR will be turned into additional writedowns or write-offs. Note there may already be existing write-downs or writeoffs.
• Comments: This scenario is Iridium’s second choice, and for several of our clients it is their first choice. An advantage of this scenario is that it really puts pressure on the partners to make collections so that their profitability statistics will improve.
Worked (Expected)
• Revenue is Fees Collected + expected WIP + expected AR collections. The expected component is saying that there is WIP and AR associated with this work, and it is likely that we will bill/collect some of it.
• Our default implementation is to apply the historical billing and collection realization rates to the WIP and AR on a per-client basis
• Clients can define their own custom calculations for expected realization of the WIP and AR. (One possibility would be to consider the age of the WIP/AR as a factor in calculating the likelihood of eventual collections.)
• Comments: The Expected scenario certainly is the best scenario to use when reporting in profitability for matters where there is open WIP or AR. We recommend this scenario as best practices. This is a very powerful scenario for forecasting expected profit on work that has been done in the current year.
Important Note: At the point that there is no open WIP and AR left on a matter, then the three of the four scenarios (Optimistic, Pessimistic, and Expected) return the same profitability value. Since the Accrued method ignores Fees Write Down and Fees Write Off, it will only tie out with the other methods if there were no Fees Write Down and Fees Write Off.
Iridium Technology – Profitability Best Practices | © 2022 Iridium Technology – now a part of BigHand 23
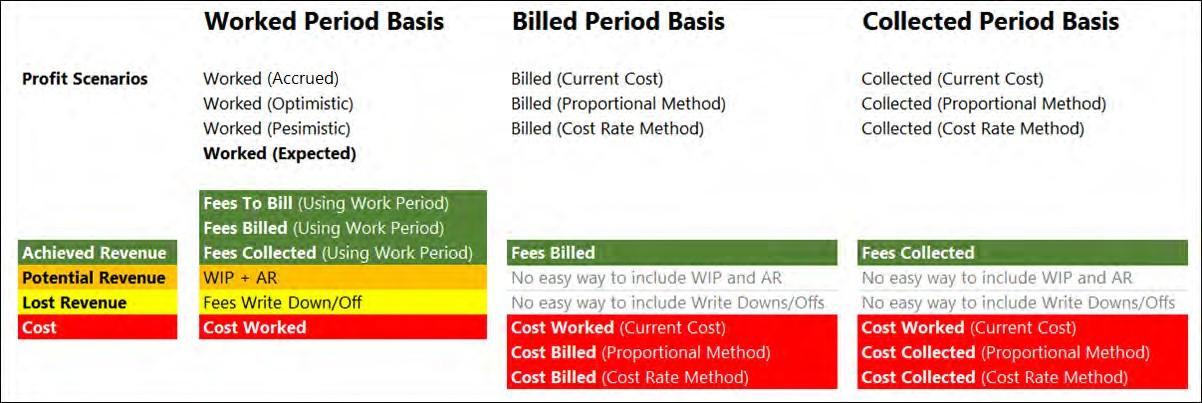
Let’s look at the types of revenue that is available in the Profit cube:
The Achieved Revenue component is what is considered as “in the bag”. It includes measures from all stages of the revenue pipeline: Billable Fees, Fees To Bill, Fees Billed, Fees Collected
The Lost Revenue is the Fees Write Down and Fees Write Off. The Potential Revenue is the WIP and AR. Eventually this will go to zero, having been converted to either Achieved Revenue or Lost Revenue.
Focus: The Impact of write-downs and write-offs (Profit Worked scenarios): The optimistic / pessimistic / expected profit value is based on collections, WIP, and AR. Write-downs and writeoffs are not directly included in the profit calculations, but they have the indirect impact of reducing collections, WIP, and AR and therefore reducing profitability. On the cost side of the equation, write-downs and write-offs do not reduce costs since the cost for the work is calculated at the time the work is done.
Profit Scenario Details
Collected/Billed (Proportional Method)
• We start by looking at the collections (bills), and then go back to locate the cost of the work associated with the collections (bills). Note that the costs are most likely spread across multiple prior periods.
• We identify the cost of the work associated with the collections (bills) by calculating the percentage of how much this collection (bill) is of the original fees (net of write-downs) and applying it to the total cost of that work in the work period. This allows us to get the proportional costs based on the collections.
• If (for example) 50% of the revenue has been collected, we then allocate 50% of the original costs of the work to this collection
• Let’s look at a matter with $500 in fees collected and $1,000 in original fees. We have collected 50% of the revenue in this period. The cost of the work in the original period was $800 for that matter therefore the collected equivalent will be $800 * 50% = $400. So, on the work collected so far, we have made a $100 profit – realized in this period.
Comments
• We are lukewarm on this scenario, and most clients do not use it.
• We still support it because there is some interest from the client base and prospects.
• We have several concerns with this scenario: (1) it is that it is not predicting an accurate outcome – the costs are already a sunk cost, so we dislike only reporting a portion of the costs. (2) AR and WIP do not have associated costs, so if there is open WIP and AR this can overstate profitability.
• Despite our concerns, we feel that this is a good scenario for answering the question “What was our profit on that $100K we just collected?”. We feel it makes sense only for profit on client/matters, but what about the profit on timekeepers and associated business units? We are effectively importing costs from previous years. We can accurately associate these costs with the matter, but which timekeeper/business unit gets to bear this historical cost in the current year? Keeping in mind the people who generated those costs may no longer be with the firm.
• We prefer our Worked Period basis scenarios which takes the revenue back in the work period and matches it up with costs from those periods.
Iridium Technology – Profitability Best Practices | © 2022 Iridium Technology – now a part of BigHand
24
Collected/Billed (Cost Rate Method)
• In essence, this method is similar to the previous proportional method. It is also trying to calculate a portion of the original cost relative to the collections (bills)
• For this scenario, we first determine the Hours Collected (Billed), and then multiply the hours by the estimated average timekeeper Cost Rate in the recent periods to come up with costs
• We support this scenario primarily for legacy reasons for some of our long-time clients
• Comments: Our concern with this scenario is that the cost rate in the current period can be widely divergent from the cost rate at the time the work was done (hence the use of the word “estimated average”). Many clients using this method will move to YTD or R12 analysis to smooth out the cost rates, but we view this as a Band-Aid instead of an accurate solution.
• Another shortcoming with this scenario is that for AFA or Contingency matters the Hours Collected (Billed) may not be accurate (or may not even exist), and this results in inaccurate costs. Some compensation technique must be used e.g. using Hours Relieved.
• This is our least favorite scenario, and we disable it for most clients. Additionally, it is the scenario with the longest cube processing time and slowest queries.
Collected/Billed (Current Cost)
• This scenario is simply looking at the raw data in the period. For example, what were Jennifer’s collections and costs in 2014?
• The user needs to be aware that there is a mismatch between revenue and costs (time shift)
• Many firms use this for ranking timekeepers (etc.) for profit contribution during the year, even though they are aware that there is a time-shift issue
Collected (Billed) Period Basis (Alternate Scenarios)
This scenario starts with the revenue (Fees Billed/Collected) in a period, and then provides three scenarios for determining the cost component. Note that six scenarios are presented below but combined into three items since the corresponding Collected and Billed scenarios are very similar.
Notes:
For all three scenarios, the collections (bills) are identical; collections are equal to raw Fees Collected (Billed) in the period
WIP and AR are not included in the calculations, so there are no costs associated with the WIP and AR. This overstates the profitability of matters with open WIP and AR.
Fees Write Down and Fees Write Off are indirectly reflected in the calculations
— The big difference between the three scenarios is that each scenario has a different cost calculation
Iridium Technology – Profitability Best Practices | © 2022 Iridium Technology – now a part of BigHand 25
BEST PRACTICES
— When selecting revenue scenarios, the best practice is to “use the scenario that your firm likes and has configured, but be aware of the pros and cons of that scenario”. Additionally, your firm could use different scenarios for different profitability reporting and analysis scenarios.
Iridium has a strong preference for the “Work Period Basis” scenarios, since these are the only scenarios that tie the costs to the collections and also cater for WIP and AR. In order of preference:
o Worked (Expected)
o Worked (Pessimistic)
o Worked (Optimistic)
When using the Worked - Expected scenario, we encourage clients to modify the calculations for the realization factors. In general, we think that this should be based on the realization rates for each client rather than firm-wide or department-wide histories.
When looking at profitability on collections, we recommend the Collected (Proportional Method) scenario
When looking at profitability on bills, we recommend the Billed (Proportional Method) scenario
26
Iridium Technology – Profitability Best Practices | © 2022 Iridium Technology – now a part of BigHand
Flexible Profitability Analysis
Iridium understands that clients have different reporting scenarios, and we would never insist that clients use a single set of profit numbers for all analysis situations. Iridium BI has several features and capabilities that allow firms to modify the costs, revenue, and hours to be included based on their profitability analysis requirements.
Note that we have already covered your firm choices for multiple revenue scenarios in the section above. This section covers scenarios in general, and some available options for costs and hours.
Profit Scenarios
Profit Scenarios allow firms to see multiple views of their profitability data and to switch between those views. If we look at the Profit Scenarios discussed in the previous section, the firm might elect to implement (for example) three of the ten scenarios. These scenarios would then be available in the Profit Scenario dimension. Within Iridium BI, we create scenarios that combine different views of costs and revenue. Firms that elect to implement the Cost Rate method can also choose the hours to be used in different Cost Rate scenarios. This is an example of the scenarios that might be implemented at a client:
Filtering Costs
The filtering capabilities of Excel can be used to build custom filtering into your pivot tables (and into our dashboards). An example might be that you want two views on profitability: one that includes partner bonuses and one that excludes partner bonuses. You can easily accomplish this by including/excluding the Profit Account for “PARTNER-BONUS” in your analysis.
Iridium
–
Best Practices | © 2022
– now
27
Technology
Profitability
Iridium Technology
a part of BigHand
Estimated Cost Rate
Estimated cost rates can be used to apply costs to matters. This only applies to the Collected (Cost Rate Method) and Billed (Cost Rate Method) profit scenarios. In the Cost Rate method, you can choose which type of cost rate you want to use for calculating collected (billed) cos ts. Multiple cost rate data sets allow firms to perform reporting and analysis using multiple sources for hours such as “Monthly”, “Annual”, or “R12”. There are dimensions “Cost Rate Type” and “Cost Rate Period” that can be used to switch the cost rate calculation when using the Cost Rate method.
Additionally, firms have the option of defining additional estimated cost rate data sets.
Estimated Realization
This only applies to the Worked (Expected) profit scenario. In this profit scenario, you can choose which type of realization you want to use for calculating potential revenue from WIP and AR. Multiple realization data sets allow firms to perform reporting and analysis using multiple sources for data set such as “Monthly”, “Annual”, or “R12”.
Additionally, firms have the option of defining additional estimated realization data sets.
Iridium Technology – Profitability Best Practices | © 2022 Iridium Technology – now a part of BigHand 28
Best Practices Topics
As the number of implementations of Iridium BI grows, our knowledge of best practices implementations also grows. Clients regularly ask our advice on best practices. This section covers the most common topics for discussion. For each topic, we summarize the issue, discuss the options, and identify our preferred solution.
Should your Profit Cube Reconcile to your Income Statement?
If your Income Statement shows $100.3M in revenue and $60.3M in costs for a profit of $40.0M, should you see the same numbers in your profit cube? This is a key question which impacts many or most of your profit implementation decisions. Let’s look at the pros and cons of each strategy…
Strategy Details
Reconcile to GL: Pros • There is only really one benefit: you can show the partners that your profit cube reconciles to the same firm-wide profit number as the GL produces
Reconcile to GL: Cons • You will be required to load ALL costs into the Profit cube – you cannot exclude costs that might not apply to profitability analysis
• If you allocate costs between office, departments, or teams then the GL and the cube will not reconcile by those slices
• Specifically: if you allocate any journal entries to a timekeeper in different Office + Department + Team versus what are stamped on the transaction then your “reconciliation to the GL” has been broken
• Since almost all firms will do at least a couple firm-wide allocations, it is not a valid goal to say that your profit cube will tie to the GL at slices such as Office, Department, Office + Department, etc.
• You cannot take advantage of strategies such as negative (contra) costs and cost smoothing because then your revenue and costs will not tie to the GL
• In summary, you are placing restrictions on your ability to choose appropriate costs and allocate costs across entities
Iridium Technology – Profitability Best Practices | © 2022 Iridium Technology – now a part of BigHand 29
Do Not Reconcile to GL: Pros
• No limits on allocating or moving costs (or revenue) between offices, departments, teams, etc.
• No limits on strategies like negative (contra) costs, one-time reassignment of costs, putting in a plug for Partner Draws, etc.
Do Not Reconcile to GL: Cons • None really. You just need to be able to explain the strategies and differences to the firm partners
BEST PRACTICES:
First of all, if the firm policy is that the profitability cube must tie to the GL, then of course you will do it
In our opinion, reconciling with the GL-based income statement is overrated, because you are limiting your implementation choices. For example: many firms decide to reallocate non-timekeeper revenue as a negative (contra) cost, resulting in differences versus the GL in both costs and revenue. If you have set the goal of reconciling with the income statement, then this option is not available to you.
Do not set expectation of reconciliation. If someone questions this decision, then your response is that “We already have financial reports – the profit cube is optimized for profitability reporting and analysis”.
Important: Only Collected/Billed (Current Cost) scenarios will tie to cash basis (annual) financial reports under certain conditions. The other profit scenarios will almost never tie to the GL.
Cost Smoothing – Timekeeper Level
Smoothing at the timekeeper level can be used to evenly distribute costs across multiple periods. This allows you to avoid the situation where (for example) a partner gets a $200K bonus in June and then all work in June has higher costs and looks less profitable.
The only problem with cost smoothing across periods is that we will not be able to reconcile the cost with GL on a period by period basis for those Profit Accounts where smoothing was applied. You will only be able to reconcile on a period range basis – typically a financial year.
Typically, the smoothing takes the whole cost in the year in the unit that we are applying the smoothing to (e.g. timekeeper or office) and re-distributes the cost to periods either equally or using some weight e.g. hours worked or revenue generated in each period.
Smoothing the cost at the timekeeper level has a positive impact on the cost smoothing applied at the matter level which is discussed in the next section.
Iridium Technology – Profitability Best Practices | © 2022 Iridium Technology – now a part of BigHand 30
BEST PRACTICES
We recommend smoothing only some costs – especially for making sure that large costs like partner bonuses are spread across all months
Note that if costs are smoothed, then the profit cube costs in each month will no longer reconcile to the GL costs in each month
— If you do not smooth, then the costs will tie to the GL but you will see large variations in monthly cost rates
Note that since the smoothing is done before the cube is processed, you cannot switch between smoothed and original costs while working with the cube.
Cost Smoothing – Matter Level
After all the costs are allocated to all timekeepers, the Profit engine allocates the timekeeper costs to all his/her matters in the period based on the hours worked on each matter in that period and average cost rate for that timekeeper. Most clients choose to use cost rates based on the rolling 12 periods average. By using this R12 average cost rate we naturally smooth the cost allocated to matters in each period. This obviously leads to situation where total allocated cost to all matters in each period is higher or lower that the cost of the timekeeper in the same period. The Profit engine injects correction records associated with PLACEHOLDER matter to force it back to the original timekeeper total cost. Essentially, this protects each matter to be penalized for high timekeeper cost in some period.
The cost smoothing at the timekeeper level, as described in the previous section, would lead to smaller variations of the timekeeper’s cost rate period by period thus lowering the amount that is allocated to PLACEHOLDER matter. The PLACEHOLDER matter is designed to take the hit rather than the actual matters without interfering in any way with the timekeeper and organization unit’s profitability.
BEST PRACTICES
The cost rate based on the rolling 12 periods average is recommended for matter cost allocation. This cost rate can be changed in configuration variable “ProfitMatterAllocationCostRateTypeId”. The options for the cost rate are: MTD, YTD, R12, LTD, YEAR, Standard Hours R12, Adjusted Hours R12 etc.
Note, if you select MTD cost rate no smoothing will occur and no amount will be allocated to the PLACEHOLDER method
Note, Adjusted Hours R12 would use standard hours in periods where actual worked hours were lower than the standard hours. This is a popular option that guarantees the cost rate used is relatively smooth and does not jump up and own too much.
Iridium Technology –
Best Practices | © 2022
– now
31
Profitability
Iridium Technology
a part of BigHand
The PLACEHOLDER matter allocated amount should be kept low (5% or less) through tuning the whole profit calculation model. There is a possibility to implement cube calculations that soft-allocates this amount to other matters if necessary.
Calculating Cost Rates based on Alternate Hours
Many firms would like to have the capability to calculate cost rates based on an alternate hours value instead of using the actual hours. The most common scenario is to define a minimum hours “floor” so that timekeepers with low hours are not getting unreasonably high cost rates: “for any timekeepers with under 1200 hours in the year, calculate their cost rates as if they had worked 1200 hours”. Another variation is to calculate cost rates based on standard hours.
Iridium BI fully supports the creation of additional scenarios based on alternate hours. Additionally, multiple scenarios are supported simultaneously, so you can compare the results of the scenarios side-by-side. Another scenario where adjusted hours are sometimes used is for new hires. Since they need to “get up to speed”, the firm may give them (for example) 50 hours of credit during their first two months. Please note these alternate scenarios are only effective in the Cost Rate based methods.
Part-Time Timekeepers
Most firms want to avoid having part-time timekeepers get more than their share of the cost allocations. Iridium offers multiple options to accomplis h this, with the most common being that allocations are FTE-adjusted. For example, a 2-day per week employee would only receive 40% of the allocation of a full-time employee.
For timekeepers with very low hours, many firms choose to just treat them as non-timekeepers, and allocate away both their revenue and cost.
Some firms are already calculating a second “cost FTE” value specifically to determine cost allocations, and we can load these into the profit module while still preserving the standard FTE values. In theory, this translates to an allocation factor except we support more than one.
BEST PRACTICES
Modify their Allocation Factor to reflect their part-time status, and they will receive a prorated (smaller) allocation of costs.
Design your allocation methods to make sure that part-time employees are getting fulltime cost assignments where appropriate. For example, if you firm thinks that a part-time employee uses the same HR cost as a full-time employee, then the allocation method for HR costs can be headcount-based instead of FTE adjusted.
32
Iridium Technology – Profitability Best Practices | © 2022 Iridium Technology – now a part of BigHand
Calculating Profitability based on Standard or Adjusted Hours
As mentioned above we can use various cost rates when we allocate cost from timekeepers to matters. The hours of choice will be used to calculate timekeeper’s cost rate and multiplied with the actual hours worked on the matter. This will lead to the amount allocated to PLACEHOLDER matter in order to protect the actual matters from getting penalized.
Timekeepers with High Costs (and Low Revenue/Hours)
Certain timekeepers will always have low revenue/hours, and the best example is probably rainmakers. Making it worse, in many cases the rainmaker is a highly-compensated individual (cost is high). Iridium BI offers three strategies for properly costing timekeepers with low hours:
Strategy Details
Cost Exceptions
• This feature allows firms to increase profitability of timekeepers by reducing their costs
• Typically, this scenario is used to decrease costs for timekeepers with low revenue/hours, but it could also be used to decrease/increase costs for any timekeeper
• There are two methods to adjust the costs: rules and manual adjustments. Here are samples of each:
o Rule: Decrease costs by $400,000 for all partners with more than $1 million in originations during the fiscal year
o Manual adjustment: Decrease Jennifer’s costs by $50K in 2014, and decrease Joseph’s by $80K
• The cost exceptions are all associated with two firm-defined Profit Accounts, for example for origination credit they might be “CREDIT-ORIG” and “ALLOC-CREDITORIG”. In the example above with Jennifer, she would receive a -$50K cost CREDIT, and the +$50K “debit” would be pushed (allocated) out to other timekeepers (the firm determines the rule).
• Once the cost exceptions are loaded into the cube, the firm can include/suppress them in profitability calculations by including/suppressing the associated profit account in queries and reports
Reduce Allocation Points
• Assign the rainmakers or other timekeepers with low revenue/hours a lower value for allocations points, which will reduce their share of the costs
• Example: As a partner, William should get 3 points for allocations. However, we are changing William and two other rainmakers to only receive 1 points, therefore cutting their costs down to 33% of the normal amount for partners.
• One shortcoming of this method is that it does not reduce the direct costs, which in many cases may be the biggest costs.
Iridium Technology – Profitability Best Practices | © 2022 Iridium Technology – now a part of BigHand 33
BEST PRACTICES
We have seen both of these methods in use at our clients. Our preference is for the Cost Exception strategy.
Split Assignments
Split assignments are the situation when you have a timekeeper that is assigned to two departments, offices, teams, or titles. For example, James is a partner, and he is split between the San Francisco and Palo Alto offices on a 60/40% ratio at the same time (in the same period).
Iridium BI does natively support split assignments.
Non-Timekeeper Revenue
Most law firms have situations where a non-timekeeper may occasionally bill some time. Typically, non- timekeeper (“NTK”) revenue is only going to be 1-2 percent of total firm revenue, but you still need to have a strategy to account for it in your profitability analysis. It is always associated with a special profit account called Revenue Fees NTK. Here are several strategies for handling NTK revenue:
Strategy Details
Allocate to other TKs
• Pro: Total Revenue will tie to the GL
• Con: Revenue for individual timekeepers will be overstated
• Con: It is very complex and sometimes impossible to find TKs that should receive the revenue while keeping the revenue on the same matter
Allocate to other TKs as negative cost
Assign to “PLACEHOLDER” timekeeper
• Pro: Total Revenue for individual timekeepers will be correct. Costs for timekeepers will be reduced, but in a subtle way
• Con: Total Revenue will not tie to the GL
• Con: It is very complex and sometimes impossible to find TKs that should receive the revenue while keeping the revenue on the same matter
• Pro: Individual timekeeper revenue and costs are not changed
• Pro: this is simple and straight forward. This is also the default out of the box strategy
• Con: You will have the “PLACEHOLDER” timekeeper in all your reports
Treat the non-timekeepers as timekeepers (not recommended)
Suppress It
• This means that the non-timekeepers will be tracked as timekeepers in your reports and the cube
• Pro: You see the actual hours and collections of the non-timekeepers
• Con: Your cube and reports will include distracting/non-essential employees
• Do not load the revenue for non-timekeepers
• Pro: non-timekeepers do not show up on your reports
• Cons: You cannot tie out revenue by total firm, client, matter, etc.
Iridium Technology – Profitability Best Practices | © 2022 Iridium Technology – now a part of BigHand 34
BEST PRACTICES
These are the two best practices options that we like, listed in order of preference
(1) Assign to “PLACEHOLDER” timekeeper
(2) Assign it to other timekeepers
Departed Timekeepers
How should we treat revenue and costs for timekeepers that have YTD values but are no longer with the firm? Departed timekeepers are a recurring source of data discrepancies since they are still getting collections credit, and sometimes they also have costs. There are two basic options:
“The Reality Option”: If the timekeeper was there for part of the year, then they should be left in the profit cube and the revenue and costs will stay with the timekeeper. They will receive cost allocations for the periods where they were active at the firm. After they leave the firm they will no longer have an FTE or assignment, so any future data will be handled as a non-timekeeper. Specifically, any future collections or direct costs that are loaded will be assigned to the PLACEHOLDER timekeeper. There are several advantages to this option: (1) it reflects what actually happened, (2) there is no re-writing of history; i.e. reports that were distributed before the timekeeper left are still valid, and (3) any future data loaded for collections or costs will be handled using the same methodology that is used for other nontimekeepers.
“The Disappearing Act Option”: When the timekeeper leaves the firm the FTE and assignment records in the YTD prior periods are overwritten, so it appears that that the timekeeper was not at the firm this year. All of their revenue is treated as non-timekeeper revenue and reallocated by whatever rule was set up for NTK revenue. All of their costs are pushed to other timekeepers based on the cost allocation rules that your firm has configured. This method is not recommended, since it is taking you further from the truth of what really happened.
BEST PRACTICES
We recommend the Reality Option.
Partner Compensation/Draws
Partner compensation and draws are major items on the profit income statement. They look like costs similar to salary and bonus, but we believe the partner compensation is not a true cost. However, we also recognize the importance to see the impact partner compensation and draws have on the profit income statement. The key is having the flexibility to include or exclude the partner compensation in your firm’s profitability analysis in a way that fits the need of your firm.
Iridium Technology –
Best Practices | © 2022
– now
35
Profitability
Iridium Technology
a part of BigHand
One idea is “notional” salary for the partners, which breaks partner compensation into a “salary” and “distribution” component. The salary component represents the cost of having a salaried lawyer perform the equivalent work while the distribution component represents the premium that an owner receives for accepting some of the gain/loss risk of the firm. We set up separate profit accounts for each of these components to allow them to be treated separately in reporting and analysis. As an example, a partner with $700K in income might be set up with a notional salary of $400K and an expected distribution of $300K. It is up to the firm to decide the rules for notional salary values, or create a table of notional salary values for each partner.
The advantage of the notional salary is that it is a direct cost value for partners – a value that is “reasonable” and can be used for client/matter profitability analysis. On the other hand, the partner “profit” distribution is not a true cost; it is a distributed profit that is allocated to partners. Therefore, we can treat the distribution separately as an optional line item. When you want to analyze partner profitability and include the partner distributions, you simply include the distribution component in your analysis. Otherwise it can be suppressed.
The most common downside to a notional salary approach is that the formula for determining notional salary can be hard to defend and may seem arbitrary to partners. It opens up the model to dispute and case-by-case revision, especially for a profit scenario used in compensation.
BEST PRACTICES
— We recommend setting up notional salaries.
Structure the profit accounts to ensure that you can include or exclude the partner distribution in your profitability analysis based on your needs.
— To avoid case-by-case disputes where profitability is highly visible to partners, keep the rules for assigning notional salary as simple and as even as possible across positions, practice areas, etc.
Whether you set up notional salaries or not, most firms choose to load in a single “plug” value for expected partner compensation during the fiscal year. The plug value is independent of the draw amount – it is the best estimate of the total partner compensation for the year. This provides stable/fair profit analysis during the financial year. Once the financial year is completed, the actual compensation values for each partner are backloaded. This can either be the same value for all partners, or individual values can be entered for partners (more likely and more accurate).
— Alternative #1: the firm can load in the partner draws throughout the year with the actual draw amounts. An additional plug is then entered that contains the difference between the draw amount and the expected total partner compensation for the year. Once again, load the final partner compensation values when they are available. Note: We strongly recommend smoothing Partner Compensation across all YTD periods, otherwise fair analysis cannot be performed on clients/matters that had time worked in the periods where the draws or other partner payments occurred.
Iridium
© 2022
36
Technology – Profitability Best Practices |
Iridium Technology – now a part of BigHand
Alternative #2: the firm can load the notional salary for each partner in each period and only at the end of the year calculate the partner distribution as a variance between the total profit distributions and the notional salary already credited to each partner. This method is similar to the idea of the plug described above, except it does not need to be removed at the end of the year. This method would work best if the notional salary would be always lower than the total distributions. This method can also be seen as a cost smoothing attempt that brings nice stability to the timekeeper and client/matter profitability analysis.
Profitability Information Access
This is a very important topic: who in the firm will be able to view profitability reports and data, and what will they be able to see? There are three common strategies (and one uncommon one!):
Strategy Details
“Tightly Held”
• Access to the profitability data is limited to a small group of 3-5 people in the firm, typically only finance staff and the Managing Director
• This group reviews the profitability data, and when they notice a situation that requires action they have a “quiet talk” with the appropriate manager or timekeeper
• Typically, there is limited or no distribution of any profitability reports
“Managers”
• In addition to the Tightly Held group, the Department Heads or other managers are given access to profitability data
• Client/Matter Responsible Partners can have access to profitability on their clients/matters
• With this strategy, it is typical that the users get access to profitability data either through dashboards or reports
“All Partners”
• In addition to the access detailed above, all partners are given access to their own slice of the profitability data
• Partners are given reports or dashboards so that they can see their personal contribution to firm profitability, and their performance on their individual clients and matters
• They can also see their performance as an Originating or Client/Matter Responsible Partner
• Additionally, they can view the profit contribution of the timekeepers that have worked on their matters
“Wild West” (Uncommon)
BEST PRACTICES
• All Partners can see the profitability data for the entire firm, including the profitability contribution of the other (named) partners
• We have not seen this with any of our clients, but we did demo for one firm that used this strategy
This is highly dependent on your firm culture, so the only best practices advice is to distribute the profitability results as widely as allowed by your firm culture, and continue to see if you can distribute them further each year.
Iridium Technology – Profitability Best Practices | © 2022 Iridium Technology – now a part of BigHand 37
Profitability Dashboard Access
Quick follow-up topic: Iridium offers role-based Profit module dashboards for Executive (Total Firm), Office Manager, Department Head, Team Leader and Participating Attorney (Originations, etc.). If your firm will be deploying dashboards, you will need to determine which roles you will be rolling out.
Sample dashboards are listed in Appendix 1.
Important note: Many of our clients do not deploy profitability dashboards. They have a set of static (PDF format) reports that they distribute on a monthly basis and that covers their profitability reporting and analysis requirements. It is more likely to see dashboards deployed for firms that are giving access to all partners.
38
Iridium Technology – Profitability Best Practices | © 2022 Iridium Technology – now a part of BigHand
Special Topics
Bring us Your Toughest Customizations!
At Iridium, we strongly believe that each law firm is unique, and we need to cater to your special requirements. In the discussion above, did we miss anything? If so, here is your opportunity to capture and document any special requirements for your firm. Please think about these questions as you plan your implementation, and bring any special requests to us for discussion.
Note that in the history of the firm Iridium has delivered 2000+ customizations for our clients, and we have never once been unable to deliver on a customization request.
Question Sample Answers / Comments Firm Answer
Is there anything unique about… your firm’s profitability reporting requirements?
• Yes – because we handle 500,000+ small matters each year we might have performance issues for client/matter analysis
• Yes – we define some ranks as timekeepers for some costs but not for others
• Yes – our last vendor told us that we made everything “insanely complicated”
•
• Is there anything unique about… your firm’s profitability allocation methods?
Is there anything unique about… your firm’s profitability reporting requirements?
•
• Yes – we have a set of profitability reports that we have been using for the last 10 years. We are going to need to reproduce matching reports off your solution.
• (Please add rows to this table if necessary)
Handling Exceptions
Exceptions are a special case of customizations, typically focused around a couple timekeepers or clients. Think of it this way: a customization example is “combine paralegals with law clerks for profitability reporting”. An exception would be “combine paralegals with law clerks for reporting, except for James and Susan who need to be handled differently”. While we encourage clients to limit exceptions, we also acknowledge that there are valid business reasons that justify some exceptions.
BEST PRACTICES:
There should be no limits on exception handling
–
Best
| © 2022
39
Iridium Technology
Profitability
Practices
Iridium Technology – now a part of BigHand
We prefer data driven solutions – i.e. avoiding hard codes. In the example above, we would not hard-code “except for James and Susan” into your implementation. Instead we would set up a table to track special paralegals, and the firm can then change who is assigned to the exception with no intervention or code change from Iridium
Loading Data from External Data Sources
Every Iridium Profit module implementation is already loading data from the payroll application, so we are comfortable with bringing in external data from other systems. We consider the task of bringing in external data to be part of a standard implementation. For example, with our Revenue module most clients bring in at least one external data source.
Common external data sources:
—
Spreadsheets or custom tables for FTEs (Revenue/Profit)
Custom tables in the ADERANT/Elite databases with custom client attributes (Revenue/Profit)
Spreadsheets or custom tables with target/budget figures (Revenue/Profit)
Spreadsheets of custom tables with profit costs or setup data (etc.)
BEST PRACTICES:
There should be no limits on extending the solution and loading external data. Period.
Ad-Hoc Analysis (Power Users)
Can you have a BI/dashboard solution without cubes? Absolutely. But if you don’t have cubes, you are going to miss out on a major BI deliverable: empowering your financial analysts to perform ad hoc analyses. Once your financial analysts have access to a robust cube and their trusty copy of Microsoft Excel, they will never go back to writing T-SQL queries against the practice management system database results are available in seconds, instead of minutes or hours. The predominant power user tool is Microsoft Excel using PivotTables. Why is ad-hoc capability so important for financial analysts and power users?
There will never be a set of dashboards that answer all user questions, especially the complex / infrequent questions. This means that a separate tool is required for handling those questions.
Your financial analysts need to be able to self-serve and respond to queries quickly The financial analysts should not need to code in T -SQL or get a technical resource involved to respond to queries
Having the cubes encourages your power users to “just fool around with the data” to see what they notice
a part of BigHand
Iridium
–
Best Practices | © 2022
– now
40
Technology
Profitability
Iridium Technology
BEST PRACTICES:
Your solution must have cubes for ad-hoc capabilities
Cube data storage is optimized for querying and reporting, and this enables fast queries and dashboards
Firm to determine ad-hoc access policies – typically limited to 1-5 power users in the finance department
— Microsoft Excel is the preferred query tool, and Excel 2017 Professional 64-bit is strongly recommended
Multi-Currency Support
The multi-currency (“M/C”) support within the Iridium BI Profit module is as follows:
We support two currencies side by side for both revenue and cost:
o System currency
o Office currency (this is only available when sliced by office and no firm totals are possible)
The revenue is converted to office currency accurately the same way it is implemented in the Revenue cube (For Expert clients this is based on DRUNO)
The cost is loaded from GL in system and office currency
— All allocations are carefully handling the office currency as accurately as possible. This means that sometimes the average monthly exchange rate must be used. This is calculated from existing revenue records.
Firms can load payroll costs in foreign currencies, and that data is converted to the system and office currencies as accurately as possible.
— Since the Profit module is storing data at the period granularity, foreign currency data is converted based on monthly average exchange rates
The “PLACEHOLDER” Concept
There are two places where the “PLACEHOLDER” concept is used in Profit module:
NTK revenue – if there is non-timekeeper revenue, we can map that revenue from multiple non- timekeepers to a single PLACEHOLDER timekeeper
Matter protection – if there is variance for single timek eeper in a single period between total of all matter costs and the timekeeper allocated cost the PLACEHOLDER matter is used to hold the variance
Iridium Technology –
Best Practices | © 2022
– now
41
Profitability
Iridium Technology
a part of BigHand
Multiple Profitability Scenarios (Part 2)
We have covered the flexible options available within Iridium BI above, but this is an important topic so we want to go a little deeper on this. The key points: We are not forcing a single profitability methodology on our clients We expect each client to have different allocation and reporting requirements
— Our product is designed to enable our clients to use different scenarios for different situations
As an example, a firm might want to have three different methods for reporting on three different entities:
Timekeepers: We want to review profitability on a monthly basis throughout the year. We think that it is fair to evaluate profitability using the last rolling 12 periods, and use the “Worked Period (Optimistic)” method since we don’t penalize timekeepers for write-downs and write-offs.
Partners: We want them to focus on their annual Fees Collected goal. We are going to always report using YTD basis, and use the “Worked Period (Pessimistic)” method to encourage them to collect fees quickly.
Clients/Matters: We want to take a longer-term view, so we will review profitability in the current fiscal year YTD combined with the full year results from the prior fiscal year. We will use the (“Worked Period (Expected)” method, since that allows us to project future profitability.
BEST PRACTICES:
— We encourage firms to use multiple scenarios for different entities Firms may want to educate the report recipients on the differences between the scenarios, and why each scenario was chosen for the different entities
Participating Attorney Slicing
This is a really cool feature. Within Expert or Elite, you have the ability to track “participation credits” by attorney. A typical example is Origination credits: Jason and Suzanne worked together to sign up a new client. Jason received 40% credit, and Suzanne received 60%. This is fully supported in our Revenue module. For example, if the firm collected $1 million in fees from that client in 2014 then Jason would receive credit for $400K and Suzanne would receive credit for $600K. We also allow firms to bring in the participation credits for multiple types that are defined in their PMS, such as Client Origination, Matter Origination, Client Managing, etc.
Iridium Technology – Profitability Best Practices | © 2022 Iridium Technology – now a
42
part of BigHand
So, in the example above, let’s say that there was $500K in profit on the $1 million in collections. We can then say that Jason’s profitability credit based on originations is $200K, and Suzanne’s is $300K.
A nice variation on this is that Suzanne had Origination credits on 10 clients last year, with the participation percent ranging from 10% to 100%. We can apply those percentages to the profit on each client, and then say that Suzanne’s client origination contribution last year resulted in $1.0 million in profit for the firm. Another interesting slice is to say that both James and Suzanne had separate originations that resulted in $1.0 million in Fees Collected. But Suzanne’s originations resulted in $300K in profit, while James’ only resulted in $150K. So, while they both had the same total originations, Suzanne’s originations were more profitable for the firm, and she is probably deserving of a larger bonus than James.
This feature is fully supported in both the Revenue and Profit modules, and available through the dashboards and ad-hoc analysis (power users).
GL Transactions for Timekeepers
Your firm may create journal entries for some overhead costs which are stamped with the ID of the Working Attorney (“WA”). Even though these overhead costs are flagged for allocation based on the firm-defined rules, the firm has the option of leaving these costs with the WA that is stamped on the GL journal entry.
Let’s look at an example: the firm has a group of GL accounts for training costs, and they have been combined into a Profit Account for “TRAINING”. The majority of the journal entries are for training costs that are applicable to the total firm, a single office, etc. But there are some journal entries for TRAINING that are specific to a single timekeeper – let’s say that an attorney was sent to a week of negotiation training in Miami at a cost of $4000. This training cost can be applied to that timekeeper in the profit processing, and all other training costs will be allocated to the offices, firmwide, etc.
Here are the available options, using our TRAINING example above:
—
Ignore the WA on the journal entry, treat all TRAINING costs as overhead
Create a new Profit Account for TRAINING-DIRECT, and assign all WA GL transactions as direct cost
Assign the WA GL transactions to TRAINING, rolling the cost up with the additional costs that will come from the allocations
BEST PRACTICES:
All options are supported, and the firm should choose based on its preferences.
Iridium Technology – Profitability Best Practices | © 2022 Iridium Technology – now a part of BigHand
43
Handling Inter-Office Cost Transfers
Inter-office cost transfers are used to push costs from one office to another within the GL. As an example, the headquarters office might house the entire IT department, which costs $2 million per year. The other offices rely on the headquarters for IT support, so the firm pushes $250K in IT cost to the other offices using journal entries. We support three scenarios for inter-office transfers in the Iridium BI profit module:
— Doing it, and don’t want to stop: You are already doing inter-office transfers in the GL, and you want to continue. In this case the profit module will just consider those costs to be in the receiving offices, and then will allocate them normally to timekeepers based on the firm-defined rules.
Doing it, but want to stop: You are doing inter-office transfers in the GL, but you want to stop. Many firms want to stop the transfers in the GL, and want the profit module to take over this processing. We strongly encourage moving the allocations to the profit module: there is less work for finance staff since it will be part of the automatic monthly processing, and the allocations can be more accurate since the profit module can allocate based on 3-21 points, billable dollars, etc.
Not doing it, and don’t want to do it in the GL: You are not doing inter-office transfers in the GL, but you want to push the costs to other offices. The profit module will automate this task, and again offers numerous allocation methods to tailor the inter-office cost transfers based on your firm’s requirements.
Iridium Technology – Profitability Best Practices | © 2022 Iridium Technology – now a part of BigHand 44
Appendix 1: Iridium BI Profit Dashboards
A complete set of Profit dashboards is included with the Profit module. In the current release, the following dashboards/reports are included:
Overview PROFM (“Profit Manager”) home page
Unit Page (Data filtered accordingly based on Office, Department, Team, Attorney, Client, or Matter)
Office Comparison
— Department Comparison
Team Comparison
—
Working Attorney (Timekeeper) Comparison
Matter Billing Attorney Comparison
—
Matter Responsible Attorney Comparison
Matter Managing Attorney Comparison
Client Responsible Attorney Comparison
Originating Attorney Comparison
Client Comparison
Parent Client Comparison
Matter Comparison
Our dashboards are fast – our target is 2 second screen refresh at most client sites (highly dependent on client server specification!) We are able to accomplish this by (1) building the dashboards on our highly-optimized cubes, and (2) utilizing efficient development tools and languages such as HTML5 and AngularJS, and (3) a bunch of super-cool developers with endless enthusiasm for developing useful features. The other big advantage of developing our own dashboard technology is that we have unlimited flexibility to create our own proprietary graphical data representations.
A fairly complete set of the dashboard screenshots is available as in later sections in the document. We say “fairly complete” because there is so much content that it would just make this document too long to include it all. So, we have included enough to give you a feel for the overall dashboard offering.
You may notice that the “user guide” part of this section for the dashboards was pretty short. That is because the dashboards are very intuitive – we just needed to show you a couple tricks to get you started.
Iridium Technology – Profitability Best Practices | © 2022 Iridium Technology – now a part of BigHand 45
Once Iridium BI dashboards are installed, we strongly encourage users to “just connect to the dashboards and fool around”. This is a 100% read-only environment, so the users don’t have to worry that they are going modify any source system data or break anything.
Home Page
The Home Page lists all roles for the user. A Power User or Manager might have five or more roles, and require scrolling to see all of their roles. An Associate would most likely only have a single role (Working Attorney). The dashboards come with pre-defined tiles for each role, and the clients are able to customize those tiles based on their firm business drivers.
In the Home Page, the user is given a high-level overview of their performance on selected tiles for their various roles. The user has two options to drill down to additional details: (1) Click on the role tab to go to specific role page e.g. User can click “WA” tab to go to Working Attorney dashboard, or (2) click on one of the tiles (Tile header must show as a hyperlink) to go straight to the detail page for that tile.
If the user has the “Profit Manager (PROFM)” role, then the user can click the tab and go into the Profit dashboards. So, the Home Page is the launching point that allows the user to get to the Profit Manager content.
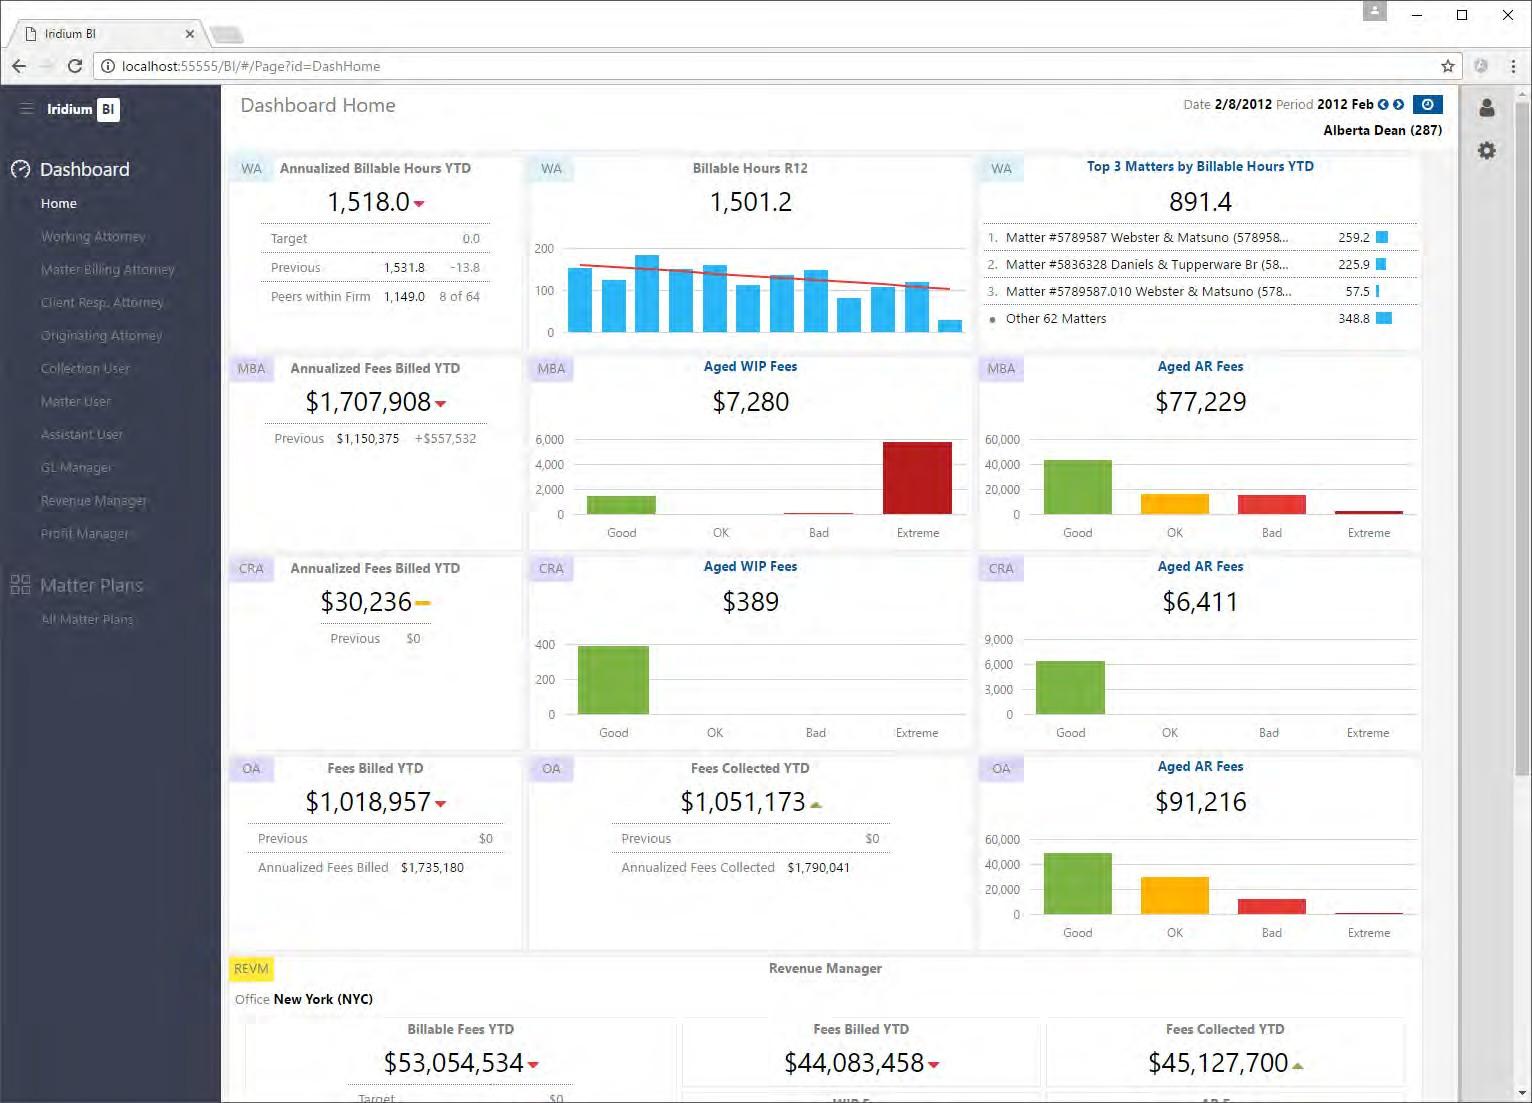
| © 2022
46
Iridium Technology – Profitability Best Practices
Iridium Technology – now a part of BigHand
Profit Manager – Role Overview Page
This page serves two purposes: (1) give the user a quick overview of the performance of the firm or unit, and (2) serve as a launching page for the other Profit reports.
The Profit Income Statement table shows the YTD breakdown for the components of the income statement, including profit, margin %, and rate. Note that the Profit Accounts listed in the income statement are customized based on the requirements of each Iridium BI client.
The links section in the navigation bar on the left lists all available pages, allowing for the user to quickly locate and launch dashboards for the various profit data slices.
Note that all content is customizable based on firm requirements, and the following screenshots are only a small subset of the total dashboard solution.
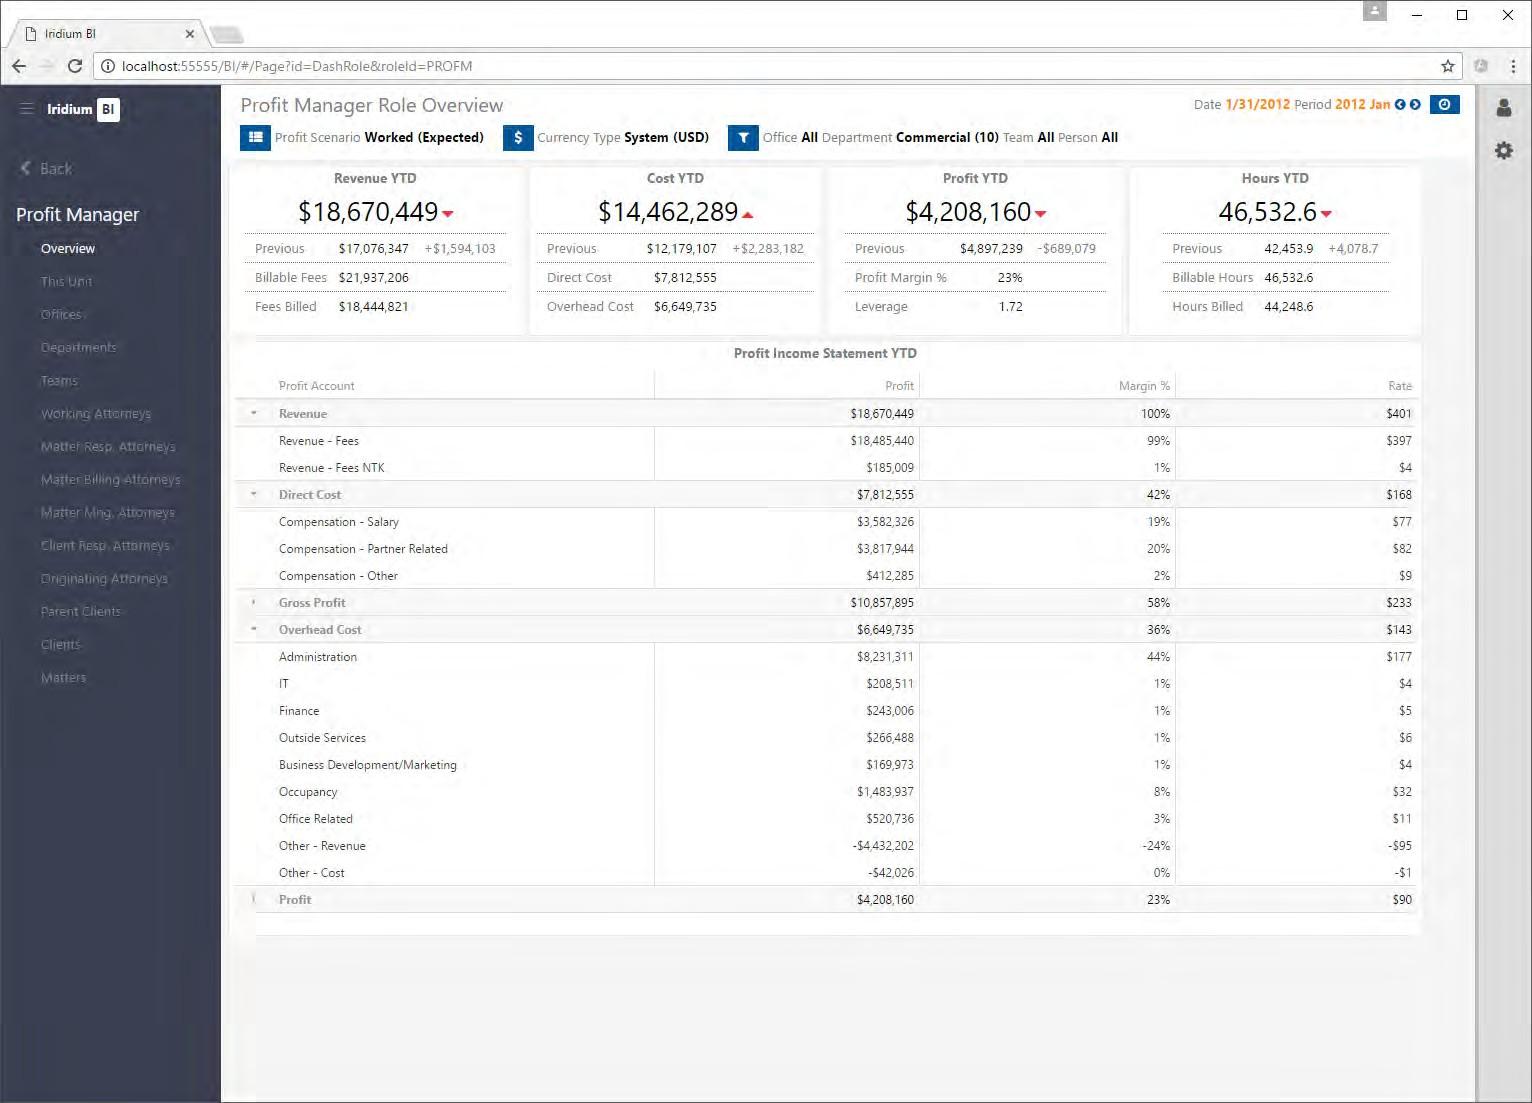
Iridium Technology – Profitability Best Practices | © 2022 Iridium Technology – now a part of BigHand 47
The Unit Page
The Unit Page displays data by Total Firm, Office, Department, or Team. Users can filter down through the data: for example, looking at the New York office and then drilling down to the Real Estate department within the New York office. The Trend graphs highlight Revenue, Cost, and Profit Margin % for each period YTD. Top 5 lists are provided to highlight key performers.
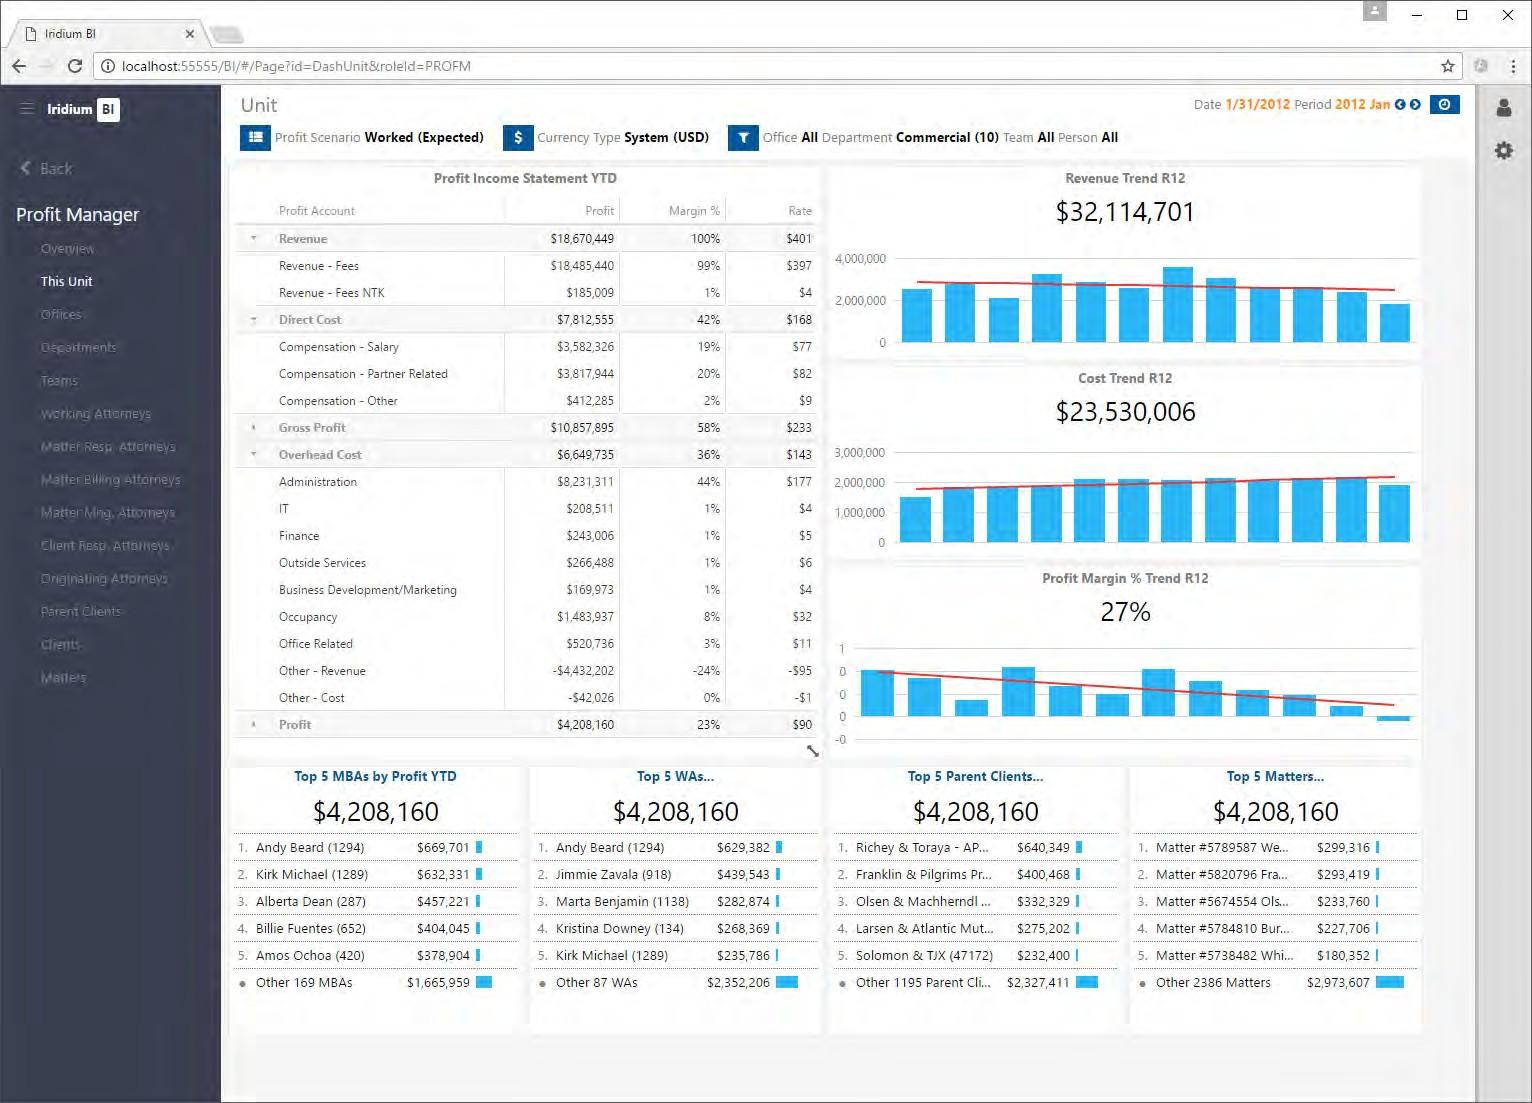
Iridium
–
Best
| © 2022
–
48
Technology
Profitability
Practices
Iridium Technology
now a part of BigHand
Selection / Comparison (List Pages)
These grid-based pages list all “units”, whether Offices, Departments, Teams, Clients, Matters, Timekeepers, etc. The grids support both sorting and filtering. The sample below lists timekeepers; the display is similar for all units.
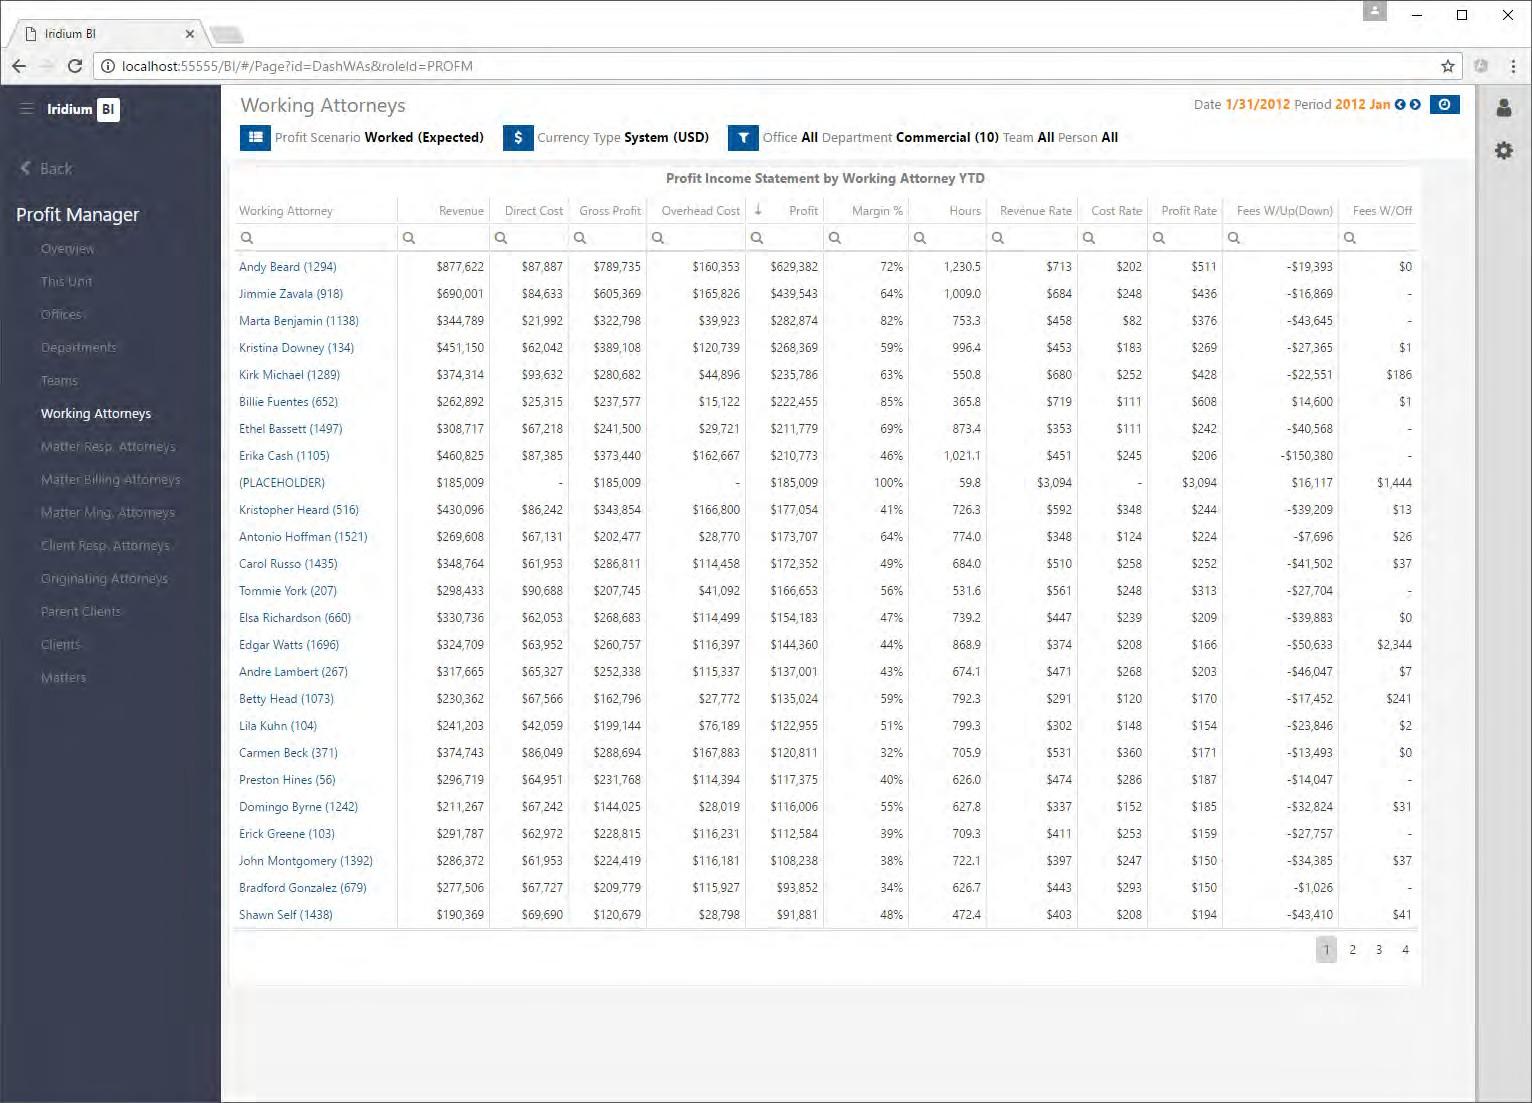
–
Best
| © 2022
–
49
Iridium Technology
Profitability
Practices
Iridium Technology
now a part of BigHand
Client Detail Page
This page gives a detailed profit view for a single client. An Income Statement is provided for the client, along with tiles that show income statement YTD, and the trends for Revenue, Cost, and Profit Margin.
The lower section displays top 5 items of MBAs, Clients and Matters with highest Profit contribution on the displayed client.
Note that similar detail pages are available for all slices: Office, Department, Team, Matter, Timekeeper, Originating Partner, etc.
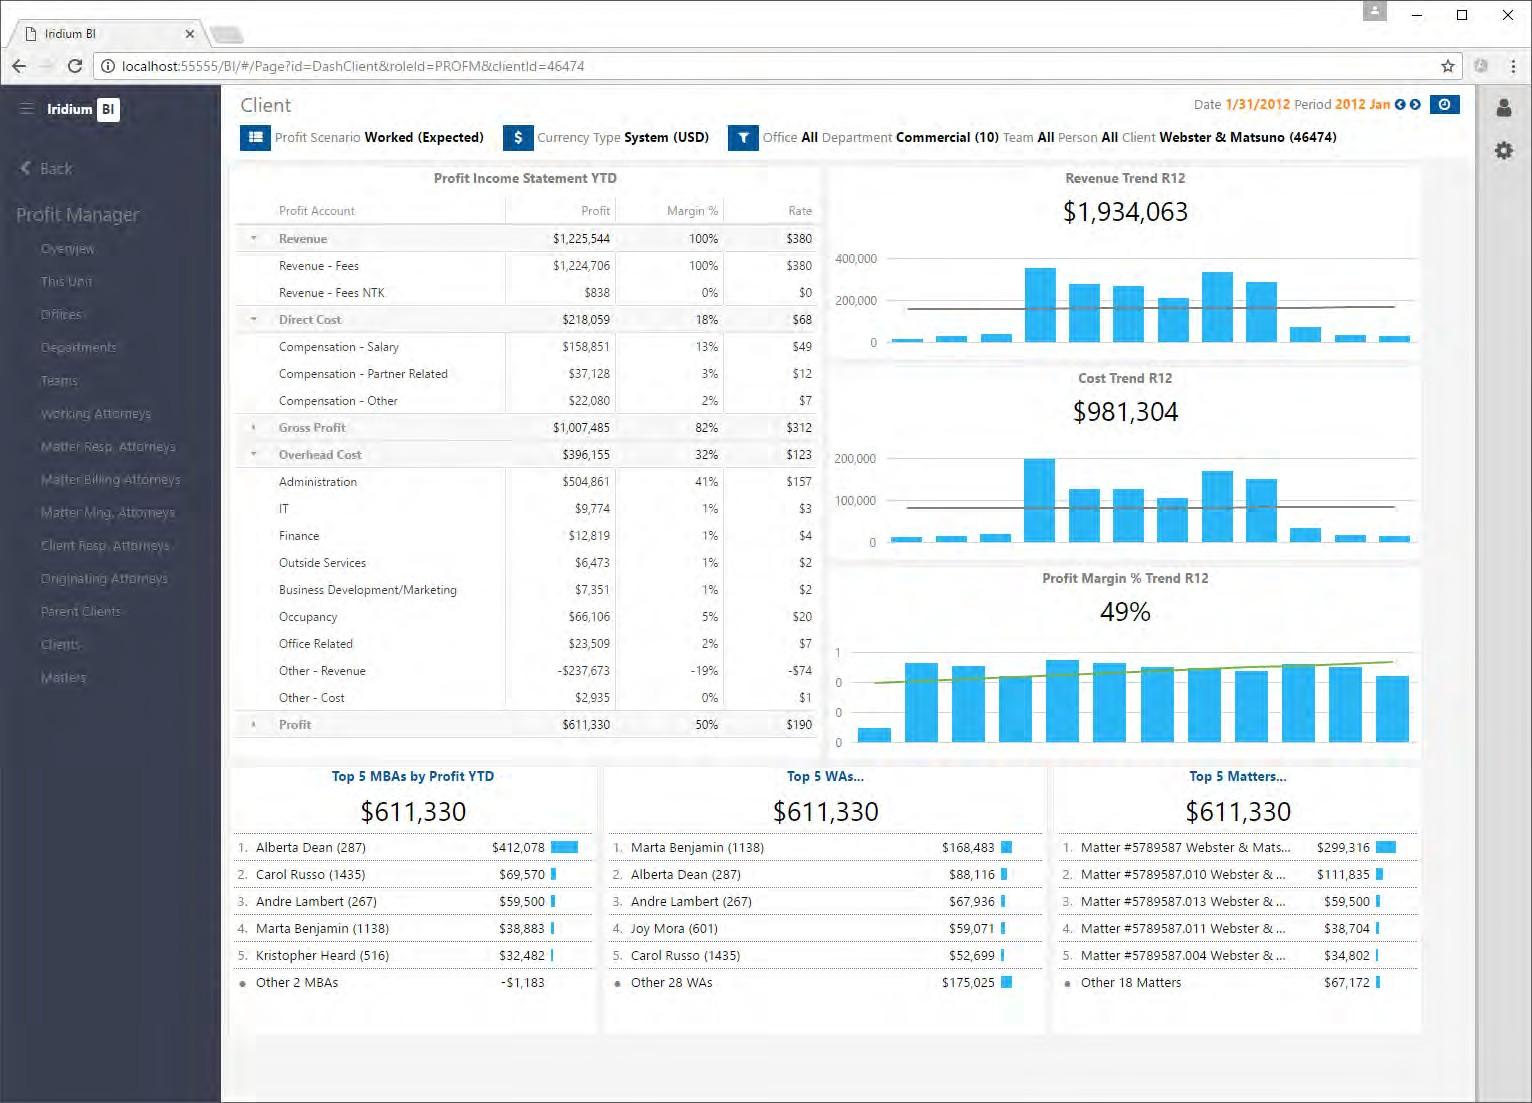
Iridium
–
Best Practices | © 2022
– now
50
Technology
Profitability
Iridium Technology
a part of BigHand
