8 minute read
Special Topics

One idea is “notional” salary for the partners, which breaks partner compensation into a “salary” and “distribution” component. The salary component represents the cost of having a salaried lawyer perform the equivalent work while the distribution component represents the premium that an owner receives for accepting some of the gain/loss risk of the firm. We set up separate profit accounts for each of these components to allow them to be treated separately in reporting and analysis. As an example, a partner with $700K in income might be set up with a notional salary of $400K and an expected distribution of $300K. It is up to the firm to decide the rules for notional salary values, or create a table of notional salary values for each partner.
The advantage of the notional salary is that it is a direct cost value for partners – a value that is “reasonable” and can be used for client/matter profitability analysis. On the other hand, the partner “profit” distribution is not a true cost; it is a distributed profit that is allocated to partners. Therefore, we can treat the distribution separately as an optional line item. When you want to analyze partner profitability and include the partner distributions, you simply include the distribution component in your analysis. Otherwise it can be suppressed.
The most common downside to a notional salary approach is that the formula for determining notional salary can be hard to defend and may seem arbitrary to partners. It opens up the model to dispute and case-by-case revision, especially for a profit scenario used in compensation.
BEST PRACTICES
— We recommend setting up notional salaries. — Structure the profit accounts to ensure that you can include or exclude the partner distribution in your profitability analysis based on your needs.
— To avoid case-by-case disputes where profitability is highly visible to partners, keep the rules for assigning notional salary as simple and as even as possible across positions, practice areas, etc.
— Whether you set up notional salaries or not, most firms choose to load in a single “plug” value for expected partner compensation during the fiscal year. The plug value is independent of the draw amount – it is the best estimate of the total partner compensation for the year. This provides stable/fair profit analysis during the financial year. Once the financial year is completed, the actual compensation values for each partner are backloaded. This can either be the same value for all partners, or individual values can be entered for partners (more likely and more accurate).
— Alternative #1: the firm can load in the partner draws throughout the year with the actual draw amounts. An additional plug is then entered that contains the difference between the draw amount and the expected total partner compensation for the year. Once again, load the final partner compensation values when they are available. Note: We strongly recommend smoothing Partner Compensation across all YTD periods, otherwise fair analysis cannot be performed on clients/matters that had time worked in the periods where the draws or other partner payments occurred.
— Alternative #2: the firm can load the notional salary for each partner in each period and only at the end of the year calculate the partner distribution as a variance between the total profit distributions and the notional salary already credited to each partner. This method is similar to the idea of the plug described above, except it does not need to be removed at the end of the year. This method would work best if the notional salary would be always lower than the total distributions. This method can also be seen as a cost smoothing attempt that brings nice stability to the timekeeper and client/matter profitability analysis.
Profitability Information Access
This is a very important topic: who in the firm will be able to view profitability reports and data, and what will they be able to see? There are three common strategies (and one uncommon one!):
Strategy Details
“Tightly Held” • Access to the profitability data is limited to a small group of 3-5 people in the firm, typically only finance staff and the Managing Director • This group reviews the profitability data, and when they noticea situation that requires action they have a “quiet talk” with the appropriate manager or timekeeper • Typically, there is limited or no distribution of any profitability reports
“Managers” • In addition to the Tightly Held group, theDepartment Heads or other managers are given access to profitability data • Client/Matter ResponsiblePartners can have access to profitability on their clients/matters • With this strategy, it is typical that the users get access to profitability data either through dashboards or reports
“All Partners” • In addition to the access detailed above, all partners are given access to their own sliceof the profitability data • Partners are given reports or dashboards so that they can see their personal contribution to firm profitability, and their performance on their individual clients and matters • They can also seetheir performance as an Originating or Client/Matter ResponsiblePartner • Additionally, they can view the profit contribution of thetimekeepers that have worked on their matters
“Wild West” (Uncommon) • All Partners can see the profitability data for the entirefirm, including the profitability contribution of the other (named) partners • We have not seen this with any of our clients, but we did demo for one firm that used this strategy
BEST PRACTICES
This is highly dependent on your firm culture, so the only best practices advice is to distribute the profitability results as widely as allowed by your firm culture, and continue to see if you can distribute them further each year.
Profitability Dashboard Access
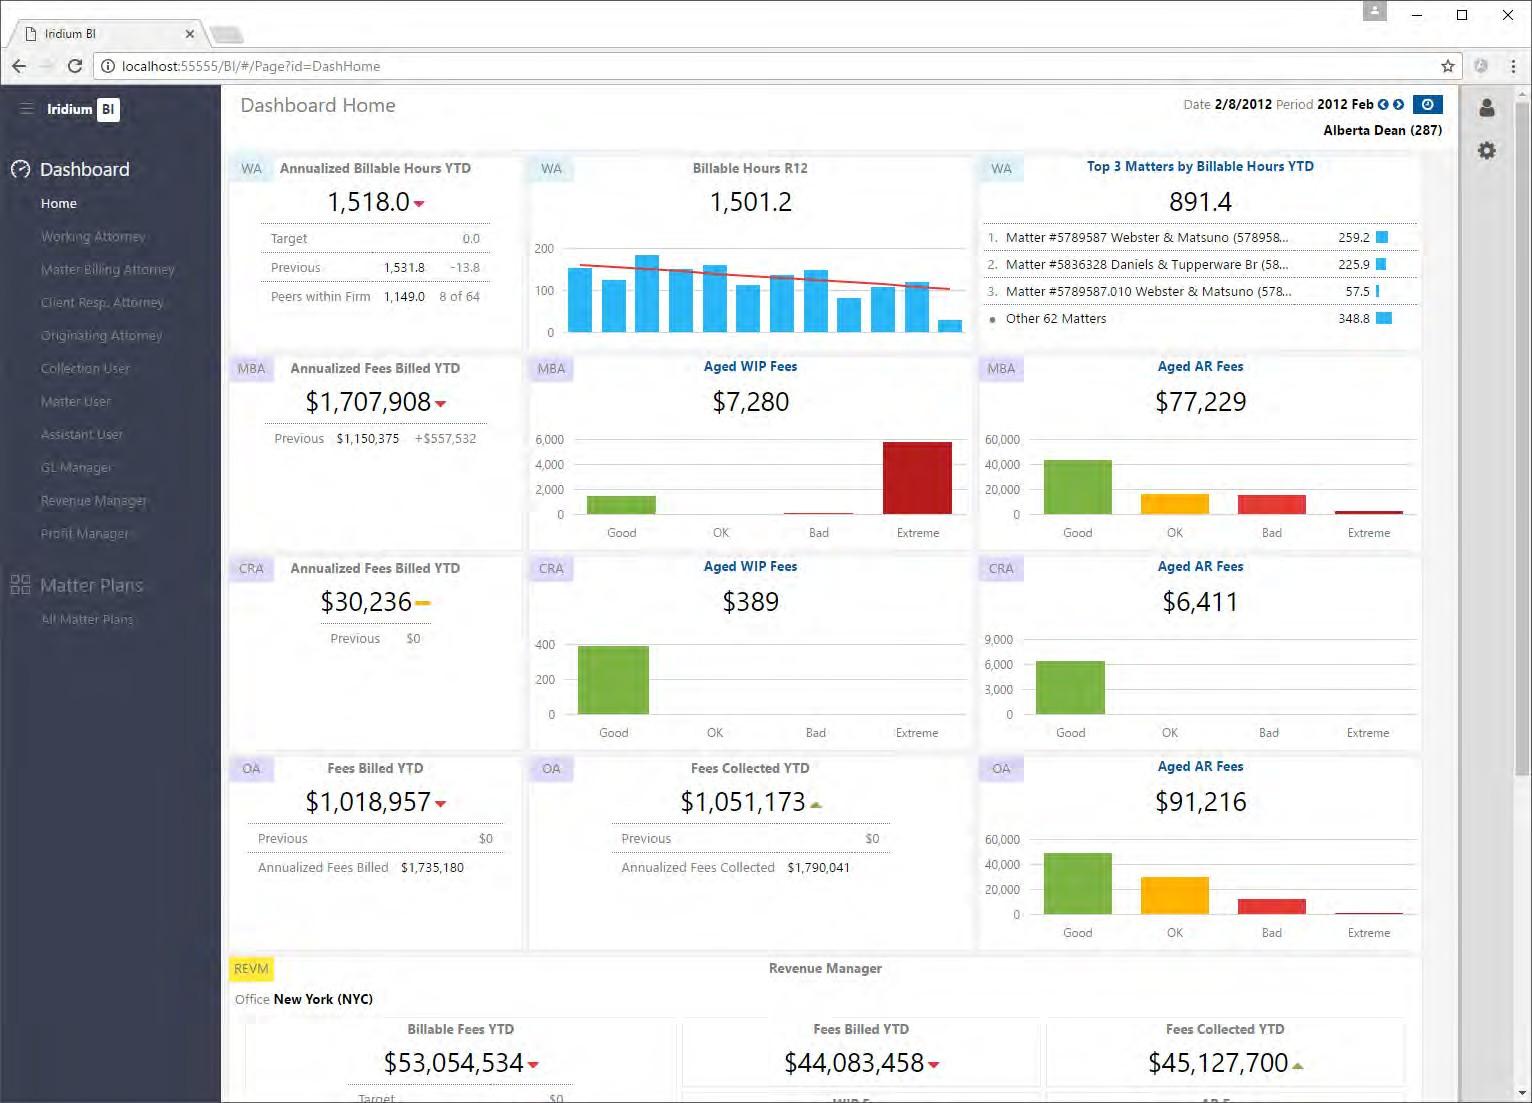
Quick follow-up topic: Iridium offers role-based Profit module dashboards for Executive (Total Firm), Office Manager, Department Head, Team Leader and Participating Attorney (Originations, etc.). If your firm will be deploying dashboards, you will need to determine which roles you will be rolling out.
Sample dashboards are listed in Appendix 1.
Important note: Many of our clients do not deploy profitability dashboards. They have a set of static (PDF format) reports that they distribute on a monthly basis and that covers their profitability reporting and analysis requirements. It is more likely to see dashboards deployed for firms that are giving access to all partners.
Special Topics
Bring us Your Toughest Customizations!
At Iridium, we strongly believe that each law firm is unique, and we need to cater to your special requirements. In the discussion above, did we miss anything? If so, here is your opportunity to capture and document any special requirements for your firm. Please think about these questions as you plan your implementation, and bring any special requests to us for discussion.
Note that in the history of the firm Iridium has delivered 2000+ customizations for our clients, and we have never once been unable to deliver on a customization request.
Question
Isthereanythingunique about… your firm’s profitability reporting requirements? • Yes – because we handle 500,000+ small matters each year we mighthave performance issues for client/matter analysis
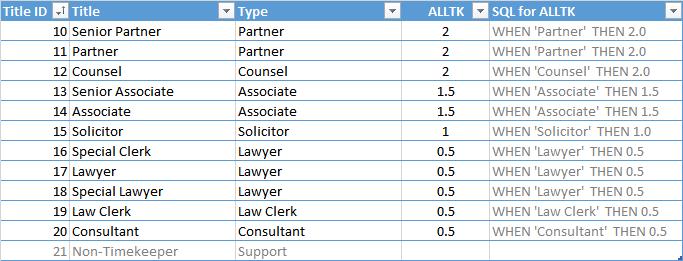
Isthereanythingunique about… your firm’s profitability allocation methods? • Yes – we define someranks as timekeepers for some costs but not for others • Yes – our last vendor told us that we made everything “insanely complicated”
Isthereanythingunique about… your firm’s profitability reporting requirements? • Yes – we havea set of profitability reports that we have been using for the last 10 years. We are going to need to reproduce matching reports off your solution.
(Pleaseadd rowsto this table if necessary)
Sample Answers / Comments Firm Answer
Handling Exceptions
Exceptions are a special case of customizations, typically focused around a couple timekeepers or clients. Think of it this way: a customization example is “combine paralegals with law clerks for profitability reporting”. An exception would be “combine paralegals with law clerks for reporting, except for James and Susan who need to be handled differently”. While we encourage clients to limit exceptions, we also acknowledge that there are valid business reasons that justify some exceptions.
BEST PRACTICES:
— There should be no limits on exception handling
— We prefer data driven solutions – i.e. avoiding hard codes. In the example above, we would not hard-code “except for James and Susan” into your implementation. Instead we would set up a table to track special paralegals, and the firm can then change who is assigned to the exception with no intervention or code change from Iridium
Loading Data from External Data Sources
Every Iridium Profit module implementation is already loading data from the payroll application, so we are comfortable with bringing in external data from other systems. We consider the task of bringing in external data to be part of a standard implementation. For example, with our Revenue module most clients bring in at least one external data source.
Common external data sources:
— Spreadsheets or custom tables for FTEs (Revenue/Profit)
— Custom tables in the ADERANT/Elite databases with custom client attributes (Revenue/Profit)
— Spreadsheets or custom tables with target/budget figures (Revenue/Profit) — Spreadsheets of custom tables with profit costs or setup data (etc.)
BEST PRACTICES:
— There should be no limits on extending the solution and loading external data. Period.
Ad-Hoc Analysis (Power Users)
Can you have a BI/dashboard solution without cubes? Absolutely. But if you don’t have cubes, you are going to miss out on a major BI deliverable: empowering your financial analysts to perform ad hoc analyses. Once your financial analysts have access to a robust cube and their trusty copy of Microsoft Excel, they will never go back to writing T-SQL queries against the practice management system database — results are available in seconds, instead of minutes or hours. The predominant power user tool is Microsoft Excel using PivotTables. Why is ad-hoc capability so important for financial analysts and power users?
— There will never be a set of dashboards that answer all user questions, especially the complex / infrequent questions. This means that a separate tool is required for handling those questions.
— Your financial analysts need to be able to self-serve and respond to queries quickly
— The financial analysts should not need to code in T-SQL or get a technical resource involved to respond to queries
— Having the cubes encourages your power users to “just fool around with the data” to see what they notice