4 minute read
Overview


— If you are reading this document, then you are of course familiar with these two basic equations:
o Gross Profit = Revenue – Direct Cost
o Profit = Revenue – (Direct Cost + Overhead Cost)
The power of the Iridium BI Profit module is that you have full control over every piece of data and the rules behind the equations – with no limits. Direct Costs are assigned to a single timekeeper. Typical direct costs are salary, bonus, taxes, benefits, etc. Your firm determines which costs are direct, and how you want to combine them and report on them. Overhead Costs are assigned to timekeepers by allocation methods. Typical overhead costs are Admin, IT, HR, Rent, etc. Your firm determines the allocation rules – again with no limits.
Profitability is calculated at the level of Timekeeper + Matter in each period. The cube then aggregates those values to report profitability by Office, Department, Team, Parent Client, Client, Matter Responsible Attorney, etc.
Data Sources
The Iridium BI Profit module allows firms to load in revenue, costs, and other data from multiple sources. Examples of sources could be your Practice Management System (“PMS”) General Ledger, PMS Time & Billing, Payroll, FTE spreadsheets, etc. There are no limitations on including the data sources that your firm needs.
These are the Data Sources that are typically defined in a client implementation:
REV
GL-IS
GL-BS
PAYROLL • Revenue values includebillablehours, billablefees, billed fees, collected fee, writedowns and write-offs, etc. • Revenue is loaded from the Iridium BI Revenue module. This assures that the Profit module and the Revenue module will be in reconciliation. • We do not require you to purchase the Iridium BI Revenue module in order to load revenue into Profit module
• GL-IS indicates Income Statement data from your PMS GL • This is the expense data from your GL
• GL-BS indicates Balance Sheet data from your PMS GL • Note that many firms will not bring any balance sheet data across, and for thosethat do this, it will typically be limited to partner compensation information
• Typically, compensation data will come directly from your payroll system, but in exceptional cases a firm may be storing compensation data in its GL • The main idea here is to load thesecosts as direct costfor timekeepers. Typically, all payroll systems have these costs in this format (per person) whereas the GL only has aggregated data. • Iridium provides tables that serve as a staging area for loading your payroll costs
Other • Firms have the option to load additional costs fromany external system • As an example, your firm might havecosts for the Ukraine office only available in a spreadsheet
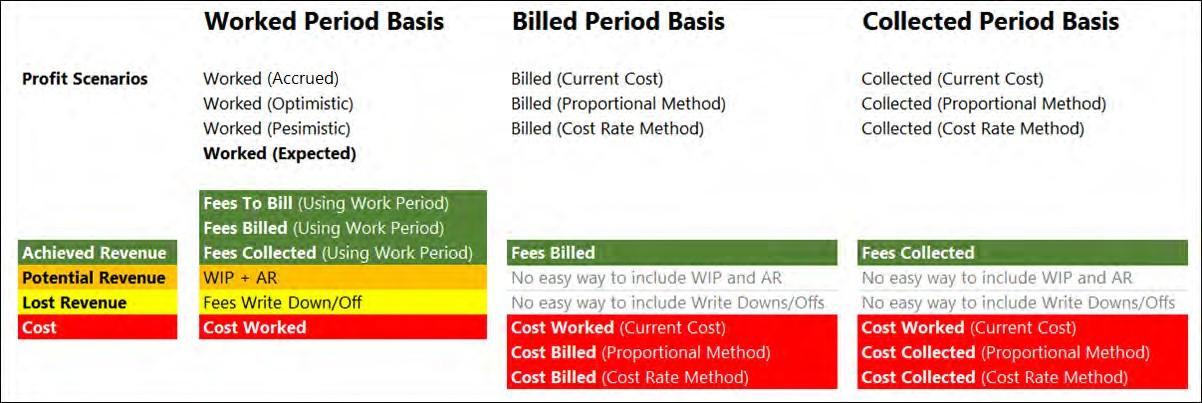
Residual Calculations
For some firms the payroll costs will not tie to the GL costs in the corresponding accounts. As an example, the payroll for January may total to $3.3 million in the payroll system, but the GL accounts may total $3.4 million. Your firm then has a choice: should we load that missing $100K residual, or do we stick with the $3.3 million value in the payroll file? And if your firm decides to load the missing $100K, how should it be allocated?
BEST PRACTICES:
— We fully support either loading the residual or suppressing it. It is really your firm’s choice.
— If we had to recommend a choice, it would be to load the GL residual. The costs are in the GL, so they are probably real costs that should be included in your profitability analysis.
— If you will load the residual costs, we will create a Profit Account for “PAYROLL-RESIDUAL”, and allocate it to timekeepers based on your choice of method.
PROFIT ACCOUNTS
A Profit Account is a grouping of costs and/or revenue that will make up your income statement. Typically, there is a “many to one” mapping between your GL accounts and Profit account. Each firm has a profitability implementation decision: how many Profit Accounts should I define, and what GL accounts will we map to each Profit Account? Note that the Profit Accounts are a key concept in your profitability analysis, and this is one of the decisions that has the biggest impact on the complexity of your profitability implementation. The two options are:
1. Aggressive Rollup (recommended): Aggressively roll up GL accounts into Profit Accounts.
An example of this strategy would be if a firm has 300 GL accounts and rolls them up into 15-20 Profit Accounts. The advantages of this strategy include smaller cube size, better performance, faster processing, and easier reconciliation.
2. Less Aggressive Rollup: An example of this strategy would be rolling up 300 GL accounts into 60 Profit Accounts.
Let’s look at an example of two GL accounts to determine how we should design the Profit Accounts: