8 minute read
Profit Scenarios

Now that we have covered the basics and introduced our profitability thesis, let’s look at the options for profitability analysis which are supported in Iridium BI. Note that multiple scenarios are supported simultaneously – there is no need for the firm to make a choice of one scenario exclusively.
Iridium BI: Ten Profit Scenarios
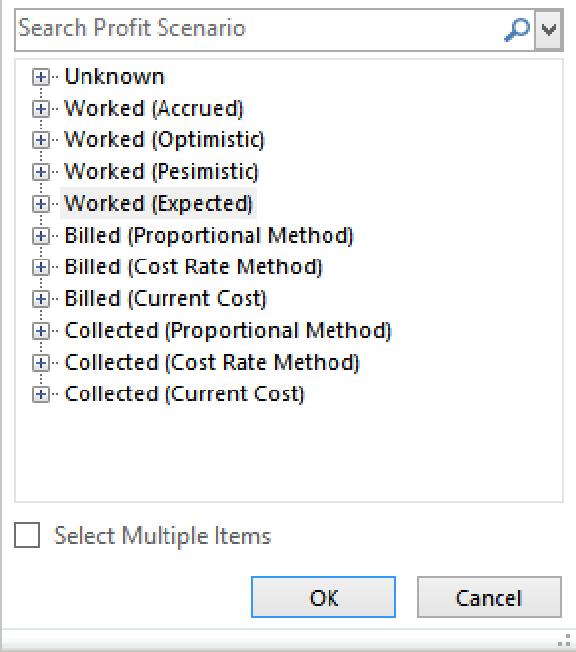
Based on feedback from our clients and prospects, Iridium has implemented ten distinct scenarios that are available for profitability analysis. Again, the firm is not required to limit themselves to one scenario; all ten scenarios are available and the firm can choose in which situations each method is appropriate. One note of caution: while our product can support multiple scenarios simultaneously, we encourage firms to limit the number of scenarios in order to maximize cube performance and reduce processing time.
Work Period Basis (Recommended Scenarios)
With the Work Period basis scenarios, we look at a block of work that is constrained by a Work Period. For example: looking at the work Jennifer did for Client X in 2014, what is the profitability? We offer four scenarios: Accrued, Optimistic, Pessimistic, and Expected. Each scenario has a different revenue calculation, but in all scenarios the costs remain constant. These are our preferred scenarios for profitability analysis because it accurately ties the costs of the work exactly to the cash that is collected based on that work and also accurately projects future profitability.
Emphasis: The Work Period Basis is starting with the costs, and tying them to the future collections.
Profit Scenario Details
Worked (Accrued) • This scenario simply assumes that the Revenue = Fees To Bill as they were accrued in the period. • It ignores any write downs, writeoffs, WIP, AR. Alternatively it can be customized to include some of these. • So in essence all billable work (Fees To Bill) performed is counted as collected revenue • Comments: While this scenario is available and fully supported, we think that most people would agree that this is not a realistic outcome. We do not consider using the Super Optimistic scenario to be best practices, but some firms may want to use it for timekeeper profitability analysis. Worked (Optimistic) • We start by looking at the work in a Work Period, and assume all WIP and AR will be billed and collected. So, Revenue is equal to Fees Collected + WIP + AR on the work. • This scenario assumes that no WIP or AR will beturned into additional writedowns or write-offs. Note there may be existing write-downs or write-offs • Comments: While this scenario is available and fully supported, we think that most people would agree that this is not a realistic outcome. We do not consider using the Optimistic scenario to be best practices. Worked (Pessimistic) • Revenue is Fees Collected to date, and the matter has negative profitability until the costs are covered by incoming collections • This scenario assumes that all WIP or AR will be turned into additional writedowns or write-offs. Note there may already be existing write-downs or writeoffs. • Comments: This scenario is Iridium’s second choice, and for several of our clients it is their first choice. An advantage of this scenario is that it really puts pressure on the partners to make collections so that their profitability statistics will improve. Worked (Expected) • Revenue is Fees Collected + expected WIP + expected AR collections. The expected component is saying that there is WIP and AR associated with this work, and it is likely that we will bill/collect some of it. • Our default implementation is to apply thehistorical billing and collection realization rates to the WIP and AR on a per-client basis • Clients can definetheir own custom calculations for expected realization of the WIP and AR. (One possibility would be to consider the age of the WIP/AR as a factor in calculating the likelihood of eventual collections.) • Comments: The Expected scenario certainly is the best scenario to use when reporting in profitability for matters where there is open WIP or AR. We recommend this scenario as best practices. This is a very powerful scenario for forecasting expected profit on work that has been done in the current year.
Important Note: At the point that there is no open WIP and AR left on a matter, then the three of the four scenarios (Optimistic, Pessimistic, and Expected) return the same profitability value. Since the Accrued method ignores Fees Write Down and Fees Write Off, it will only tie out with the other methods if there were no Fees Write Down and Fees Write Off.
Let’s look at the types of revenue that is available in the Profit cube:
— The Achieved Revenue component is what is considered as “in the bag”. It includes measures from all stages of the revenue pipeline: Billable Fees, Fees To Bill, Fees Billed,
Fees Collected
— The Lost Revenue is the Fees Write Down and Fees Write Off.
— The Potential Revenue is the WIP and AR. Eventually this will go to zero, having been converted to either Achieved Revenue or Lost Revenue.
Focus: The Impact of write-downs and write-offs (Profit Worked scenarios): The optimistic / pessimistic / expected profit value is based on collections, WIP, and AR. Write-downs and writeoffs are not directly included in the profit calculations, but they have the indirect impact of reducing collections, WIP, and AR and therefore reducing profitability. On the cost side of the equation, write-downs and write-offs do not reduce costs since the cost for the work is calculated at the time the work is done.
Profit Scenario Details
Collected/Billed (Proportional Method) • We start by looking at the collections (bills), and then go back to locate the cost of the work associated with the collections (bills). Note that the costs are most likely spread across multiple prior periods. • We identify the cost of the work associated with the collections (bills) by calculating the percentage of how much this collection (bill) is of the original fees (net of write-downs) and applying it to thetotal cost of that work in the work period. This allows us to get the proportional costs based on the collections. • If (for example) 50% of the revenuehas been collected, we then allocate 50% of the original costs of the work to this collection • Let’s look at a matter with $500 in fees collected and $1,000 in original fees. We have collected 50% of the revenue in this period. The cost of the work in the original period was $800 for that matter thereforethecollected equivalent will be $800 * 50% = $400. So, on the work collected so far, we have made a $100 profit – realized in this period. Comments • We are lukewarm on this scenario, and most clients do not use it. • We still support it because there is some interest from the client baseand prospects. • We have several concerns with this scenario: (1) it is that it is not predicting an accurate outcome – the costs are already a sunk cost, so we dislike only reporting a portion of the costs. (2) AR and WIP do not have associated costs, so if there is open WIP and AR this can overstate profitability. • Despite our concerns, we feel that this is a good scenario for answering the question “What was our profit on that $100K we just collected?”. We feel it makes sense only for profit on client/matters, but what about the profit on timekeepers and associated business units? We are effectively importing costs from previous years. We can accurately associate these costs with the matter, but which timekeeper/business unit gets to bear this historical cost in the current year? Keeping in mind the people who generated those costs may no longer be with the firm. • We prefer our Worked Period basis scenarios which takes the revenueback in the work period and matches it up with costs from those periods.
Collected/Billed (CostRate Method)
Collected/Billed (Current Cost) • In essence, this method is similar to the previous proportional method. It is also trying to calculate a portion of the original cost relative to the collections (bills) • For this scenario, we first determine the Hours Collected (Billed), and then multiply the hours by the estimated average timekeeper Cost Rate in the recent periods to comeup with costs • We support this scenario primarily for legacy reasons for someof our long-time clients • Comments: Our concern with this scenario is that the cost rate in the current period can be widely divergent from the cost rate at the time the work was done (hence the use of the word “estimated average”). Many clients using this method will move to YTD or R12 analysis to smooth out the cost rates, but we view this as a Band-Aid instead of an accurate solution. • Another shortcoming with this scenario is that for AFA or Contingency matters the Hours Collected (Billed) may not be accurate (or may not even exist), and this results in inaccurate costs. Some compensation technique must be used e.g. using Hours Relieved. • This is our least favorite scenario, and we disable it for most clients.
Additionally, it is the scenario with the longest cube processing time and slowest queries. • This scenario is simply looking at the rawdata in the period. For example, what were Jennifer’s collections and costs in 2014? • Theuser needs to be aware that there is a mismatch between revenue and costs (time shift) • Many firms usethis for ranking timekeepers (etc.) for profit contribution during the year, even though they are aware that there is a time-shift issue
This scenario starts with the revenue (Fees Billed/Collected) in a period, and then provides three scenarios for determining the cost component. Note that six scenarios are presented below but combined into three items since the corresponding Collected and Billed scenarios are very similar.
Notes:
— For all three scenarios, the collections (bills) are identical; collections are equal to raw Fees
Collected (Billed) in the period
— WIP and AR are not included in the calculations, so there are no costs associated with the
WIP and AR. This overstates the profitability of matters with open WIP and AR. — Fees Write Down and Fees Write Off are indirectly reflected in the calculations
— The big difference between the three scenarios is that each scenario has a different cost calculation