2 minute read
Flexible Profitability Analysis


BEST PRACTICES
— When selecting revenue scenarios, the best practice is to “use the scenario that your firm likes and has configured, but be aware of the pros and cons of that scenario”. Additionally, your firm could use different scenarios for different profitability reporting and analysis scenarios.
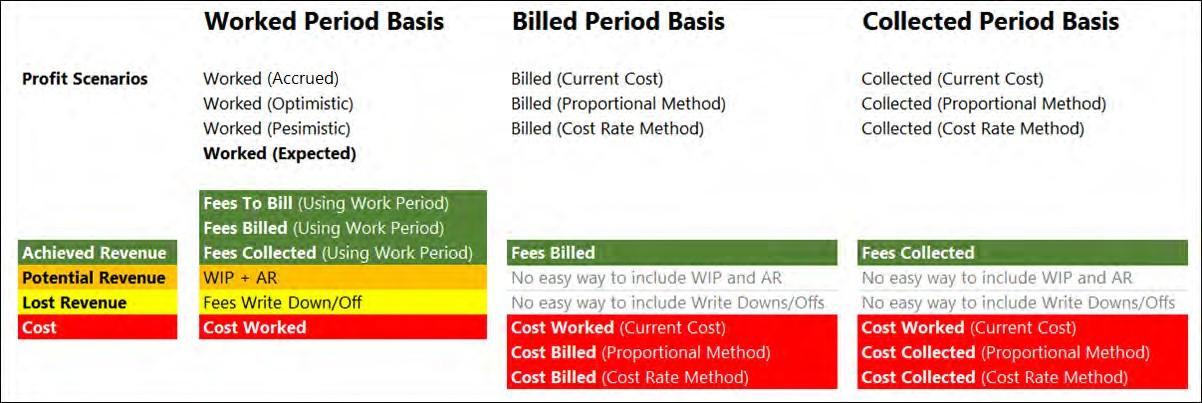
— Iridium has a strong preference for the “Work Period Basis” scenarios, since these are the only scenarios that tie the costs to the collections and also cater for WIP and AR. In order of preference:
o Worked (Expected)
o Worked (Pessimistic)
o Worked (Optimistic)
— When using the Worked - Expected scenario, we encourage clients to modify the calculations for the realization factors. In general, we think that this should be based on the realization rates for each client rather than firm-wide or department-wide histories.
— When looking at profitability on collections, we recommend the Collected (Proportional
Method) scenario
— When looking at profitability on bills, we recommend the Billed (Proportional Method) scenario
Iridium understands that clients have different reporting scenarios, and we would never insist that clients use a single set of profit numbers for all analysis situations. Iridium BI has several features and capabilities that allow firms to modify the costs, revenue, and hours to be included based on their profitability analysis requirements.
Note that we have already covered your firm choices for multiple revenue scenarios in the section above. This section covers scenarios in general, and some available options for costs and hours.
Profit Scenarios
Profit Scenarios allow firms to see multiple views of their profitability data and to switch between those views. If we look at the Profit Scenarios discussed in the previous section, the firm might elect to implement (for example) three of the ten scenarios. These scenarios would then be available in the Profit Scenario dimension. Within Iridium BI, we create scenarios that combine different views of costs and revenue. Firms that elect to implement the Cost Rate method can also choose the hours to be used in different Cost Rate scenarios. This is an example of the scenarios that might be implemented at a client:
Filtering Costs
The filtering capabilities of Excel can be used to build custom filtering into your pivot tables (and into our dashboards). An example might be that you want two views on profitability: one that includes partner bonuses and one that excludes partner bonuses. You can easily accomplish this by including/excluding the Profit Account for “PARTNER-BONUS” in your analysis.