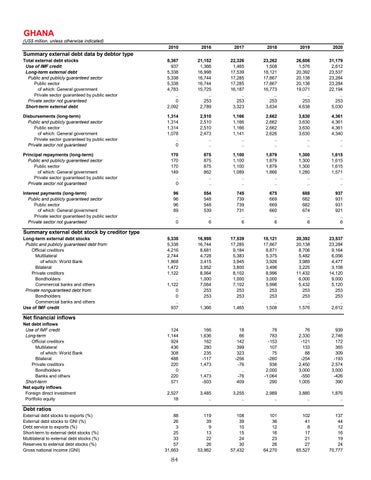
GHANA
(US$ million, unless otherwise indicated) 2010
2016
2017
2018
2019
2020
Total external debt stocks Use of IMF credit Long-term external debt Public and publicly guaranteed sector Public sector of which: General government Private sector guaranteed by public sector Private sector not guaranteed Short-term external debt
8,367 937 5,338 5,338 5,338 4,783 .. 0 2,092
21,152 1,366 16,998 16,744 16,744 15,725 .. 253 2,789
22,326 1,465 17,539 17,285 17,285 16,187 .. 253 3,323
23,262 1,508 18,121 17,867 17,867 16,773 .. 253 3,634
26,606 1,576 20,392 20,138 20,138 19,071 .. 253 4,638
31,179 2,612 23,537 23,284 23,284 22,194 .. 253 5,030
Disbursements (long-term) Public and publicly guaranteed sector Public sector of which: General government Private sector guaranteed by public sector Private sector not guaranteed
1,314 1,314 1,314 1,078 .. 0
2,510 2,510 2,510 2,473 .. ..
1,166 1,166 1,166 1,141 .. ..
2,662 2,662 2,662 2,626 .. ..
3,630 3,630 3,630 3,630 .. ..
4,361 4,361 4,361 4,340 .. ..
Principal repayments (long-term) Public and publicly guaranteed sector Public sector of which: General government Private sector guaranteed by public sector Private sector not guaranteed
170 170 170 149 .. 0
875 875 875 862 .. ..
1,100 1,100 1,100 1,089 .. ..
1,879 1,879 1,879 1,866 .. ..
1,300 1,300 1,300 1,280 .. ..
1,615 1,615 1,615 1,571 .. ..
Interest payments (long-term) Public and publicly guaranteed sector Public sector of which: General government Private sector guaranteed by public sector Private sector not guaranteed
96 96 96 89 .. 0
554 548 548 539 .. 6
745 739 739 731 .. 6
675 669 669 660 .. 6
688 682 682 674 .. 6
937 931 931 921 .. 6
5,338 5,338 4,216 2,744 1,868 1,472 1,122 .. 1,122 0 0 .. 937
16,998 16,744 8,681 4,728 3,415 3,952 8,064 1,000 7,064 253 253 .. 1,366
17,539 17,285 9,184 5,383 3,945 3,800 8,102 1,000 7,102 253 253 .. 1,465
18,121 17,867 8,871 5,375 3,926 3,496 8,996 3,000 5,996 253 253 .. 1,508
20,392 20,138 8,706 5,482 3,989 3,225 11,432 6,000 5,432 253 253 .. 1,576
23,537 23,284 9,164 6,056 4,477 3,108 14,120 9,000 5,120 253 253 .. 2,612
124 1,144 924 436 308 488 220 0 220 571
166 1,636 162 280 235 -117 1,473 .. 1,473 -503
18 66 142 399 323 -256 -76 .. -76 409
78 783 -153 107 75 -260 936 2,000 -1,064 290
76 2,330 -121 133 88 -254 2,450 3,000 -550 1,005
939 2,746 172 365 309 -193 2,574 3,000 -426 390
2,527 18
3,485 ..
3,255 ..
2,989 ..
3,880 ..
1,876 ..
88 26 3 25 33 57 31,663
119 39 9 13 22 26 53,962
108 39 10 15 24 30 57,432
101 36 12 16 23 26 64,270
102 41 8 17 21 27 65,527
137 44 12 16 19 24 70,777
Summary external debt data by debtor type
Summary external debt stock by creditor type
Long-term external debt stocks Public and publicly guaranteed debt from: Official creditors Multilateral of which: World Bank Bilateral Private creditors Bondholders Commercial banks and others Private nonguaranteed debt from: Bondholders Commercial banks and others Use of IMF credit
Net financial inflows
Net debt inflows Use of IMF credit Long-term Official creditors Multilateral of which: World Bank Bilateral Private creditors Bondholders Banks and others Short-term Net equity inflows Foreign direct investment Portfolio equity
Debt ratios
External debt stocks to exports (%) External debt stocks to GNI (%) Debt service to exports (%) Short-term to external debt stocks (%) Multilateral to external debt stocks (%) Reserves to external debt stocks (%) Gross national income (GNI)
84
