ETHIOPIA
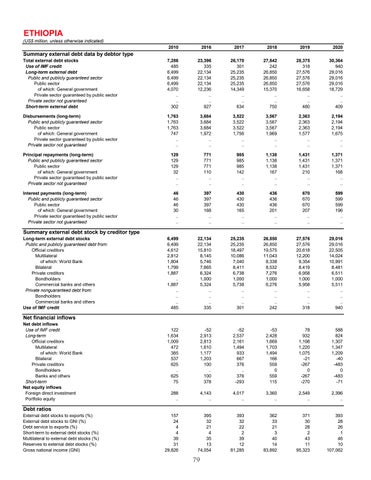
(US$ million, unless otherwise indicated) 2010
2016
2017
2018
2019
2020
Total external debt stocks Use of IMF credit Long-term external debt Public and publicly guaranteed sector Public sector of which: General government Private sector guaranteed by public sector Private sector not guaranteed Short-term external debt
7,286 485 6,499 6,499 6,499 4,070 .. .. 302
23,396 335 22,134 22,134 22,134 12,236 .. .. 927
26,170 301 25,235 25,235 25,235 14,349 .. .. 634
27,842 242 26,850 26,850 26,850 15,370 .. .. 750
28,375 318 27,576 27,576 27,576 16,658 .. .. 480
30,364 940 29,016 29,016 29,016 18,729 .. .. 409
Disbursements (long-term) Public and publicly guaranteed sector Public sector of which: General government Private sector guaranteed by public sector Private sector not guaranteed
1,763 1,763 1,763 747 .. ..
3,684 3,684 3,684 1,972 .. ..
3,522 3,522 3,522 1,756 .. ..
3,567 3,567 3,567 1,969 .. ..
2,363 2,363 2,363 1,577 .. ..
2,194 2,194 2,194 1,675 .. ..
Principal repayments (long-term) Public and publicly guaranteed sector Public sector of which: General government Private sector guaranteed by public sector Private sector not guaranteed
129 129 129 32 .. ..
771 771 771 110 .. ..
985 985 985 142 .. ..
1,138 1,138 1,138 167 .. ..
1,431 1,431 1,431 210 .. ..
1,371 1,371 1,371 168 .. ..
Interest payments (long-term) Public and publicly guaranteed sector Public sector of which: General government Private sector guaranteed by public sector Private sector not guaranteed
46 46 46 30 .. ..
397 397 397 168 .. ..
430 430 430 165 .. ..
436 436 436 201 .. ..
670 670 670 207 .. ..
599 599 599 196 .. ..
6,499 6,499 4,612 2,812 1,804 1,799 1,887 .. 1,887 .. .. .. 485
22,134 22,134 15,810 8,145 5,746 7,665 6,324 1,000 5,324 .. .. .. 335
25,235 25,235 18,497 10,086 7,040 8,411 6,738 1,000 5,738 .. .. .. 301
26,850 26,850 19,575 11,043 8,338 8,532 7,276 1,000 6,276 .. .. .. 242
27,576 27,576 20,618 12,200 9,354 8,419 6,958 1,000 5,958 .. .. .. 318
29,016 29,016 22,505 14,024 10,991 8,481 6,511 1,000 5,511 .. .. .. 940
122 1,634 1,009 472 385 537 625 .. 625 75
-52 2,913 2,813 1,610 1,177 1,203 100 .. 100 378
-52 2,537 2,161 1,494 933 667 376 .. 376 -293
-53 2,428 1,869 1,703 1,494 166 559 0 559 115
78 932 1,198 1,220 1,075 -21 -267 0 -267 -270
588 824 1,307 1,347 1,209 -40 -483 0 -483 -71
288 ..
4,143 ..
4,017 ..
3,360 ..
2,549 ..
2,396 ..
157 24 4 4 39 31 29,826
395 32 21 4 35 13 74,054
393 32 22 2 39 12 81,285
362 33 21 3 40 14 83,892
371 30 28 2 43 11 95,323
393 28 26 1 46 10 107,062
Summary external debt data by debtor type
Summary external debt stock by creditor type
Long-term external debt stocks Public and publicly guaranteed debt from: Official creditors Multilateral of which: World Bank Bilateral Private creditors Bondholders Commercial banks and others Private nonguaranteed debt from: Bondholders Commercial banks and others Use of IMF credit
Net financial inflows
Net debt inflows Use of IMF credit Long-term Official creditors Multilateral of which: World Bank Bilateral Private creditors Bondholders Banks and others Short-term Net equity inflows Foreign direct investment Portfolio equity
Debt ratios
External debt stocks to exports (%) External debt stocks to GNI (%) Debt service to exports (%) Short-term to external debt stocks (%) Multilateral to external debt stocks (%) Reserves to external debt stocks (%) Gross national income (GNI)
79
