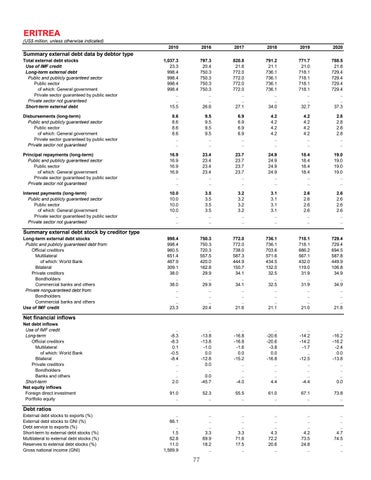
ERITREA
(US$ million, unless otherwise indicated) 2010
2016
2017
2018
2019
2020
Total external debt stocks Use of IMF credit Long-term external debt Public and publicly guaranteed sector Public sector of which: General government Private sector guaranteed by public sector Private sector not guaranteed Short-term external debt
1,037.3 23.3 998.4 998.4 998.4 998.4 .. .. 15.5
797.3 20.4 750.3 750.3 750.3 750.3 .. .. 26.6
820.8 21.6 772.0 772.0 772.0 772.0 .. .. 27.1
791.2 21.1 736.1 736.1 736.1 736.1 .. .. 34.0
771.7 21.0 718.1 718.1 718.1 718.1 .. .. 32.7
788.5 21.8 729.4 729.4 729.4 729.4 .. .. 37.3
Disbursements (long-term) Public and publicly guaranteed sector Public sector of which: General government Private sector guaranteed by public sector Private sector not guaranteed
8.6 8.6 8.6 8.6 .. ..
9.5 9.5 9.5 9.5 .. ..
6.9 6.9 6.9 6.9 .. ..
4.2 4.2 4.2 4.2 .. ..
4.2 4.2 4.2 4.2 .. ..
2.8 2.8 2.8 2.8 .. ..
Principal repayments (long-term) Public and publicly guaranteed sector Public sector of which: General government Private sector guaranteed by public sector Private sector not guaranteed
16.9 16.9 16.9 16.9 .. ..
23.4 23.4 23.4 23.4 .. ..
23.7 23.7 23.7 23.7 .. ..
24.9 24.9 24.9 24.9 .. ..
18.4 18.4 18.4 18.4 .. ..
19.0 19.0 19.0 19.0 .. ..
Interest payments (long-term) Public and publicly guaranteed sector Public sector of which: General government Private sector guaranteed by public sector Private sector not guaranteed
10.0 10.0 10.0 10.0 .. ..
3.5 3.5 3.5 3.5 .. ..
3.2 3.2 3.2 3.2 .. ..
3.1 3.1 3.1 3.1 .. ..
2.6 2.6 2.6 2.6 .. ..
2.6 2.6 2.6 2.6 .. ..
998.4 998.4 960.5 651.4 467.9 309.1 38.0 .. 38.0 .. .. .. 23.3
750.3 750.3 720.3 557.5 420.0 162.8 29.9 .. 29.9 .. .. .. 20.4
772.0 772.0 738.0 587.3 444.9 150.7 34.1 .. 34.1 .. .. .. 21.6
736.1 736.1 703.6 571.6 434.5 132.0 32.5 .. 32.5 .. .. .. 21.1
718.1 718.1 686.2 567.1 432.0 119.0 31.9 .. 31.9 .. .. .. 21.0
729.4 729.4 694.5 587.8 449.9 106.8 34.9 .. 34.9 .. .. .. 21.8
.. -8.3 -8.3 0.1 -0.5 -8.4 .. .. .. 2.0
.. -13.8 -13.8 -1.0 0.0 -12.8 0.0 .. 0.0 -45.7
.. -16.8 -16.8 -1.6 0.0 -15.2 .. .. .. -4.0
.. -20.6 -20.6 -3.8 0.0 -16.8 .. .. .. 4.4
.. -14.2 -14.2 -1.7 .. -12.5 .. .. .. -4.4
.. -16.2 -16.2 -2.4 0.0 -13.8 .. .. .. 0.0
91.0 ..
52.3 ..
55.5 ..
61.0 ..
67.1 ..
73.8 ..
.. 66.1 .. 1.5 62.8 11.0 1,569.9
.. .. .. 3.3 69.9 18.2 ..
.. .. .. 3.3 71.6 17.5 ..
.. .. .. 4.3 72.2 20.6 ..
.. .. .. 4.2 73.5 24.8 ..
.. .. .. 4.7 74.5 .. ..
Summary external debt data by debtor type
Summary external debt stock by creditor type
Long-term external debt stocks Public and publicly guaranteed debt from: Official creditors Multilateral of which: World Bank Bilateral Private creditors Bondholders Commercial banks and others Private nonguaranteed debt from: Bondholders Commercial banks and others Use of IMF credit
Net financial inflows
Net debt inflows Use of IMF credit Long-term Official creditors Multilateral of which: World Bank Bilateral Private creditors Bondholders Banks and others Short-term Net equity inflows Foreign direct investment Portfolio equity
Debt ratios
External debt stocks to exports (%) External debt stocks to GNI (%) Debt service to exports (%) Short-term to external debt stocks (%) Multilateral to external debt stocks (%) Reserves to external debt stocks (%) Gross national income (GNI)
77
