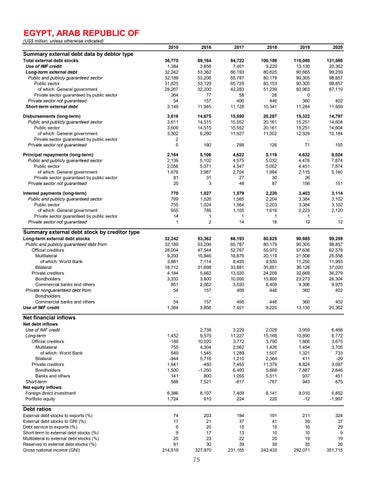
EGYPT, ARAB REPUBLIC OF
(US$ million, unless otherwise indicated)
2010
2016
2017
2018
2019
2020
Total external debt stocks Use of IMF credit Long-term external debt Public and publicly guaranteed sector Public sector of which: General government Private sector guaranteed by public sector Private sector not guaranteed Short-term external debt
36,775 1,384 32,242 32,189 31,825 28,267 364 54 3,149
69,164 3,856 53,362 53,206 53,129 32,200 77 157 11,945
84,722 7,401 66,193 65,787 65,729 42,283 58 406 11,128
100,186 9,220 80,625 80,179 80,153 51,239 26 446 10,341
115,080 13,130 90,665 90,305 90,305 60,963 0 360 11,284
131,580 20,362 99,259 98,857 98,857 67,119 .. 402 11,959
Disbursements (long-term) Public and publicly guaranteed sector Public sector of which: General government Private sector guaranteed by public sector Private sector not guaranteed
3,616 3,611 3,609 3,302 2 5
14,675 14,515 14,515 6,280 .. 160
15,850 15,552 15,552 11,927 .. 298
20,287 20,161 20,161 11,302 .. 126
15,322 15,251 15,251 12,329 .. 71
14,797 14,604 14,604 10,184 .. 193
Principal repayments (long-term) Public and publicly guaranteed sector Public sector of which: General government Private sector guaranteed by public sector Private sector not guaranteed
2,164 2,139 2,058 1,678 81 25
5,106 5,102 5,071 3,987 31 3
4,622 4,575 4,547 2,704 27 48
5,119 5,032 5,002 1,994 30 87
4,632 4,476 4,451 2,115 26 156
8,024 7,874 7,874 5,140 .. 151
Interest payments (long-term) Public and publicly guaranteed sector Public sector of which: General government Private sector guaranteed by public sector Private sector not guaranteed
770 769 755 655 14 1
1,027 1,026 1,024 785 1 2
1,579 1,565 1,564 1,105 1 14
2,220 2,204 2,203 1,616 1 16
3,403 3,384 3,384 2,223 1 19
3,114 3,102 3,102 2,120 .. 12
32,242 32,189 28,004 9,293 3,881 18,712 4,184 3,333 851 54 .. 54 1,384
53,362 53,206 47,544 15,846 7,114 31,698 5,662 3,600 2,062 157 .. 157 3,856
66,193 65,787 52,767 18,876 8,435 33,891 13,020 10,000 3,020 406 .. 406 7,401
80,625 80,179 55,970 20,119 9,930 35,851 24,209 15,800 8,409 446 .. 446 9,220
90,665 90,305 57,636 21,508 11,250 36,128 32,669 23,273 9,396 360 .. 360 13,130
99,259 98,857 62,578 25,558 11,993 37,020 36,279 26,304 9,975 402 .. 402 20,362
.. 1,452 -189 755 649 -944 1,641 1,500 141 588
2,738 9,570 10,020 4,304 1,545 5,716 -450 -1,250 800 7,521
3,229 11,227 3,772 2,562 1,289 1,210 7,455 6,400 1,055 -817
2,029 15,168 3,790 1,426 1,507 2,364 11,379 5,868 5,511 -787
3,959 10,690 1,866 1,454 1,321 411 8,824 7,887 937 943
6,468 6,772 3,675 3,705 733 -29 3,097 2,646 451 675
6,386 1,724
8,107 610
7,409 224
8,141 220
9,010 -12
5,852 -1,997
74 17 6 9 25 91 214,619
203 21 20 17 23 30 327,970
194 37 15 13 22 39 231,165
191 41 15 10 20 39 243,433
211 39 16 10 19 35 292,071
324 37 29 9 19 26 351,715
Summary external debt data by debtor type
Summary external debt stock by creditor type
Long-term external debt stocks Public and publicly guaranteed debt from: Official creditors Multilateral of which: World Bank Bilateral Private creditors Bondholders Commercial banks and others Private nonguaranteed debt from: Bondholders Commercial banks and others Use of IMF credit
Net financial inflows
Net debt inflows Use of IMF credit Long-term Official creditors Multilateral of which: World Bank Bilateral Private creditors Bondholders Banks and others Short-term Net equity inflows Foreign direct investment Portfolio equity
Debt ratios
External debt stocks to exports (%) External debt stocks to GNI (%) Debt service to exports (%) Short-term to external debt stocks (%) Multilateral to external debt stocks (%) Reserves to external debt stocks (%) Gross national income (GNI)
75
