ECUADOR
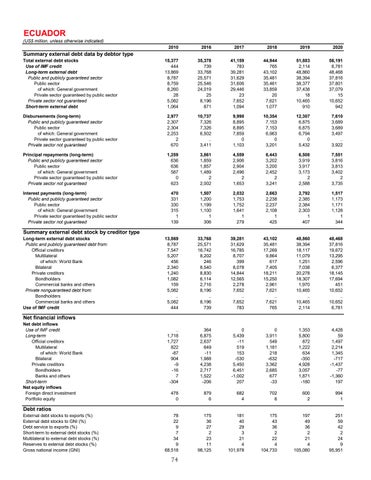
(US$ million, unless otherwise indicated) 2010
2016
2017
2018
2019
2020
Total external debt stocks Use of IMF credit Long-term external debt Public and publicly guaranteed sector Public sector of which: General government Private sector guaranteed by public sector Private sector not guaranteed Short-term external debt
15,377 444 13,869 8,787 8,759 8,260 28 5,082 1,064
35,378 739 33,768 25,571 25,546 24,019 25 8,196 871
41,159 783 39,281 31,629 31,606 29,446 23 7,652 1,094
44,944 765 43,102 35,481 35,461 33,859 20 7,621 1,077
51,883 2,114 48,860 38,394 38,377 37,438 18 10,465 910
56,191 6,781 48,468 37,816 37,801 37,079 15 10,652 942
Disbursements (long-term) Public and publicly guaranteed sector Public sector of which: General government Private sector guaranteed by public sector Private sector not guaranteed
2,977 2,307 2,304 2,253 2 670
10,737 7,326 7,326 6,502 .. 3,411
9,998 8,895 8,895 7,859 0 1,103
10,354 7,153 7,153 6,963 0 3,201
12,307 6,875 6,875 6,794 0 5,432
7,610 3,689 3,689 3,497 .. 3,922
Principal repayments (long-term) Public and publicly guaranteed sector Public sector of which: General government Private sector guaranteed by public sector Private sector not guaranteed
1,259 636 636 587 0 623
3,861 1,859 1,857 1,489 2 2,002
4,559 2,906 2,904 2,496 2 1,653
6,443 3,202 3,200 2,452 2 3,241
6,508 3,919 3,917 3,173 2 2,588
7,551 3,816 3,813 3,402 2 3,735
Interest payments (long-term) Public and publicly guaranteed sector Public sector of which: General government Private sector guaranteed by public sector Private sector not guaranteed
470 331 330 315 1 139
1,507 1,200 1,199 1,100 1 306
2,032 1,753 1,752 1,641 1 279
2,663 2,238 2,237 2,108 1 425
2,792 2,385 2,384 2,303 1 407
1,517 1,173 1,171 1,128 1 344
13,869 8,787 7,547 5,207 456 2,340 1,240 1,082 159 5,082 .. 5,082 444
33,768 25,571 16,742 8,202 246 8,540 8,830 6,114 2,716 8,196 .. 8,196 739
39,281 31,629 16,785 8,707 399 8,078 14,844 12,565 2,278 7,652 .. 7,652 783
43,102 35,481 17,269 9,864 617 7,405 18,211 15,250 2,961 7,621 .. 7,621 765
48,860 38,394 18,117 11,079 1,251 7,038 20,278 18,307 1,970 10,465 .. 10,465 2,114
48,468 37,816 19,672 13,295 2,596 6,377 18,145 17,694 451 10,652 .. 10,652 6,781
.. 1,718 1,727 822 -87 904 -9 -16 7 -304
364 6,875 2,637 649 -11 1,988 4,238 2,717 1,522 -206
0 5,439 -11 519 153 -530 5,450 6,451 -1,002 207
0 3,911 549 1,181 218 -632 3,362 2,685 677 -33
1,353 5,800 872 1,222 634 -350 4,928 3,057 1,871 -180
4,428 59 1,497 2,214 1,345 -717 -1,437 -77 -1,360 197
478 0
879 6
682 4
702 6
600 2
994 1
78 22 9 7 34 9 68,518
175 36 27 2 23 11 98,125
181 40 29 3 21 4 101,978
175 43 36 2 22 4 104,733
197 49 36 2 21 4 105,080
251 59 42 2 24 9 95,951
Summary external debt data by debtor type
Summary external debt stock by creditor type
Long-term external debt stocks Public and publicly guaranteed debt from: Official creditors Multilateral of which: World Bank Bilateral Private creditors Bondholders Commercial banks and others Private nonguaranteed debt from: Bondholders Commercial banks and others Use of IMF credit
Net financial inflows
Net debt inflows Use of IMF credit Long-term Official creditors Multilateral of which: World Bank Bilateral Private creditors Bondholders Banks and others Short-term Net equity inflows Foreign direct investment Portfolio equity
Debt ratios
External debt stocks to exports (%) External debt stocks to GNI (%) Debt service to exports (%) Short-term to external debt stocks (%) Multilateral to external debt stocks (%) Reserves to external debt stocks (%) Gross national income (GNI)
74
