CÔTE D'IVOIRE
(US$ million, unless otherwise indicated) 2010
2016
2017
2018
2019
2020
Total external debt stocks Use of IMF credit Long-term external debt Public and publicly guaranteed sector Public sector of which: General government Private sector guaranteed by public sector Private sector not guaranteed Short-term external debt
11,703 861 10,431 9,413 9,413 9,412 .. 1,018 411
11,457 1,495 9,693 8,369 8,369 8,369 .. 1,324 269
13,449 1,738 11,683 10,445 10,445 10,445 .. 1,238 28
16,185 1,814 14,233 13,221 13,221 12,673 .. 1,011 138
19,816 1,915 17,012 15,733 15,733 15,182 .. 1,279 890
25,073 3,047 20,967 19,976 19,976 19,014 .. 991 1,059
Disbursements (long-term) Public and publicly guaranteed sector Public sector of which: General government Private sector guaranteed by public sector Private sector not guaranteed
599 244 244 244 .. 355
1,237 897 897 897 .. 341
3,232 3,091 3,091 3,091 .. 141
3,867 3,747 3,747 3,182 .. 120
5,080 4,508 4,508 4,495 .. 572
4,307 4,307 4,307 3,938 .. ..
Principal repayments (long-term) Public and publicly guaranteed sector Public sector of which: General government Private sector guaranteed by public sector Private sector not guaranteed
623 438 438 438 .. 185
1,096 726 726 726 .. 370
1,730 1,418 1,418 1,418 .. 312
1,036 702 702 702 .. 334
2,247 1,946 1,946 1,946 .. 302
1,536 1,225 1,225 1,189 .. 311
Interest payments (long-term) Public and publicly guaranteed sector Public sector of which: General government Private sector guaranteed by public sector Private sector not guaranteed
114 58 58 58 .. 56
402 315 315 315 .. 87
399 329 329 329 .. 70
453 407 407 406 .. 47
556 518 518 517 .. 38
699 671 671 642 .. 28
10,431 9,413 9,301 2,373 1,763 6,928 112 0 112 1,018 .. 1,018 861
9,693 8,369 4,108 1,021 522 3,087 4,261 4,219 43 1,324 .. 1,324 1,495
11,683 10,445 5,007 1,582 781 3,425 5,438 5,398 40 1,238 .. 1,238 1,738
14,233 13,221 5,187 2,011 883 3,176 8,034 7,230 804 1,011 .. 1,011 1,814
17,012 15,733 5,957 2,592 1,204 3,364 9,776 7,589 2,187 1,279 .. 1,279 1,915
20,967 19,976 7,925 3,972 1,882 3,953 12,051 8,532 3,519 991 .. 991 3,047
44 -25 -220 17 -26 -237 196 .. 196 20
33 142 43 152 140 -109 99 136 -38 269
150 1,502 540 450 205 90 962 1,136 -173 -241
119 2,831 328 497 132 -169 2,503 1,928 575 110
111 2,832 765 513 236 252 2,067 404 1,663 752
1,019 2,771 1,552 1,095 536 457 1,219 478 741 169
371 2
531 8
644 24
590 15
618 12
509 ..
91 49 6 4 20 31 23,996
95 24 13 2 9 .. 46,888
102 27 17 0 12 .. 50,052
120 29 12 1 12 .. 55,809
140 35 21 4 13 .. 56,976
.. 42 .. 4 16 .. 59,585
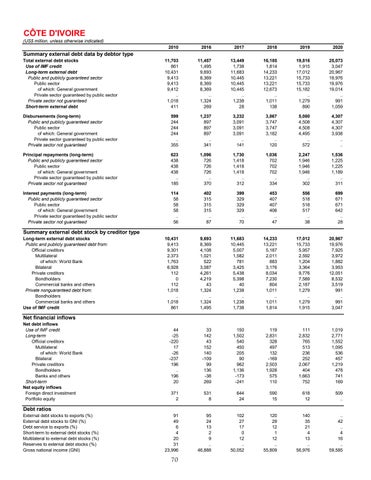
Summary external debt data by debtor type
Summary external debt stock by creditor type
Long-term external debt stocks Public and publicly guaranteed debt from: Official creditors Multilateral of which: World Bank Bilateral Private creditors Bondholders Commercial banks and others Private nonguaranteed debt from: Bondholders Commercial banks and others Use of IMF credit
Net financial inflows
Net debt inflows Use of IMF credit Long-term Official creditors Multilateral of which: World Bank Bilateral Private creditors Bondholders Banks and others Short-term Net equity inflows Foreign direct investment Portfolio equity
Debt ratios
External debt stocks to exports (%) External debt stocks to GNI (%) Debt service to exports (%) Short-term to external debt stocks (%) Multilateral to external debt stocks (%) Reserves to external debt stocks (%) Gross national income (GNI)
70
