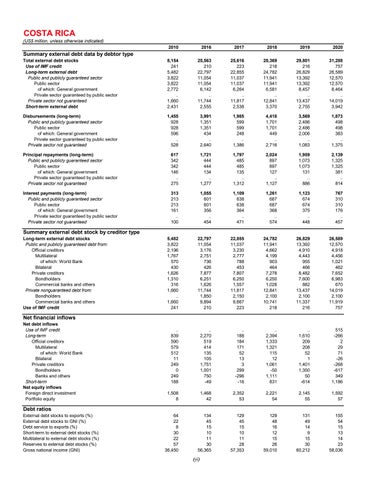
COSTA RICA
(US$ million, unless otherwise indicated) 2010
2016
2017
2018
2019
2020
Total external debt stocks Use of IMF credit Long-term external debt Public and publicly guaranteed sector Public sector of which: General government Private sector guaranteed by public sector Private sector not guaranteed Short-term external debt
8,154 241 5,482 3,822 3,822 2,772 .. 1,660 2,431
25,563 210 22,797 11,054 11,054 6,142 .. 11,744 2,555
25,616 223 22,855 11,037 11,037 6,264 .. 11,817 2,538
28,369 218 24,782 11,941 11,941 6,581 .. 12,841 3,370
29,801 216 26,829 13,392 13,392 8,457 .. 13,437 2,755
31,288 757 26,589 12,570 12,570 8,464 .. 14,019 3,942
Disbursements (long-term) Public and publicly guaranteed sector Public sector of which: General government Private sector guaranteed by public sector Private sector not guaranteed
1,455 928 928 596 .. 528
3,991 1,351 1,351 434 .. 2,640
1,985 599 599 248 .. 1,386
4,418 1,701 1,701 449 .. 2,716
3,569 2,486 2,486 2,006 .. 1,083
1,873 498 498 383 .. 1,375
Principal repayments (long-term) Public and publicly guaranteed sector Public sector of which: General government Private sector guaranteed by public sector Private sector not guaranteed
617 342 342 146 .. 275
1,721 444 444 134 .. 1,277
1,797 485 485 135 .. 1,312
2,024 897 897 127 .. 1,127
1,959 1,073 1,073 131 .. 886
2,139 1,325 1,325 381 .. 814
Interest payments (long-term) Public and publicly guaranteed sector Public sector of which: General government Private sector guaranteed by public sector Private sector not guaranteed
313 213 213 161 .. 100
1,055 601 601 356 .. 454
1,109 638 638 364 .. 471
1,261 687 687 368 .. 574
1,123 674 674 375 .. 448
767 310 310 176 .. 457
5,482 3,822 2,196 1,767 570 430 1,626 1,310 316 1,660 .. 1,660 241
22,797 11,054 3,176 2,751 736 426 7,877 6,251 1,626 11,744 1,850 9,894 210
22,855 11,037 3,230 2,777 788 453 7,807 6,250 1,557 11,817 2,150 9,667 223
24,782 11,941 4,662 4,199 903 464 7,278 6,250 1,028 12,841 2,100 10,741 218
26,829 13,392 4,910 4,443 955 466 8,482 7,600 882 13,437 2,100 11,337 216
26,589 12,570 4,918 4,456 1,021 462 7,652 6,983 670 14,019 2,100 11,919 757
.. 839 590 579 512 11 249 0 249 188
.. 2,270 519 414 135 105 1,751 1,001 750 -49
.. 188 184 171 52 13 3 299 -296 -16
.. 2,394 1,333 1,321 115 12 1,061 -50 1,111 831
.. 1,610 209 208 52 1 1,401 1,350 50 -614
515 -266 2 29 71 -26 -268 -617 349 1,186
1,508 8
1,468 42
2,352 53
2,221 54
2,145 55
1,592 57
64 22 8 30 22 57 36,450
134 45 15 10 11 30 56,365
129 45 15 10 11 28 57,353
129 48 16 12 15 26 59,010
131 49 14 9 15 30 60,212
155 54 15 13 14 23 58,036
Summary external debt data by debtor type
Summary external debt stock by creditor type
Long-term external debt stocks Public and publicly guaranteed debt from: Official creditors Multilateral of which: World Bank Bilateral Private creditors Bondholders Commercial banks and others Private nonguaranteed debt from: Bondholders Commercial banks and others Use of IMF credit
Net financial inflows
Net debt inflows Use of IMF credit Long-term Official creditors Multilateral of which: World Bank Bilateral Private creditors Bondholders Banks and others Short-term Net equity inflows Foreign direct investment Portfolio equity
Debt ratios
External debt stocks to exports (%) External debt stocks to GNI (%) Debt service to exports (%) Short-term to external debt stocks (%) Multilateral to external debt stocks (%) Reserves to external debt stocks (%) Gross national income (GNI)
69
