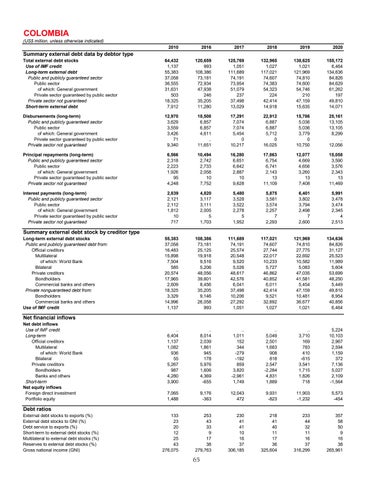
COLOMBIA
(US$ million, unless otherwise indicated) 2010
2016
2017
2018
2019
2020
Total external debt stocks Use of IMF credit Long-term external debt Public and publicly guaranteed sector Public sector of which: General government Private sector guaranteed by public sector Private sector not guaranteed Short-term external debt
64,432 1,137 55,383 37,058 36,555 31,631 503 18,325 7,912
120,659 993 108,386 73,181 72,934 47,938 246 35,205 11,280
125,769 1,051 111,689 74,191 73,954 51,079 237 37,498 13,029
132,965 1,027 117,021 74,607 74,383 54,323 224 42,414 14,918
138,625 1,021 121,969 74,810 74,600 54,746 210 47,159 15,635
155,172 6,464 134,636 84,826 84,629 61,262 197 49,810 14,071
Disbursements (long-term) Public and publicly guaranteed sector Public sector of which: General government Private sector guaranteed by public sector Private sector not guaranteed
12,970 3,629 3,559 3,426 71 9,340
18,508 6,857 6,857 4,611 .. 11,651
17,291 7,074 7,074 5,454 0 10,217
22,912 6,887 6,887 5,712 0 16,025
15,786 5,036 5,036 3,779 0 10,750
25,161 13,105 13,105 8,299 .. 12,056
Principal repayments (long-term) Public and publicly guaranteed sector Public sector of which: General government Private sector guaranteed by public sector Private sector not guaranteed
6,566 2,318 2,223 1,926 95 4,248
10,494 2,742 2,733 2,058 10 7,752
16,280 6,651 6,642 2,887 10 9,628
17,863 6,754 6,741 2,143 13 11,109
12,077 4,669 4,656 3,260 13 7,408
15,058 3,590 3,576 2,343 13 11,469
Interest payments (long-term) Public and publicly guaranteed sector Public sector of which: General government Private sector guaranteed by public sector Private sector not guaranteed
2,839 2,121 2,112 1,812 10 717
4,820 3,117 3,111 2,005 5 1,703
5,480 3,528 3,522 2,278 5 1,952
5,875 3,581 3,574 2,257 7 2,293
6,401 3,802 3,794 2,498 7 2,600
5,991 3,478 3,474 2,345 4 2,513
55,383 37,058 16,483 15,898 7,504 585 20,574 17,965 2,609 18,325 3,329 14,996 1,137
108,386 73,181 25,125 19,918 9,516 5,206 48,056 39,601 8,456 35,205 9,146 26,058 993
111,689 74,191 25,574 20,548 9,520 5,026 48,617 42,576 6,041 37,498 10,206 27,292 1,051
117,021 74,607 27,744 22,017 10,233 5,727 46,862 40,852 6,011 42,414 9,521 32,892 1,027
121,969 74,810 27,775 22,692 10,582 5,083 47,035 41,581 5,454 47,159 10,481 36,677 1,021
134,636 84,826 31,127 25,523 11,989 5,604 53,699 48,250 5,449 49,810 8,954 40,856 6,464
.. 6,404 1,137 1,082 936 55 5,267 987 4,280 3,900
.. 8,014 2,039 1,861 945 178 5,976 1,606 4,369 -655
.. 1,011 152 344 -279 -192 859 3,820 -2,961 1,749
.. 5,049 2,501 1,683 908 818 2,547 -2,284 4,831 1,889
.. 3,710 169 783 410 -615 3,541 1,715 1,826 718
5,224 10,103 2,967 2,594 1,159 372 7,136 5,027 2,109 -1,564
7,065 1,488
9,176 -363
12,043 472
9,931 -823
11,903 -1,232
5,573 -454
133 23 20 12 25 43 276,075
253 43 33 9 17 38 279,763
230 41 41 10 16 37 306,185
218 41 40 11 17 36 325,604
233 44 32 11 16 37 316,299
357 58 50 9 16 38 265,961
Summary external debt data by debtor type
Summary external debt stock by creditor type
Long-term external debt stocks Public and publicly guaranteed debt from: Official creditors Multilateral of which: World Bank Bilateral Private creditors Bondholders Commercial banks and others Private nonguaranteed debt from: Bondholders Commercial banks and others Use of IMF credit
Net financial inflows
Net debt inflows Use of IMF credit Long-term Official creditors Multilateral of which: World Bank Bilateral Private creditors Bondholders Banks and others Short-term Net equity inflows Foreign direct investment Portfolio equity
Debt ratios
External debt stocks to exports (%) External debt stocks to GNI (%) Debt service to exports (%) Short-term to external debt stocks (%) Multilateral to external debt stocks (%) Reserves to external debt stocks (%) Gross national income (GNI)
65
