CHINA
(US$ million, unless otherwise indicated) 2010
2016
2017
2018
2019
2020
Total external debt stocks Use of IMF credit Long-term external debt Public and publicly guaranteed sector Public sector of which: General government Private sector guaranteed by public sector Private sector not guaranteed Short-term external debt
742,756 10,764 219,668 102,293 102,164 59,405 129 117,375 512,323
1,413,804 9,396 603,012 160,192 160,144 99,109 48 442,820 801,396
1,704,516 9,954 663,929 196,294 196,260 101,853 34 467,635 1,030,633
1,961,528 9,721 732,906 259,689 259,669 126,558 20 473,217 1,218,901
2,114,163 9,665 899,185 318,065 318,058 161,780 7 581,120 1,205,312
2,349,389 10,067 1,103,090 414,838 414,838 219,292 0 688,252 1,236,232
Disbursements (long-term) Public and publicly guaranteed sector Public sector of which: General government Private sector guaranteed by public sector Private sector not guaranteed
39,167 12,421 12,421 3,144 .. 26,746
162,013 20,639 20,639 10,264 0 141,374
227,029 51,019 51,019 6,482 0 176,010
247,602 79,731 79,731 29,611 0 167,870
338,243 79,493 79,493 38,598 0 258,750
382,756 116,644 116,644 59,200 0 266,112
Principal repayments (long-term) Public and publicly guaranteed sector Public sector of which: General government Private sector guaranteed by public sector Private sector not guaranteed
18,784 11,980 11,967 3,154 14 6,803
131,319 16,476 16,462 9,951 14 114,844
144,688 15,447 15,433 3,775 14 129,241
160,496 15,293 15,279 4,779 14 145,203
180,605 20,634 20,620 3,376 14 159,972
180,784 24,179 24,172 3,173 7 156,605
Interest payments (long-term) Public and publicly guaranteed sector Public sector of which: General government Private sector guaranteed by public sector Private sector not guaranteed
5,484 1,819 1,817 1,052 1 3,665
11,211 2,035 2,034 754 1 9,175
16,565 3,350 3,349 1,479 1 13,215
27,184 6,135 6,134 2,825 1 21,049
35,730 8,670 8,670 3,387 1 27,059
32,117 9,030 9,030 2,373 0 23,087
219,668 102,293 75,494 35,527 22,135 39,967 26,799 12,398 14,401 117,375 5,561 111,814 10,764
603,012 160,192 59,894 33,430 16,215 26,464 100,298 69,469 30,829 442,820 101,999 340,821 9,396
663,929 196,294 56,215 34,191 16,356 22,025 140,079 101,554 38,524 467,635 152,191 315,443 9,954
732,906 259,689 54,502 34,439 16,095 20,062 205,188 163,960 41,228 473,217 179,902 293,314 9,721
899,185 318,065 53,840 35,427 16,271 18,413 264,225 214,523 49,701 581,120 234,623 346,497 9,665
1,103,090 414,838 53,144 35,639 16,236 17,506 361,693 311,239 50,454 688,252 323,512 364,739 10,067
.. 20,383 -2,277 959 -160 -3,237 22,661 -1,459 24,120 271,814
.. 30,694 -3,814 31 -727 -3,844 34,508 22,273 12,234 -20,848
.. 82,340 -3,653 399 -15 -4,052 85,993 82,189 3,805 229,237
.. 87,106 -1,702 382 -205 -2,083 88,808 94,185 -5,377 188,268
.. 157,638 -698 1,063 205 -1,761 158,336 105,319 53,017 -13,589
.. 201,972 -1,351 -26 -83 -1,325 203,323 184,067 19,256 30,920
225,593 31,110
164,930 23,463
140,569 36,101
185,911 60,411
162,253 45,207
170,022 62,892
41 12 3 69 5 386 6,061,092
58 13 7 57 2 214 11,188,325
63 14 8 60 2 185 12,300,722
67 14 8 62 2 158 13,819,938
73 15 9 57 2 148 14,246,121
79 16 9 53 2 138 14,623,681
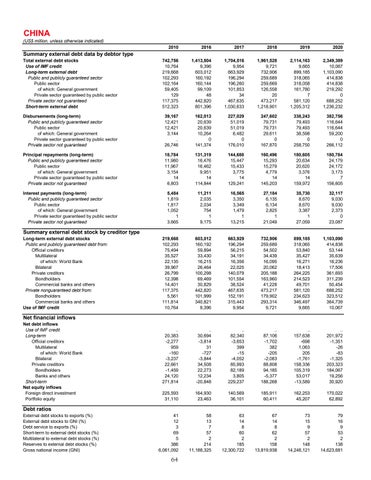
Summary external debt data by debtor type
Summary external debt stock by creditor type
Long-term external debt stocks Public and publicly guaranteed debt from: Official creditors Multilateral of which: World Bank Bilateral Private creditors Bondholders Commercial banks and others Private nonguaranteed debt from: Bondholders Commercial banks and others Use of IMF credit
Net financial inflows
Net debt inflows Use of IMF credit Long-term Official creditors Multilateral of which: World Bank Bilateral Private creditors Bondholders Banks and others Short-term Net equity inflows Foreign direct investment Portfolio equity
Debt ratios
External debt stocks to exports (%) External debt stocks to GNI (%) Debt service to exports (%) Short-term to external debt stocks (%) Multilateral to external debt stocks (%) Reserves to external debt stocks (%) Gross national income (GNI)
64
