BULGARIA
(US$ million, unless otherwise indicated) 2010
2016
2017
2018
2019
2020
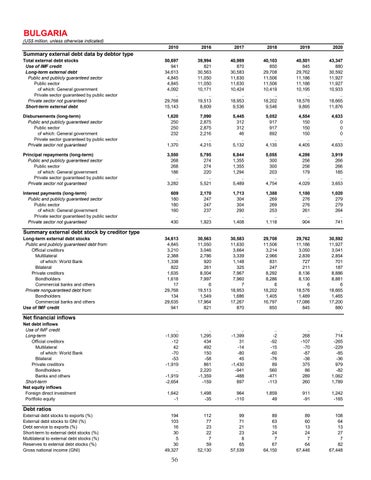
Total external debt stocks Use of IMF credit Long-term external debt Public and publicly guaranteed sector Public sector of which: General government Private sector guaranteed by public sector Private sector not guaranteed Short-term external debt
50,697 941 34,613 4,845 4,845 4,092 .. 29,768 15,143
39,994 821 30,563 11,050 11,050 10,171 .. 19,513 8,609
40,989 870 30,583 11,630 11,630 10,424 .. 18,953 9,536
40,103 850 29,708 11,506 11,506 10,419 .. 18,202 9,546
40,501 845 29,762 11,186 11,186 10,195 .. 18,576 9,895
43,347 880 30,592 11,927 11,927 10,933 .. 18,665 11,876
Disbursements (long-term) Public and publicly guaranteed sector Public sector of which: General government Private sector guaranteed by public sector Private sector not guaranteed
1,620 250 250 232 .. 1,370
7,090 2,875 2,875 2,216 .. 4,215
5,445 312 312 46 .. 5,132
5,052 917 917 892 .. 4,135
4,554 150 150 150 .. 4,405
4,633 0 0 0 .. 4,633
Principal repayments (long-term) Public and publicly guaranteed sector Public sector of which: General government Private sector guaranteed by public sector Private sector not guaranteed
3,550 268 268 186 .. 3,282
5,795 274 274 220 .. 5,521
6,844 1,355 1,355 1,294 .. 5,489
5,055 300 300 203 .. 4,754
4,286 256 256 179 .. 4,029
3,919 266 266 185 .. 3,653
Interest payments (long-term) Public and publicly guaranteed sector Public sector of which: General government Private sector guaranteed by public sector Private sector not guaranteed
609 180 180 160 .. 430
2,170 247 247 237 .. 1,923
1,713 304 304 290 .. 1,408
1,388 269 269 253 .. 1,118
1,180 276 276 261 .. 904
1,020 279 279 264 .. 741
34,613 4,845 3,210 2,388 1,338 822 1,635 1,618 17 29,768 134 29,635 941
30,563 11,050 3,046 2,786 920 261 8,004 7,997 6 19,513 1,549 17,964 821
30,583 11,630 3,664 3,339 1,148 325 7,967 7,960 7 18,953 1,686 17,267 870
29,708 11,506 3,214 2,966 831 247 8,292 8,286 6 18,202 1,405 16,797 850
29,762 11,186 3,050 2,839 727 211 8,136 8,130 6 18,576 1,489 17,086 845
30,592 11,927 3,041 2,854 701 187 8,886 8,881 6 18,665 1,465 17,200 880
.. -1,930 -12 42 -70 -53 -1,919 .. -1,919 -2,654
.. 1,295 434 492 150 -58 861 2,220 -1,359 -159
.. -1,399 31 -14 -80 45 -1,430 -941 -488 897
.. -2 -92 -15 -60 -76 89 560 -471 -113
.. 268 -107 -70 -87 -36 375 86 289 260
.. 714 -265 -229 -85 -36 979 -82 1,062 1,789
1,642 -1
1,498 -35
964 -110
1,859 49
911 -91
1,242 -165
194 103 16 30 5 30 49,327
112 77 23 22 7 59 52,130
99 71 21 23 8 65 57,539
89 63 15 24 7 67 64,150
89 60 13 24 7 64 67,446
108 64 13 27 7 82 67,448
Summary external debt data by debtor type
Summary external debt stock by creditor type
Long-term external debt stocks Public and publicly guaranteed debt from: Official creditors Multilateral of which: World Bank Bilateral Private creditors Bondholders Commercial banks and others Private nonguaranteed debt from: Bondholders Commercial banks and others Use of IMF credit
Net financial inflows
Net debt inflows Use of IMF credit Long-term Official creditors Multilateral of which: World Bank Bilateral Private creditors Bondholders Banks and others Short-term Net equity inflows Foreign direct investment Portfolio equity
Debt ratios
External debt stocks to exports (%) External debt stocks to GNI (%) Debt service to exports (%) Short-term to external debt stocks (%) Multilateral to external debt stocks (%) Reserves to external debt stocks (%) Gross national income (GNI)
56
