BRAZIL
(US$ million, unless otherwise indicated) 2010
2016
2017
2018
2019
2020
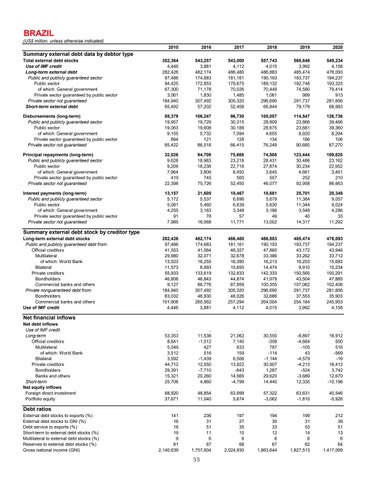
Total external debt stocks Use of IMF credit Long-term external debt Public and publicly guaranteed sector Public sector of which: General government Private sector guaranteed by public sector Private sector not guaranteed Short-term external debt
352,364 4,446 282,426 97,486 94,425 67,300 3,061 184,940 65,492
543,257 3,881 482,174 174,683 172,853 71,178 1,830 307,492 57,202
543,000 4,112 486,480 181,161 179,675 70,026 1,485 305,320 52,408
557,743 4,015 486,883 190,193 189,132 70,449 1,061 296,690 66,844
568,646 3,992 485,474 193,737 192,748 74,580 989 291,737 79,179
549,234 4,158 476,093 194,237 193,325 79,414 913 281,856 68,983
Disbursements (long-term) Public and publicly guaranteed sector Public sector of which: General government Private sector guaranteed by public sector Private sector not guaranteed
85,379 19,957 19,063 9,155 894 65,422
106,247 19,729 19,608 5,732 121 86,518
96,730 30,315 30,188 7,094 128 66,415
105,057 28,809 28,675 4,655 134 76,249
114,547 23,866 23,681 8,920 186 90,680
126,736 39,466 39,360 8,294 106 87,270
Principal repayments (long-term) Public and publicly guaranteed sector Public sector of which: General government Private sector guaranteed by public sector Private sector not guaranteed
32,026 9,628 9,209 7,964 419 22,398
94,709 18,983 18,238 3,809 745 75,726
75,668 23,218 22,718 8,450 500 52,450
74,508 28,431 27,874 3,645 557 46,077
123,444 30,486 30,234 4,661 252 92,958
109,825 23,162 22,952 3,461 210 86,663
Interest payments (long-term) Public and publicly guaranteed sector Public sector of which: General government Private sector guaranteed by public sector Private sector not guaranteed
13,157 5,172 5,081 4,255 91 7,985
21,605 5,537 5,460 3,163 78 16,068
18,467 6,696 6,639 3,348 57 11,771
18,681 5,679 5,630 3,186 49 13,002
25,701 11,384 11,344 3,548 40 14,317
20,348 9,057 9,024 4,286 33 11,292
282,426 97,486 41,553 29,980 13,523 11,573 55,933 46,806 9,127 184,940 83,032 101,908 4,446
482,174 174,683 41,064 32,071 16,255 8,993 133,619 46,843 86,776 307,492 46,930 260,562 3,881
486,480 181,161 48,327 32,678 16,390 15,650 132,833 44,874 87,959 305,320 48,026 257,294 4,112
486,883 190,193 47,860 33,386 16,213 14,474 142,333 41,979 100,355 296,690 32,686 264,004 4,015
485,474 193,737 43,172 33,262 16,253 9,910 150,565 43,504 107,062 291,737 37,553 254,184 3,992
476,093 194,237 43,946 33,712 15,682 10,234 150,291 47,885 102,406 281,856 35,903 245,953 4,158
.. 53,353 8,641 5,049 3,512 3,592 44,712 29,391 15,321 25,706
.. 11,538 -1,012 427 516 -1,439 12,550 -7,710 20,260 4,860
.. 21,062 7,140 633 159 6,506 13,922 -643 14,565 -4,798
.. 30,550 -358 787 -114 -1,144 30,907 1,287 29,620 14,440
.. -8,897 -4,684 -105 43 -4,579 -4,213 -524 -3,689 12,335
.. 16,912 500 516 -569 -16 16,412 3,742 12,670 -10,196
68,920 37,671
48,854 11,040
63,999 5,674
57,322 -3,062
63,631 -1,810
40,546 -5,926
141 16 18 19 9 81 2,140,639
236 31 51 11 6 67 1,757,604
197 27 35 10 6 68 2,024,930
194 30 33 12 6 67 1,863,644
199 31 53 14 6 62 1,827,513
212 39 51 13 6 64 1,417,069
Summary external debt data by debtor type
Summary external debt stock by creditor type
Long-term external debt stocks Public and publicly guaranteed debt from: Official creditors Multilateral of which: World Bank Bilateral Private creditors Bondholders Commercial banks and others Private nonguaranteed debt from: Bondholders Commercial banks and others Use of IMF credit
Net financial inflows
Net debt inflows Use of IMF credit Long-term Official creditors Multilateral of which: World Bank Bilateral Private creditors Bondholders Banks and others Short-term Net equity inflows Foreign direct investment Portfolio equity
Debt ratios
External debt stocks to exports (%) External debt stocks to GNI (%) Debt service to exports (%) Short-term to external debt stocks (%) Multilateral to external debt stocks (%) Reserves to external debt stocks (%) Gross national income (GNI)
55
