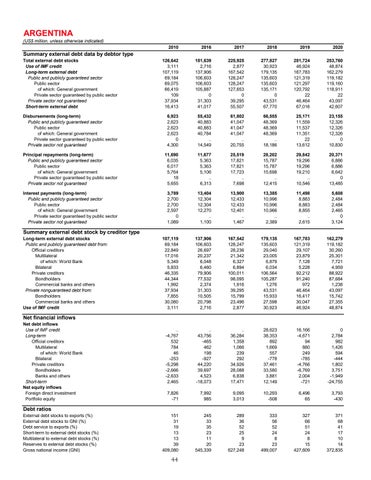
ARGENTINA
(US$ million, unless otherwise indicated) 2010
2016
2017
2018
2019
2020
Total external debt stocks Use of IMF credit Long-term external debt Public and publicly guaranteed sector Public sector of which: General government Private sector guaranteed by public sector Private sector not guaranteed Short-term external debt
126,642 3,111 107,119 69,184 69,075 66,419 109 37,934 16,413
181,639 2,716 137,906 106,603 106,603 105,887 0 31,303 41,017
225,925 2,877 167,542 128,247 128,247 127,653 0 39,295 55,507
277,827 30,923 179,135 135,603 135,603 135,171 0 43,531 67,770
281,724 46,924 167,783 121,319 121,297 120,792 22 46,464 67,016
253,760 48,874 162,279 119,182 119,160 118,911 22 43,097 42,607
Disbursements (long-term) Public and publicly guaranteed sector Public sector of which: General government Private sector guaranteed by public sector Private sector not guaranteed
6,923 2,623 2,623 2,623 0 4,300
55,432 40,883 40,883 40,784 .. 14,549
61,802 41,047 41,047 41,047 .. 20,755
66,555 48,369 48,369 48,369 .. 18,186
25,171 11,559 11,537 11,351 22 13,612
23,155 12,326 12,326 12,326 0 10,830
Principal repayments (long-term) Public and publicly guaranteed sector Public sector of which: General government Private sector guaranteed by public sector Private sector not guaranteed
11,690 6,035 6,017 5,764 18 5,655
11,677 5,363 5,363 5,106 .. 6,313
25,519 17,821 17,821 17,723 .. 7,698
28,202 15,787 15,787 15,698 .. 12,415
29,842 19,296 19,296 19,210 .. 10,546
20,371 6,886 6,886 6,642 0 13,485
Interest payments (long-term) Public and publicly guaranteed sector Public sector of which: General government Private sector guaranteed by public sector Private sector not guaranteed
3,789 2,700 2,700 2,597 0 1,089
13,404 12,304 12,304 12,270 .. 1,100
13,900 12,433 12,433 12,401 .. 1,467
13,385 10,996 10,996 10,966 .. 2,389
11,498 8,883 8,883 8,855 .. 2,615
5,608 2,484 2,484 2,465 0 3,124
107,119 69,184 22,849 17,016 5,349 5,833 46,335 44,344 1,992 37,934 7,855 30,080 3,111
137,906 106,603 26,697 20,237 6,048 6,460 79,906 77,532 2,374 31,303 10,505 20,798 2,716
167,542 128,247 28,236 21,342 6,327 6,894 100,011 98,095 1,916 39,295 15,799 23,496 2,877
179,135 135,603 29,040 23,005 6,879 6,034 106,564 105,287 1,276 43,531 15,933 27,598 30,923
167,783 121,319 29,107 23,879 7,128 5,228 92,212 91,240 972 46,464 16,417 30,047 46,924
162,279 119,182 30,260 25,301 7,721 4,959 88,922 87,684 1,238 43,097 15,742 27,355 48,874
.. -4,767 532 784 46 -253 -5,298 -2,666 -2,633 2,465
.. 43,756 -465 462 198 -927 44,220 39,697 4,523 -18,073
.. 36,284 1,358 1,066 239 292 34,926 28,088 6,838 17,471
28,623 38,353 892 1,669 557 -778 37,461 33,580 3,881 12,149
16,166 -4,671 94 880 249 -785 -4,766 -6,769 2,004 -721
0 2,784 982 1,426 594 -444 1,802 3,751 -1,949 -24,755
7,826 -71
7,992 985
9,095 3,013
10,293 -508
6,496 65
3,793 -430
151 31 19 13 13 39 409,080
245 33 35 23 11 20 545,339
289 36 52 25 9 23 627,248
333 56 52 24 8 23 499,007
327 66 51 24 8 15 427,609
371 68 41 17 10 14 372,835
Summary external debt data by debtor type
Summary external debt stock by creditor type
Long-term external debt stocks Public and publicly guaranteed debt from: Official creditors Multilateral of which: World Bank Bilateral Private creditors Bondholders Commercial banks and others Private nonguaranteed debt from: Bondholders Commercial banks and others Use of IMF credit
Net financial inflows
Net debt inflows Use of IMF credit Long-term Official creditors Multilateral of which: World Bank Bilateral Private creditors Bondholders Banks and others Short-term Net equity inflows Foreign direct investment Portfolio equity
Debt ratios
External debt stocks to exports (%) External debt stocks to GNI (%) Debt service to exports (%) Short-term to external debt stocks (%) Multilateral to external debt stocks (%) Reserves to external debt stocks (%) Gross national income (GNI)
44
