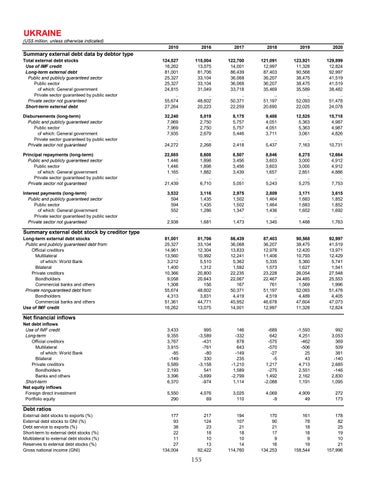
UKRAINE
(US$ million, unless otherwise indicated) 2010
2016
2017
2018
2019
2020
Total external debt stocks Use of IMF credit Long-term external debt Public and publicly guaranteed sector Public sector of which: General government Private sector guaranteed by public sector Private sector not guaranteed Short-term external debt
124,527 16,262 81,001 25,327 25,327 24,815 .. 55,674 27,264
115,004 13,075 81,706 33,104 33,104 31,049 .. 48,602 20,223
122,700 14,001 86,439 36,068 36,068 33,718 .. 50,371 22,259
121,091 12,997 87,403 36,207 36,207 35,469 .. 51,197 20,690
123,921 11,328 90,568 38,475 38,475 35,589 .. 52,093 22,025
129,899 12,824 92,997 41,519 41,519 38,482 .. 51,478 24,078
Disbursements (long-term) Public and publicly guaranteed sector Public sector of which: General government Private sector guaranteed by public sector Private sector not guaranteed
32,240 7,969 7,969 7,935 .. 24,272
5,019 2,750 2,750 2,679 .. 2,268
8,175 5,757 5,757 5,446 .. 2,418
9,488 4,051 4,051 3,711 .. 5,437
12,525 5,363 5,363 3,061 .. 7,163
15,718 4,987 4,987 4,826 .. 10,731
Principal repayments (long-term) Public and publicly guaranteed sector Public sector of which: General government Private sector guaranteed by public sector Private sector not guaranteed
22,885 1,446 1,446 1,165 .. 21,439
8,608 1,898 1,898 1,882 .. 6,710
8,507 3,456 3,456 3,439 .. 5,051
8,846 3,603 3,603 1,657 .. 5,243
8,275 3,000 3,000 2,851 .. 5,275
12,664 4,912 4,912 4,886 .. 7,753
Interest payments (long-term) Public and publicly guaranteed sector Public sector of which: General government Private sector guaranteed by public sector Private sector not guaranteed
3,532 594 594 552 .. 2,938
3,116 1,435 1,435 1,286 .. 1,681
2,975 1,502 1,502 1,347 .. 1,473
2,809 1,464 1,464 1,436 .. 1,345
3,171 1,683 1,683 1,652 .. 1,488
3,615 1,852 1,852 1,692 .. 1,763
81,001 25,327 14,961 13,560 3,212 1,400 10,366 9,058 1,308 55,674 4,313 51,361 16,262
81,706 33,104 12,304 10,992 5,510 1,312 20,800 20,643 156 48,602 3,831 44,771 13,075
86,439 36,068 13,833 12,241 5,362 1,592 22,235 22,067 167 50,371 4,419 45,952 14,001
87,403 36,207 12,978 11,406 5,335 1,573 23,228 22,467 761 51,197 4,519 46,678 12,997
90,568 38,475 12,420 10,793 5,360 1,627 26,054 24,485 1,569 52,093 4,489 47,604 11,328
92,997 41,519 13,971 12,429 5,741 1,541 27,548 25,553 1,996 51,478 4,405 47,073 12,824
3,433 9,355 3,767 3,915 -85 -149 5,589 2,193 3,396 6,370
995 -3,589 -431 -761 -80 330 -3,158 541 -3,699 -974
146 -332 878 643 -149 235 -1,210 1,589 -2,799 1,114
-689 642 -575 -570 -27 -5 1,217 -275 1,492 -2,088
-1,593 4,251 -462 -506 25 43 4,713 2,551 2,162 1,191
992 3,053 369 509 381 -140 2,685 -146 2,830 1,095
5,550 290
4,076 69
3,025 110
4,069 -9
4,909 49
272 173
177 93 38 22 11 27 134,004
217 124 23 18 10 13 92,422
194 107 21 18 10 14 114,760
170 90 21 17 9 16 134,253
161 78 18 18 9 19 158,544
178 82 25 19 10 21 157,996
Summary external debt data by debtor type
Summary external debt stock by creditor type
Long-term external debt stocks Public and publicly guaranteed debt from: Official creditors Multilateral of which: World Bank Bilateral Private creditors Bondholders Commercial banks and others Private nonguaranteed debt from: Bondholders Commercial banks and others Use of IMF credit
Net financial inflows
Net debt inflows Use of IMF credit Long-term Official creditors Multilateral of which: World Bank Bilateral Private creditors Bondholders Banks and others Short-term Net equity inflows Foreign direct investment Portfolio equity
Debt ratios
External debt stocks to exports (%) External debt stocks to GNI (%) Debt service to exports (%) Short-term to external debt stocks (%) Multilateral to external debt stocks (%) Reserves to external debt stocks (%) Gross national income (GNI)
155
