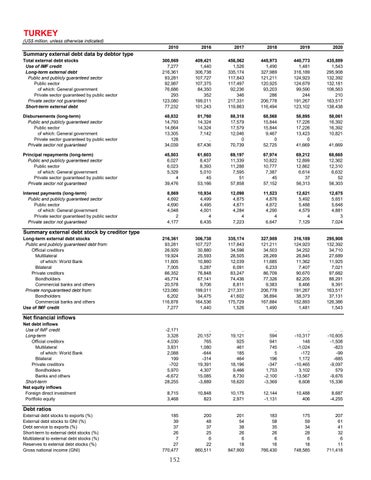
TURKEY
(US$ million, unless otherwise indicated) 2010
2016
2017
2018
2019
2020
Total external debt stocks Use of IMF credit Long-term external debt Public and publicly guaranteed sector Public sector of which: General government Private sector guaranteed by public sector Private sector not guaranteed Short-term external debt
300,869 7,277 216,361 93,281 92,987 76,686 293 123,080 77,232
409,421 1,440 306,738 107,727 107,375 84,350 352 199,011 101,243
456,562 1,526 335,174 117,843 117,497 92,236 346 217,331 119,863
445,973 1,490 327,989 121,211 120,925 93,203 286 206,778 116,494
440,773 1,481 316,189 124,923 124,679 99,590 244 191,267 123,102
435,889 1,543 295,908 132,392 132,181 106,563 210 163,517 138,438
Disbursements (long-term) Public and publicly guaranteed sector Public sector of which: General government Private sector guaranteed by public sector Private sector not guaranteed
48,832 14,793 14,664 13,305 128 34,039
81,760 14,324 14,324 7,142 .. 67,436
88,318 17,579 17,579 12,046 0 70,739
68,568 15,844 15,844 9,467 0 52,725
58,895 17,226 17,226 13,423 0 41,669
58,061 16,392 16,392 10,821 .. 41,669
Principal repayments (long-term) Public and publicly guaranteed sector Public sector of which: General government Private sector guaranteed by public sector Private sector not guaranteed
45,503 6,027 6,023 5,329 4 39,476
61,603 8,437 8,393 5,010 45 53,166
69,197 11,339 11,288 7,595 51 57,858
67,974 10,822 10,777 7,387 45 57,152
69,212 12,899 12,862 6,614 37 56,313
68,665 12,362 12,310 6,632 52 56,303
Interest payments (long-term) Public and publicly guaranteed sector Public sector of which: General government Private sector guaranteed by public sector Private sector not guaranteed
8,869 4,692 4,690 4,048 2 4,177
10,934 4,499 4,495 4,001 4 6,435
12,098 4,875 4,871 4,284 4 7,223
11,523 4,876 4,872 4,290 4 6,647
12,621 5,492 5,488 4,579 4 7,129
12,675 5,651 5,648 4,881 3 7,024
216,361 93,281 26,929 19,924 11,605 7,005 66,352 45,774 20,578 123,080 6,202 116,878 7,277
306,738 107,727 30,880 25,593 10,860 5,287 76,848 67,141 9,706 199,011 34,475 164,536 1,440
335,174 117,843 34,596 28,505 12,039 6,091 83,247 74,436 8,811 217,331 41,602 175,729 1,526
327,989 121,211 34,503 28,269 11,685 6,233 86,709 77,326 9,383 206,778 38,894 167,884 1,490
316,189 124,923 34,252 26,845 11,362 7,407 90,670 82,205 8,466 191,267 38,373 152,893 1,481
295,908 132,392 34,710 27,689 11,925 7,021 97,682 88,291 9,391 163,517 37,131 126,386 1,543
-2,171 3,328 4,030 3,831 2,088 199 -702 5,970 -6,672 28,255
.. 20,157 765 1,080 -644 -314 19,391 4,307 15,085 -3,889
.. 19,121 925 461 185 464 18,196 9,466 8,730 18,620
.. 594 941 745 5 196 -347 1,753 -2,100 -3,369
.. -10,317 148 -1,024 -172 1,172 -10,465 3,102 -13,567 6,608
.. -10,605 -1,508 -823 -99 -685 -9,097 579 -9,676 15,336
8,715 3,468
10,848 823
10,175 2,971
12,144 -1,131
10,488 406
8,687 -4,255
185 39 37 26 7 27 770,477
200 48 37 25 6 22 860,511
201 54 38 26 6 18 847,900
183 58 35 26 6 16 766,430
175 59 34 28 6 18 748,585
207 61 41 32 6 11 711,418
Summary external debt data by debtor type
Summary external debt stock by creditor type
Long-term external debt stocks Public and publicly guaranteed debt from: Official creditors Multilateral of which: World Bank Bilateral Private creditors Bondholders Commercial banks and others Private nonguaranteed debt from: Bondholders Commercial banks and others Use of IMF credit
Net financial inflows
Net debt inflows Use of IMF credit Long-term Official creditors Multilateral of which: World Bank Bilateral Private creditors Bondholders Banks and others Short-term Net equity inflows Foreign direct investment Portfolio equity
Debt ratios
External debt stocks to exports (%) External debt stocks to GNI (%) Debt service to exports (%) Short-term to external debt stocks (%) Multilateral to external debt stocks (%) Reserves to external debt stocks (%) Gross national income (GNI)
152
