SRI LANKA
(US$ million, unless otherwise indicated) 2010
2016
2017
2018
2019
2020
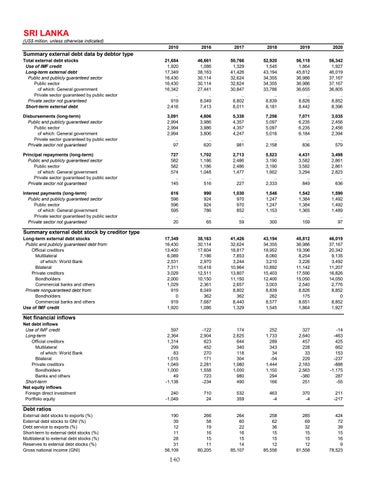
Total external debt stocks Use of IMF credit Long-term external debt Public and publicly guaranteed sector Public sector of which: General government Private sector guaranteed by public sector Private sector not guaranteed Short-term external debt
21,684 1,920 17,349 16,430 16,430 16,342 .. 919 2,416
46,661 1,086 38,163 30,114 30,114 27,441 .. 8,049 7,413
50,766 1,329 41,426 32,624 32,624 30,847 .. 8,802 8,011
52,920 1,545 43,194 34,355 34,355 33,786 .. 8,839 8,181
56,118 1,864 45,812 36,986 36,986 36,655 .. 8,826 8,442
56,342 1,927 46,019 37,167 37,167 36,805 .. 8,852 8,396
Disbursements (long-term) Public and publicly guaranteed sector Public sector of which: General government Private sector guaranteed by public sector Private sector not guaranteed
3,091 2,994 2,994 2,994 .. 97
4,606 3,986 3,986 3,806 .. 620
5,338 4,357 4,357 4,247 .. 981
7,256 5,097 5,097 5,016 .. 2,158
7,071 6,235 6,235 6,184 .. 836
3,035 2,456 2,456 2,394 .. 579
Principal repayments (long-term) Public and publicly guaranteed sector Public sector of which: General government Private sector guaranteed by public sector Private sector not guaranteed
727 582 582 574 .. 145
1,702 1,186 1,186 1,048 .. 516
2,713 2,486 2,486 1,477 .. 227
5,523 3,190 3,190 1,902 .. 2,333
4,431 3,582 3,582 3,294 .. 849
3,498 2,861 2,861 2,823 .. 636
Interest payments (long-term) Public and publicly guaranteed sector Public sector of which: General government Private sector guaranteed by public sector Private sector not guaranteed
616 596 596 595 .. 20
990 924 924 786 .. 65
1,030 970 970 852 .. 59
1,546 1,247 1,247 1,153 .. 300
1,542 1,384 1,384 1,365 .. 159
1,590 1,492 1,492 1,489 .. 97
17,349 16,430 13,400 6,089 2,531 7,311 3,029 2,000 1,029 919 0 919 1,920
38,163 30,114 17,604 7,186 2,970 10,418 12,511 10,150 2,361 8,049 362 7,687 1,086
41,426 32,624 18,817 7,853 3,244 10,964 13,807 11,150 2,657 8,802 362 8,440 1,329
43,194 34,355 18,952 8,060 3,210 10,892 15,403 12,400 3,003 8,839 262 8,577 1,545
45,812 36,986 19,396 8,254 3,226 11,142 17,590 15,050 2,540 8,826 175 8,651 1,864
46,019 37,167 20,342 9,135 3,492 11,207 16,826 14,050 2,776 8,852 0 8,852 1,927
597 2,364 1,314 299 83 1,015 1,049 1,000 49 -1,138
-122 2,904 623 452 270 171 2,281 1,558 723 -234
174 2,625 644 340 118 304 1,980 1,000 980 490
252 1,733 289 343 34 -54 1,444 1,150 294 166
327 2,640 457 228 33 229 2,183 2,563 -380 251
-14 -463 425 662 153 -237 -888 -1,175 287 -55
240 -1,049
710 24
532 359
463 -4
370 -4
211 -217
190 39 12 11 28 31 56,109
266 58 19 16 15 11 80,205
264 60 22 16 15 14 85,107
258 62 36 15 15 12 85,556
285 69 32 15 15 12 81,558
424 72 39 15 16 9 78,523
Summary external debt data by debtor type
Summary external debt stock by creditor type
Long-term external debt stocks Public and publicly guaranteed debt from: Official creditors Multilateral of which: World Bank Bilateral Private creditors Bondholders Commercial banks and others Private nonguaranteed debt from: Bondholders Commercial banks and others Use of IMF credit
Net financial inflows
Net debt inflows Use of IMF credit Long-term Official creditors Multilateral of which: World Bank Bilateral Private creditors Bondholders Banks and others Short-term Net equity inflows Foreign direct investment Portfolio equity
Debt ratios
External debt stocks to exports (%) External debt stocks to GNI (%) Debt service to exports (%) Short-term to external debt stocks (%) Multilateral to external debt stocks (%) Reserves to external debt stocks (%) Gross national income (GNI)
140

