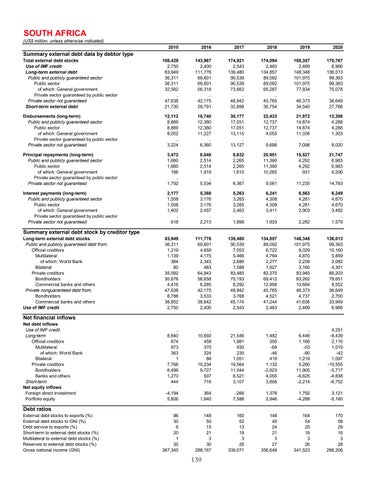
SOUTH AFRICA
(US$ million, unless otherwise indicated) 2010
2016
2017
2018
2019
2020
Total external debt stocks Use of IMF credit Long-term external debt Public and publicly guaranteed sector Public sector of which: General government Private sector guaranteed by public sector Private sector not guaranteed Short-term external debt
108,429 2,750 83,949 36,311 36,311 32,582 .. 47,638 21,730
143,967 2,400 111,776 69,601 69,601 56,318 .. 42,175 29,791
174,921 2,543 139,480 90,539 90,539 73,662 .. 48,942 32,898
174,094 2,483 134,857 89,092 89,092 65,287 .. 45,765 36,754
185,357 2,469 148,348 101,975 101,975 77,834 .. 46,373 34,540
170,767 6,966 136,013 99,363 99,363 75,078 .. 36,649 27,788
Disbursements (long-term) Public and publicly guaranteed sector Public sector of which: General government Private sector guaranteed by public sector Private sector not guaranteed
12,112 8,889 8,889 8,052 .. 3,224
18,740 12,380 12,380 11,227 .. 6,360
30,177 17,051 17,051 13,115 .. 13,127
22,433 12,737 12,737 4,055 .. 9,696
21,972 14,874 14,874 11,336 .. 7,098
13,308 4,288 4,288 1,303 .. 9,020
Principal repayments (long-term) Public and publicly guaranteed sector Public sector of which: General government Private sector guaranteed by public sector Private sector not guaranteed
3,473 1,680 1,680 186 .. 1,792
8,048 2,514 2,514 1,919 .. 5,534
8,632 2,265 2,265 1,610 .. 6,367
20,951 11,390 11,390 10,265 .. 9,561
15,527 4,292 4,292 931 .. 11,235
21,747 6,983 6,983 4,206 .. 14,763
Interest payments (long-term) Public and publicly guaranteed sector Public sector of which: General government Private sector guaranteed by public sector Private sector not guaranteed
2,177 1,558 1,558 1,402 .. 618
5,388 3,176 3,176 2,457 .. 2,213
5,263 3,265 3,265 2,463 .. 1,998
6,241 4,308 4,308 3,411 .. 1,933
6,563 4,281 4,281 2,903 .. 2,282
6,249 4,670 4,670 3,482 .. 1,579
83,949 36,311 1,219 1,139 384 80 35,092 30,676 4,416 47,638 8,786 38,852 2,750
111,776 69,601 4,659 4,175 2,343 483 64,943 58,658 6,285 42,175 3,533 38,642 2,400
139,480 90,539 7,053 5,466 2,686 1,588 83,485 75,193 8,292 48,942 3,768 45,174 2,543
134,857 89,092 6,722 4,794 2,277 1,927 82,370 69,412 12,958 45,765 4,521 41,244 2,483
148,348 101,975 8,029 4,870 2,239 3,160 93,945 83,262 10,684 46,373 4,737 41,636 2,469
136,013 99,363 10,160 5,859 2,082 4,301 89,203 79,651 9,552 36,649 2,700 33,949 6,966
.. 8,640 874 873 363 1 7,766 6,496 1,270 444
.. 10,692 458 370 324 88 10,234 9,727 507 716
.. 21,546 1,981 930 230 1,051 19,564 11,044 8,521 3,107
.. 1,482 350 -69 -46 419 1,132 -2,923 4,055 3,856
.. 6,446 1,166 -53 -90 1,219 5,280 11,905 -6,625 -2,214
4,251 -8,439 2,116 1,019 -42 1,097 -10,555 -5,717 -4,838 -6,752
-4,194 5,826
364 1,640
-266 7,588
1,378 2,946
1,792 -4,289
3,121 -5,160
96 30 6 20 1 35 367,345
148 50 15 21 3 30 288,167
160 52 13 19 3 26 339,071
148 49 24 21 3 27 356,649
164 54 20 19 3 26 341,523
170 58 29 16 3 28 296,206
Summary external debt data by debtor type
Summary external debt stock by creditor type
Long-term external debt stocks Public and publicly guaranteed debt from: Official creditors Multilateral of which: World Bank Bilateral Private creditors Bondholders Commercial banks and others Private nonguaranteed debt from: Bondholders Commercial banks and others Use of IMF credit
Net financial inflows
Net debt inflows Use of IMF credit Long-term Official creditors Multilateral of which: World Bank Bilateral Private creditors Bondholders Banks and others Short-term Net equity inflows Foreign direct investment Portfolio equity
Debt ratios
External debt stocks to exports (%) External debt stocks to GNI (%) Debt service to exports (%) Short-term to external debt stocks (%) Multilateral to external debt stocks (%) Reserves to external debt stocks (%) Gross national income (GNI)
139
