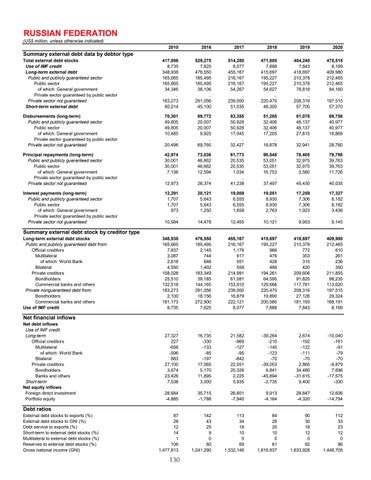
RUSSIAN FEDERATION
(US$ million, unless otherwise indicated)
2010
2016
2017
2018
2019
2020
Total external debt stocks Use of IMF credit Long-term external debt Public and publicly guaranteed sector Public sector of which: General government Private sector guaranteed by public sector Private sector not guaranteed Short-term external debt
417,886 8,735 348,938 165,665 165,665 34,346 .. 183,273 60,214
529,275 7,625 476,550 185,495 185,495 38,106 .. 291,056 45,100
514,280 8,077 455,167 216,167 216,167 54,267 .. 239,000 51,035
471,885 7,888 415,697 195,227 195,227 54,627 .. 220,470 48,300
484,240 7,843 418,697 210,378 210,378 78,818 .. 208,319 57,700
475,518 8,169 409,980 212,465 212,465 84,160 .. 197,515 57,370
Disbursements (long-term) Public and publicly guaranteed sector Public sector of which: General government Private sector guaranteed by public sector Private sector not guaranteed
70,301 49,805 49,805 10,485 .. 20,496
89,772 20,007 20,007 9,925 .. 69,765
83,355 50,928 50,928 17,045 .. 32,427
51,285 32,406 32,406 17,205 .. 18,878
81,078 48,137 48,137 27,815 .. 32,941
69,758 40,977 40,977 16,869 .. 28,780
Principal repayments (long-term) Public and publicly guaranteed sector Public sector of which: General government Private sector guaranteed by public sector Private sector not guaranteed
42,974 30,001 30,001 7,136 .. 12,973
73,036 46,662 46,662 12,594 .. 26,374
61,773 20,535 20,535 1,034 .. 41,238
90,548 53,051 53,051 16,753 .. 37,497
78,405 32,975 32,975 3,580 .. 45,430
79,798 39,763 39,763 11,726 .. 40,035
Interest payments (long-term) Public and publicly guaranteed sector Public sector of which: General government Private sector guaranteed by public sector Private sector not guaranteed
12,291 1,707 1,707 873 .. 10,584
20,121 5,643 5,643 1,250 .. 14,478
19,009 6,555 6,555 1,658 .. 12,455
19,051 8,930 8,930 2,763 .. 10,121
17,259 7,306 7,306 1,923 .. 9,953
17,327 8,182 8,182 3,436 .. 9,145
348,938 165,665 7,637 3,087 2,618 4,550 158,028 25,510 132,518 183,273 2,100 181,173 8,735
476,550 185,495 2,145 744 646 1,402 183,349 39,185 144,165 291,056 18,156 272,900 7,625
455,167 216,167 1,176 617 551 559 214,991 61,081 153,910 239,000 16,879 222,121 8,077
415,697 195,227 966 476 428 489 194,261 64,595 129,666 220,470 19,890 200,580 7,888
418,697 210,378 772 353 315 420 209,606 91,825 117,781 208,319 27,126 181,193 7,843
409,980 212,465 610 261 236 350 211,855 98,235 113,620 197,515 29,324 168,191 8,169
.. 27,327 227 -656 -596 883 27,100 3,674 23,426 7,538
.. 16,735 -330 -133 -85 -197 17,065 5,170 11,895 3,000
.. 21,582 -969 -127 -95 -842 22,551 20,326 2,225 5,935
.. -39,264 -210 -140 -123 -70 -39,053 6,841 -45,894 -2,735
.. 2,674 -192 -122 -111 -70 2,865 34,480 -31,615 9,400
.. -10,040 -161 -91 -79 -70 -9,879 7,696 -17,575 -330
28,684 -4,885
35,715 -1,788
26,601 -7,940
9,913 -4,164
28,847 -4,320
12,606 -14,794
87 28 12 14 1 106 1,477,813
142 43 25 9 0 60 1,241,290
113 34 18 10 0 69 1,532,146
84 29 20 10 0 81 1,616,937
90 30 18 12 0 92 1,633,928
112 33 23 12 0 96 1,448,705
Summary external debt data by debtor type
Summary external debt stock by creditor type
Long-term external debt stocks Public and publicly guaranteed debt from: Official creditors Multilateral of which: World Bank Bilateral Private creditors Bondholders Commercial banks and others Private nonguaranteed debt from: Bondholders Commercial banks and others Use of IMF credit
Net financial inflows
Net debt inflows Use of IMF credit Long-term Official creditors Multilateral of which: World Bank Bilateral Private creditors Bondholders Banks and others Short-term Net equity inflows Foreign direct investment Portfolio equity
Debt ratios
External debt stocks to exports (%) External debt stocks to GNI (%) Debt service to exports (%) Short-term to external debt stocks (%) Multilateral to external debt stocks (%) Reserves to external debt stocks (%) Gross national income (GNI)
130
