ROMANIA
(US$ million, unless otherwise indicated) 2010
2016
2017
2018
2019
2020
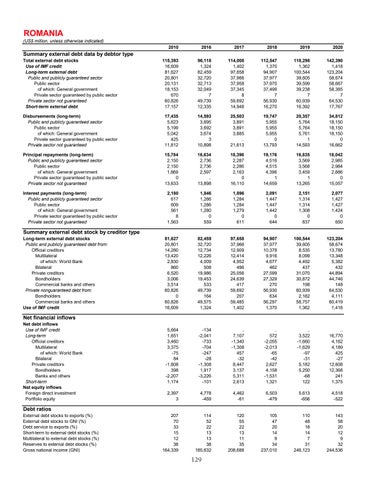
Total external debt stocks Use of IMF credit Long-term external debt Public and publicly guaranteed sector Public sector of which: General government Private sector guaranteed by public sector Private sector not guaranteed Short-term external debt
115,393 16,609 81,627 20,801 20,131 18,153 670 60,826 17,157
96,118 1,324 82,459 32,720 32,713 32,049 7 49,739 12,335
114,008 1,402 97,658 37,966 37,958 37,345 8 59,692 14,948
112,547 1,370 94,907 37,977 37,970 37,499 7 56,930 16,270
118,298 1,362 100,544 39,605 39,599 39,238 7 60,939 16,392
142,390 1,418 123,204 58,674 58,667 58,385 7 64,530 17,767
Disbursements (long-term) Public and publicly guaranteed sector Public sector of which: General government Private sector guaranteed by public sector Private sector not guaranteed
17,435 5,623 5,199 5,042 425 11,812
14,593 3,695 3,692 3,674 3 10,898
25,503 3,891 3,891 3,885 .. 21,613
19,747 5,955 5,955 5,955 0 13,793
20,357 5,764 5,764 5,761 1 14,593
34,812 18,150 18,150 18,150 0 16,662
Principal repayments (long-term) Public and publicly guaranteed sector Public sector of which: General government Private sector guaranteed by public sector Private sector not guaranteed
15,784 2,150 2,150 1,869 0 13,633
16,634 2,736 2,736 2,597 .. 13,898
18,396 2,287 2,286 2,163 0 16,110
19,176 4,516 4,515 4,396 1 14,659
16,835 3,569 3,568 3,459 1 13,265
18,042 2,985 2,984 2,886 0 15,057
Interest payments (long-term) Public and publicly guaranteed sector Public sector of which: General government Private sector guaranteed by public sector Private sector not guaranteed
2,180 617 609 561 8 1,563
1,846 1,286 1,286 1,280 0 559
1,896 1,284 1,284 1,279 0 611
2,091 1,447 1,447 1,442 0 644
2,151 1,314 1,314 1,308 0 837
2,077 1,427 1,427 1,424 0 650
81,627 20,801 14,280 13,420 2,830 860 6,520 3,006 3,514 60,826 0 60,826 16,609
82,459 32,720 12,734 12,226 4,009 508 19,986 19,453 533 49,739 164 49,575 1,324
97,658 37,966 12,909 12,414 4,952 496 25,056 24,639 417 59,692 207 59,485 1,402
94,907 37,977 10,378 9,916 4,677 462 27,599 27,329 270 56,930 634 56,297 1,370
100,544 39,605 8,535 8,099 4,492 437 31,070 30,872 198 60,939 2,182 58,757 1,362
123,204 58,674 13,780 13,348 5,382 432 44,894 44,746 148 64,530 4,111 60,419 1,418
5,664 1,651 3,460 3,375 -75 84 -1,808 398 -2,207 1,174
-134 -2,041 -733 -704 -247 -28 -1,308 1,917 -3,226 -101
.. 7,107 -1,340 -1,308 457 -32 8,447 3,137 5,311 2,613
.. 572 -2,055 -2,013 -65 -42 2,627 4,158 -1,531 1,321
.. 3,522 -1,660 -1,629 -97 -31 5,182 5,250 -68 122
.. 16,770 4,162 4,189 425 -27 12,608 12,368 241 1,375
2,397 3
4,778 -459
4,462 -61
6,503 -479
5,613 -656
4,518 -522
207 70 33 15 12 38 164,339
114 52 22 13 13 38 185,632
120 55 22 13 11 35 208,688
105 47 20 14 9 34 237,010
110 48 18 14 7 31 246,123
143 58 20 12 9 32 244,536
Summary external debt data by debtor type
Summary external debt stock by creditor type
Long-term external debt stocks Public and publicly guaranteed debt from: Official creditors Multilateral of which: World Bank Bilateral Private creditors Bondholders Commercial banks and others Private nonguaranteed debt from: Bondholders Commercial banks and others Use of IMF credit
Net financial inflows
Net debt inflows Use of IMF credit Long-term Official creditors Multilateral of which: World Bank Bilateral Private creditors Bondholders Banks and others Short-term Net equity inflows Foreign direct investment Portfolio equity
Debt ratios
External debt stocks to exports (%) External debt stocks to GNI (%) Debt service to exports (%) Short-term to external debt stocks (%) Multilateral to external debt stocks (%) Reserves to external debt stocks (%) Gross national income (GNI)
129

