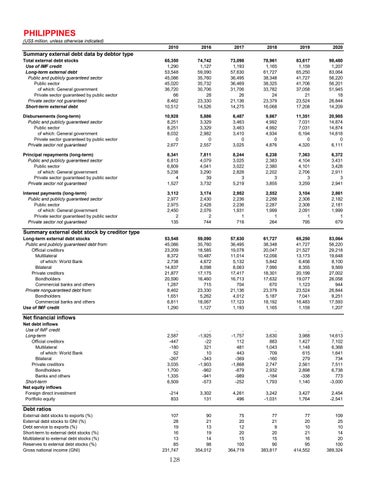
PHILIPPINES
(US$ million, unless otherwise indicated) 2010
2016
2017
2018
2019
2020
Total external debt stocks Use of IMF credit Long-term external debt Public and publicly guaranteed sector Public sector of which: General government Private sector guaranteed by public sector Private sector not guaranteed Short-term external debt
65,350 1,290 53,548 45,086 45,020 36,720 66 8,462 10,512
74,742 1,127 59,090 35,760 35,732 30,706 28 23,330 14,526
73,098 1,193 57,630 36,495 36,469 31,706 26 21,136 14,275
78,961 1,165 61,727 38,348 38,325 33,782 24 23,379 16,068
83,617 1,159 65,250 41,727 41,706 37,058 21 23,524 17,208
98,480 1,207 83,064 56,220 56,201 51,945 18 26,844 14,209
Disbursements (long-term) Public and publicly guaranteed sector Public sector of which: General government Private sector guaranteed by public sector Private sector not guaranteed
10,928 8,251 8,251 8,032 0 2,677
5,886 3,329 3,329 2,982 0 2,557
6,487 3,463 3,463 3,410 0 3,025
9,867 4,992 4,992 4,934 0 4,876
11,351 7,031 7,031 6,194 0 4,320
20,985 14,874 14,874 14,818 0 6,111
Principal repayments (long-term) Public and publicly guaranteed sector Public sector of which: General government Private sector guaranteed by public sector Private sector not guaranteed
8,341 6,813 6,809 5,238 4 1,527
7,811 4,079 4,041 3,290 39 3,732
8,244 3,025 3,022 2,828 3 5,219
6,238 2,383 2,380 2,202 3 3,855
7,363 4,104 4,101 2,706 3 3,259
6,372 3,431 3,428 2,911 3 2,941
Interest payments (long-term) Public and publicly guaranteed sector Public sector of which: General government Private sector guaranteed by public sector Private sector not guaranteed
3,112 2,977 2,975 2,450 2 135
3,174 2,430 2,428 2,076 2 744
2,952 2,236 2,236 1,931 1 716
2,552 2,288 2,287 1,999 1 264
3,104 2,308 2,308 2,091 1 795
2,861 2,182 2,181 1,999 1 679
53,548 45,086 23,209 8,372 2,738 14,837 21,877 20,590 1,287 8,462 1,651 6,811 1,290
59,090 35,760 18,585 10,487 4,672 8,098 17,175 16,460 715 23,330 5,262 18,067 1,127
57,630 36,495 19,078 11,014 5,132 8,063 17,417 16,713 704 21,136 4,012 17,123 1,193
61,727 38,348 20,047 12,056 5,842 7,990 18,301 17,632 670 23,379 5,187 18,192 1,165
65,250 41,727 21,527 13,173 6,456 8,355 20,199 19,077 1,123 23,524 7,041 16,483 1,159
83,064 56,220 29,218 19,648 8,100 9,569 27,002 26,058 944 26,844 9,251 17,593 1,207
.. 2,587 -447 -180 52 -267 3,035 1,700 1,335 6,509
.. -1,925 -22 321 10 -343 -1,903 -962 -941 -573
.. -1,757 112 481 443 -369 -1,868 -879 -989 -252
.. 3,630 883 1,043 709 -160 2,747 2,932 -184 1,793
.. 3,988 1,427 1,148 615 279 2,561 2,898 -338 1,140
.. 14,613 7,102 6,368 1,641 734 7,511 6,738 773 -3,000
-214 833
3,302 131
4,261 496
3,242 -1,031
3,427 1,764
2,454 -2,541
107 28 19 16 13 85 231,747
90 21 13 19 14 98 354,012
75 20 12 20 15 100 364,719
77 21 9 20 15 90 383,817
77 20 10 21 16 95 414,552
109 25 10 14 20 100 389,324
Summary external debt data by debtor type
Summary external debt stock by creditor type
Long-term external debt stocks Public and publicly guaranteed debt from: Official creditors Multilateral of which: World Bank Bilateral Private creditors Bondholders Commercial banks and others Private nonguaranteed debt from: Bondholders Commercial banks and others Use of IMF credit
Net financial inflows
Net debt inflows Use of IMF credit Long-term Official creditors Multilateral of which: World Bank Bilateral Private creditors Bondholders Banks and others Short-term Net equity inflows Foreign direct investment Portfolio equity
Debt ratios
External debt stocks to exports (%) External debt stocks to GNI (%) Debt service to exports (%) Short-term to external debt stocks (%) Multilateral to external debt stocks (%) Reserves to external debt stocks (%) Gross national income (GNI)
128
