PAPUA NEW GUINEA
(US$ million, unless otherwise indicated)
2010
2016
2017
2018
2019
2020
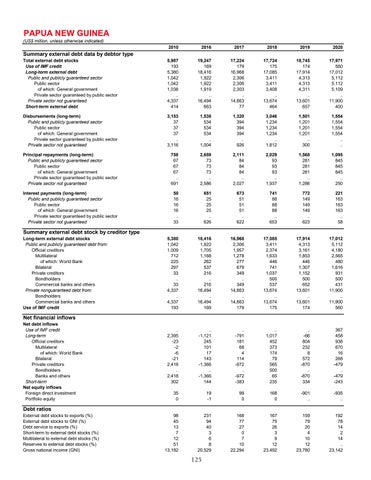
Total external debt stocks Use of IMF credit Long-term external debt Public and publicly guaranteed sector Public sector of which: General government Private sector guaranteed by public sector Private sector not guaranteed Short-term external debt
5,987 193 5,380 1,042 1,042 1,038 .. 4,337 414
19,247 169 18,416 1,922 1,922 1,919 .. 16,494 663
17,224 179 16,968 2,306 2,306 2,303 .. 14,663 77
17,724 175 17,085 3,411 3,411 3,408 .. 13,674 464
18,745 174 17,914 4,313 4,313 4,311 .. 13,601 657
17,971 560 17,012 5,112 5,112 5,109 .. 11,900 400
Disbursements (long-term) Public and publicly guaranteed sector Public sector of which: General government Private sector guaranteed by public sector Private sector not guaranteed
3,153 37 37 37 .. 3,116
1,538 534 534 534 .. 1,004
1,320 394 394 394 .. 926
3,046 1,234 1,234 1,234 .. 1,812
1,501 1,201 1,201 1,201 .. 300
1,554 1,554 1,554 1,554 .. ..
Principal repayments (long-term) Public and publicly guaranteed sector Public sector of which: General government Private sector guaranteed by public sector Private sector not guaranteed
758 67 67 67 .. 691
2,659 73 73 73 .. 2,586
2,111 84 84 84 .. 2,027
2,029 93 93 93 .. 1,937
1,568 281 281 281 .. 1,286
1,095 845 845 845 .. 250
Interest payments (long-term) Public and publicly guaranteed sector Public sector of which: General government Private sector guaranteed by public sector Private sector not guaranteed
50 16 16 16 .. 33
651 25 25 25 .. 626
673 51 51 51 .. 622
741 88 88 88 .. 653
772 149 149 149 .. 623
221 163 163 163 .. 58
5,380 1,042 1,009 712 225 297 33 .. 33 4,337 .. 4,337 193
18,416 1,922 1,705 1,168 262 537 216 .. 216 16,494 .. 16,494 169
16,968 2,306 1,957 1,278 277 679 349 .. 349 14,663 .. 14,663 179
17,085 3,411 2,374 1,633 446 741 1,037 500 537 13,674 .. 13,674 175
17,914 4,313 3,161 1,853 446 1,307 1,152 500 652 13,601 .. 13,601 174
17,012 5,112 4,180 2,565 480 1,616 931 500 431 11,900 .. 11,900 560
.. 2,395 -23 -2 -6 -21 2,418 .. 2,418 302
.. -1,121 245 101 17 143 -1,366 .. -1,366 144
.. -791 181 68 4 114 -972 .. -972 -383
.. 1,017 452 373 174 79 565 500 65 235
.. -66 804 232 8 572 -870 .. -870 334
367 458 938 670 16 268 -479 .. -479 -243
35 0
19 -1
99 0
168 0
-901 ..
-935 ..
98 45 13 7 12 51 13,182
231 94 40 3 6 8 20,529
168 77 27 0 7 10 22,294
167 75 26 3 9 12 23,492
159 79 20 4 10 12 23,780
192 78 14 2 14 .. 23,142
Summary external debt data by debtor type
Summary external debt stock by creditor type
Long-term external debt stocks Public and publicly guaranteed debt from: Official creditors Multilateral of which: World Bank Bilateral Private creditors Bondholders Commercial banks and others Private nonguaranteed debt from: Bondholders Commercial banks and others Use of IMF credit
Net financial inflows
Net debt inflows Use of IMF credit Long-term Official creditors Multilateral of which: World Bank Bilateral Private creditors Bondholders Banks and others Short-term Net equity inflows Foreign direct investment Portfolio equity
Debt ratios
External debt stocks to exports (%) External debt stocks to GNI (%) Debt service to exports (%) Short-term to external debt stocks (%) Multilateral to external debt stocks (%) Reserves to external debt stocks (%) Gross national income (GNI)
125
