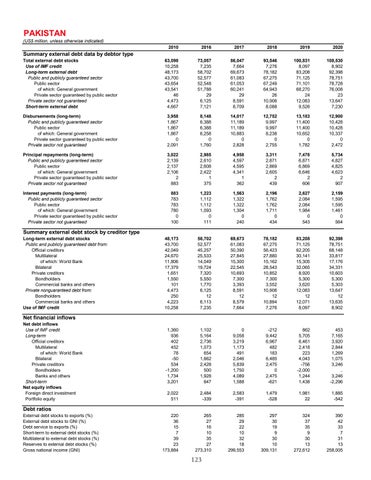
PAKISTAN
(US$ million, unless otherwise indicated) 2010
2016
2017
2018
2019
2020
Total external debt stocks Use of IMF credit Long-term external debt Public and publicly guaranteed sector Public sector of which: General government Private sector guaranteed by public sector Private sector not guaranteed Short-term external debt
63,098 10,258 48,173 43,700 43,654 43,541 46 4,473 4,667
73,057 7,235 58,702 52,577 52,548 51,788 29 6,125 7,121
86,047 7,664 69,673 61,083 61,053 60,241 29 8,591 8,709
93,546 7,276 78,182 67,275 67,249 64,943 26 10,906 8,088
100,831 8,097 83,208 71,125 71,101 68,270 24 12,083 9,526
108,530 8,902 92,398 78,751 78,728 76,008 23 13,647 7,230
Disbursements (long-term) Public and publicly guaranteed sector Public sector of which: General government Private sector guaranteed by public sector Private sector not guaranteed
3,958 1,867 1,867 1,867 0 2,091
8,148 6,388 6,388 6,258 0 1,760
14,017 11,189 11,189 10,883 0 2,828
12,752 9,997 9,997 8,238 0 2,755
13,183 11,400 11,400 10,652 0 1,782
12,900 10,428 10,428 10,337 0 2,472
Principal repayments (long-term) Public and publicly guaranteed sector Public sector of which: General government Private sector guaranteed by public sector Private sector not guaranteed
3,022 2,139 2,137 2,106 2 883
2,985 2,610 2,608 2,422 1 375
4,958 4,597 4,595 4,341 1 362
3,311 2,871 2,869 2,605 2 439
7,478 6,871 6,869 6,646 2 606
5,734 4,827 4,825 4,623 2 907
Interest payments (long-term) Public and publicly guaranteed sector Public sector of which: General government Private sector guaranteed by public sector Private sector not guaranteed
883 783 783 780 0 100
1,223 1,112 1,112 1,093 0 111
1,563 1,322 1,322 1,304 0 240
2,196 1,762 1,762 1,711 0 434
2,627 2,084 2,084 1,984 0 543
2,159 1,595 1,595 1,461 0 564
48,173 43,700 42,049 24,670 11,806 17,379 1,651 1,550 101 4,473 250 4,223 10,258
58,702 52,577 45,257 25,533 14,049 19,724 7,320 5,550 1,770 6,125 12 6,113 7,235
69,673 61,083 50,390 27,845 15,300 22,545 10,693 7,300 3,393 8,591 12 8,579 7,664
78,182 67,275 56,423 27,880 15,162 28,543 10,852 7,300 3,552 10,906 12 10,894 7,276
83,208 71,125 62,205 30,141 15,305 32,065 8,920 5,300 3,620 12,083 12 12,071 8,097
92,398 78,751 68,148 33,817 17,176 34,331 10,603 5,300 5,303 13,647 12 13,635 8,902
1,360 936 402 452 78 -50 534 -1,200 1,734 3,201
1,102 5,164 2,736 1,073 654 1,662 2,428 500 1,928 647
0 9,058 3,219 1,173 491 2,046 5,839 1,750 4,089 1,588
-212 9,442 6,967 482 183 6,485 2,475 0 2,475 -621
862 5,705 6,461 2,418 223 4,043 -756 -2,000 1,244 1,438
453 7,165 3,920 2,844 1,269 1,075 3,246 .. 3,246 -2,296
2,022 511
2,484 -339
2,583 -391
1,479 -528
1,981 22
1,885 -542
220 36 15 7 39 23 173,884
265 27 16 10 35 27 273,310
285 29 22 10 32 18 299,553
297 30 19 9 30 10 309,131
324 37 35 9 30 13 272,612
390 42 33 7 31 13 258,005
Summary external debt data by debtor type
Summary external debt stock by creditor type
Long-term external debt stocks Public and publicly guaranteed debt from: Official creditors Multilateral of which: World Bank Bilateral Private creditors Bondholders Commercial banks and others Private nonguaranteed debt from: Bondholders Commercial banks and others Use of IMF credit
Net financial inflows
Net debt inflows Use of IMF credit Long-term Official creditors Multilateral of which: World Bank Bilateral Private creditors Bondholders Banks and others Short-term Net equity inflows Foreign direct investment Portfolio equity
Debt ratios
External debt stocks to exports (%) External debt stocks to GNI (%) Debt service to exports (%) Short-term to external debt stocks (%) Multilateral to external debt stocks (%) Reserves to external debt stocks (%) Gross national income (GNI)
123
