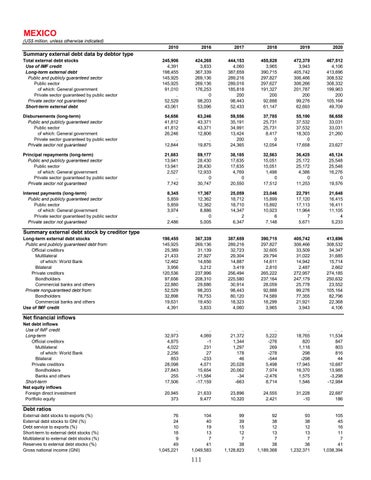
MEXICO
(US$ million, unless otherwise indicated) 2010
2016
2017
2018
2019
2020
Total external debt stocks Use of IMF credit Long-term external debt Public and publicly guaranteed sector Public sector of which: General government Private sector guaranteed by public sector Private sector not guaranteed Short-term external debt
245,906 4,391 198,455 145,925 145,925 91,010 .. 52,529 43,061
424,268 3,833 367,339 269,136 269,136 176,253 0 98,203 53,096
444,153 4,060 387,659 289,216 289,016 185,818 200 98,443 52,433
455,828 3,965 390,715 297,827 297,627 191,327 200 92,888 61,147
472,378 3,943 405,742 306,466 306,266 201,787 200 99,276 62,693
467,512 4,106 413,696 308,532 308,332 199,963 200 105,164 49,709
Disbursements (long-term) Public and publicly guaranteed sector Public sector of which: General government Private sector guaranteed by public sector Private sector not guaranteed
54,656 41,812 41,812 26,246 .. 12,844
63,246 43,371 43,371 12,806 .. 19,875
59,556 35,191 34,991 13,424 200 24,365
37,785 25,731 25,731 8,417 0 12,054
55,190 37,532 37,532 18,303 0 17,658
56,658 33,031 33,031 21,260 .. 23,627
Principal repayments (long-term) Public and publicly guaranteed sector Public sector of which: General government Private sector guaranteed by public sector Private sector not guaranteed
21,683 13,941 13,941 2,527 .. 7,742
59,177 28,430 28,430 12,933 0 30,747
38,185 17,635 17,635 4,769 0 20,550
32,563 15,051 15,051 1,498 0 17,512
36,425 25,172 25,172 4,386 0 11,253
45,124 25,548 25,548 16,276 0 19,576
Interest payments (long-term) Public and publicly guaranteed sector Public sector of which: General government Private sector guaranteed by public sector Private sector not guaranteed
8,345 5,859 5,859 3,974 .. 2,486
17,367 12,362 12,362 8,886 0 5,005
25,059 18,712 18,710 14,347 2 6,347
23,046 15,899 15,892 10,923 6 7,148
22,791 17,120 17,113 11,964 7 5,671
21,648 16,415 16,411 11,105 4 5,233
198,455 145,925 25,389 21,433 12,462 3,956 120,536 97,656 22,880 52,529 32,898 19,631 4,391
367,339 269,136 31,139 27,927 14,656 3,212 237,996 208,310 29,686 98,203 78,753 19,450 3,833
387,659 289,216 32,723 29,304 14,887 3,419 256,494 225,580 30,914 98,443 80,120 18,323 4,060
390,715 297,827 32,605 29,794 14,611 2,810 265,222 237,164 28,059 92,888 74,589 18,299 3,965
405,742 306,466 33,509 31,022 14,942 2,487 272,957 247,179 25,778 99,276 77,355 21,921 3,943
413,696 308,532 34,347 31,685 15,714 2,662 274,185 250,632 23,552 105,164 82,796 22,368 4,106
.. 32,973 4,875 4,022 2,256 853 28,098 27,843 255 17,506
.. 4,069 -1 231 27 -233 4,071 15,654 -11,584 -17,159
.. 21,372 1,344 1,297 178 46 20,028 20,062 -34 -663
.. 5,222 -276 269 -278 -544 5,498 7,974 -2,476 8,714
.. 18,765 820 1,118 298 -298 17,945 16,370 1,575 1,546
.. 11,534 847 803 816 44 10,687 13,985 -3,298 -12,984
20,945 373
21,633 9,477
23,896 10,320
24,555 2,421
31,228 -10
22,687 186
76 24 10 18 9 49 1,045,221
104 40 19 13 7 41 1,049,583
99 39 15 12 7 38 1,128,823
92 38 12 13 7 38 1,189,368
93 38 12 13 7 38 1,232,371
105 45 16 11 7 41 1,038,394
Summary external debt data by debtor type
Summary external debt stock by creditor type
Long-term external debt stocks Public and publicly guaranteed debt from: Official creditors Multilateral of which: World Bank Bilateral Private creditors Bondholders Commercial banks and others Private nonguaranteed debt from: Bondholders Commercial banks and others Use of IMF credit
Net financial inflows
Net debt inflows Use of IMF credit Long-term Official creditors Multilateral of which: World Bank Bilateral Private creditors Bondholders Banks and others Short-term Net equity inflows Foreign direct investment Portfolio equity
Debt ratios
External debt stocks to exports (%) External debt stocks to GNI (%) Debt service to exports (%) Short-term to external debt stocks (%) Multilateral to external debt stocks (%) Reserves to external debt stocks (%) Gross national income (GNI)
111
