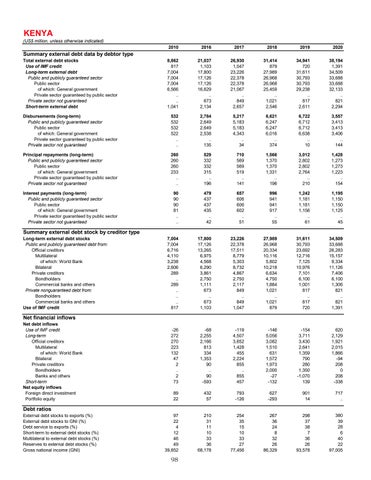
KENYA
(US$ million, unless otherwise indicated) 2010
2016
2017
2018
2019
2020
Total external debt stocks Use of IMF credit Long-term external debt Public and publicly guaranteed sector Public sector of which: General government Private sector guaranteed by public sector Private sector not guaranteed Short-term external debt
8,862 817 7,004 7,004 7,004 6,566 .. .. 1,041
21,037 1,103 17,800 17,126 17,126 16,629 .. 673 2,134
26,930 1,047 23,226 22,378 22,378 21,067 .. 849 2,657
31,414 879 27,989 26,968 26,968 25,459 .. 1,021 2,546
34,941 720 31,611 30,793 30,793 29,238 .. 817 2,611
38,194 1,391 34,509 33,688 33,688 32,133 .. 821 2,294
Disbursements (long-term) Public and publicly guaranteed sector Public sector of which: General government Private sector guaranteed by public sector Private sector not guaranteed
532 532 532 522 .. ..
2,784 2,649 2,649 2,538 .. 135
5,217 5,183 5,183 4,343 .. 34
6,621 6,247 6,247 6,016 .. 374
6,722 6,712 6,712 6,638 .. 10
3,557 3,413 3,413 3,406 .. 144
Principal repayments (long-term) Public and publicly guaranteed sector Public sector of which: General government Private sector guaranteed by public sector Private sector not guaranteed
260 260 260 233 .. ..
529 332 332 315 .. 196
710 569 569 519 .. 141
1,566 1,370 1,370 1,331 .. 196
3,012 2,802 2,802 2,764 .. 210
1,428 1,273 1,273 1,223 .. 154
Interest payments (long-term) Public and publicly guaranteed sector Public sector of which: General government Private sector guaranteed by public sector Private sector not guaranteed
90 90 90 81 .. ..
479 437 437 435 .. 42
657 606 606 602 .. 51
996 941 941 917 .. 55
1,242 1,181 1,181 1,156 .. 61
1,195 1,150 1,150 1,125 .. 45
7,004 7,004 6,716 4,110 3,238 2,606 289 .. 289 .. .. .. 817
17,800 17,126 13,265 6,975 4,568 6,290 3,861 2,750 1,111 673 .. 673 1,103
23,226 22,378 17,511 8,779 5,303 8,732 4,867 2,750 2,117 849 .. 849 1,047
27,989 26,968 20,334 10,116 5,802 10,218 6,634 4,750 1,884 1,021 .. 1,021 879
31,611 30,793 23,692 12,716 7,125 10,976 7,101 6,100 1,001 817 .. 817 720
34,509 33,688 26,283 15,157 9,334 11,126 7,406 6,100 1,306 821 .. 821 1,391
-26 272 270 223 132 47 2 .. 2 73
-68 2,255 2,166 813 334 1,353 90 .. 90 -593
-119 4,507 3,652 1,428 455 2,224 855 .. 855 457
-146 5,056 3,082 1,510 631 1,572 1,973 2,000 -27 -132
-154 3,711 3,430 2,641 1,359 790 280 1,350 -1,070 139
620 2,129 1,921 2,015 1,866 -94 208 0 208 -338
89 22
432 57
793 -126
627 -293
901 14
717 ..
97 22 4 12 46 49 39,852
210 31 11 10 33 36 68,178
254 35 15 10 33 27 77,456
267 36 24 8 32 26 86,329
298 37 38 7 36 26 93,578
380 39 28 6 40 22 97,005
Summary external debt data by debtor type
Summary external debt stock by creditor type
Long-term external debt stocks Public and publicly guaranteed debt from: Official creditors Multilateral of which: World Bank Bilateral Private creditors Bondholders Commercial banks and others Private nonguaranteed debt from: Bondholders Commercial banks and others Use of IMF credit
Net financial inflows
Net debt inflows Use of IMF credit Long-term Official creditors Multilateral of which: World Bank Bilateral Private creditors Bondholders Banks and others Short-term Net equity inflows Foreign direct investment Portfolio equity
Debt ratios
External debt stocks to exports (%) External debt stocks to GNI (%) Debt service to exports (%) Short-term to external debt stocks (%) Multilateral to external debt stocks (%) Reserves to external debt stocks (%) Gross national income (GNI)
98
