INDONESIA
(US$ million, unless otherwise indicated) 2010
2016
2017
2018
2019
2020
Total external debt stocks Use of IMF credit Long-term external debt Public and publicly guaranteed sector Public sector of which: General government Private sector guaranteed by public sector Private sector not guaranteed Short-term external debt
198,278 3,050 162,181 102,748 102,748 94,026 .. 59,433 33,047
318,942 2,662 275,595 177,073 177,073 154,762 .. 98,522 40,685
353,564 2,820 304,012 194,953 194,953 175,600 .. 109,059 46,731
379,589 2,754 328,875 215,072 215,072 183,262 .. 113,802 47,960
402,106 2,739 354,569 233,528 233,528 199,076 .. 121,041 44,799
417,532 2,852 370,192 248,419 248,419 206,991 .. 121,773 44,488
Disbursements (long-term) Public and publicly guaranteed sector Public sector of which: General government Private sector guaranteed by public sector Private sector not guaranteed
34,335 13,695 13,695 8,139 .. 20,640
68,083 26,669 26,669 23,903 .. 41,414
78,616 27,535 27,535 24,690 .. 51,081
72,086 31,060 31,060 15,822 .. 41,026
94,778 31,656 31,656 25,950 .. 63,122
65,672 30,834 30,834 21,355 .. 34,838
Principal repayments (long-term) Public and publicly guaranteed sector Public sector of which: General government Private sector guaranteed by public sector Private sector not guaranteed
26,202 8,072 8,072 7,823 .. 18,129
53,835 10,029 10,029 5,951 .. 43,806
46,884 11,765 11,765 5,961 .. 35,119
42,905 10,614 10,614 7,858 .. 32,291
68,392 13,235 13,235 10,178 .. 55,157
52,577 18,469 18,469 15,905 .. 34,108
Interest payments (long-term) Public and publicly guaranteed sector Public sector of which: General government Private sector guaranteed by public sector Private sector not guaranteed
4,944 3,034 3,034 2,834 .. 1,910
9,730 5,959 5,959 4,906 .. 3,771
10,595 6,579 6,579 5,520 .. 4,015
10,703 6,767 6,767 5,873 .. 3,936
12,046 7,867 7,867 6,281 .. 4,179
13,531 9,360 9,360 6,742 .. 4,170
162,181 102,748 66,176 22,567 11,367 43,609 36,572 28,698 7,874 59,433 8,437 50,996 3,050
275,595 177,073 51,549 27,496 17,224 24,052 125,524 114,376 11,149 98,522 13,306 85,216 2,662
304,012 194,953 51,666 28,363 17,941 23,302 143,287 135,396 7,891 109,059 14,383 94,677 2,820
328,875 215,072 53,072 30,099 18,507 22,973 162,000 151,001 10,999 113,802 15,038 98,764 2,754
354,569 233,528 52,276 31,447 19,109 20,829 181,251 173,224 8,027 121,041 16,515 104,526 2,739
370,192 248,419 57,928 34,077 19,669 23,851 190,491 182,704 7,786 121,773 18,208 103,565 2,852
.. 8,134 1,406 1,367 1,287 39 6,727 3,198 3,529 8,998
.. 14,248 -472 1,595 1,221 -2,067 14,720 17,144 -2,424 2,254
.. 31,732 -905 736 645 -1,641 32,637 21,257 11,380 6,046
.. 29,182 1,401 1,785 594 -384 27,780 16,496 11,284 1,229
.. 26,386 -927 1,354 617 -2,282 27,313 23,767 3,546 -3,161
.. 13,095 3,978 2,149 472 1,829 9,116 10,493 -1,377 -311
12,447 2,132
4,684 1,319
18,839 -2,538
19,993 -3,668
25,069 -397
19,348 -4,362
118 27 19 17 11 47 734,988
186 35 37 13 9 36 902,045
177 36 29 13 8 36 983,438
172 38 25 13 8 31 1,011,213
194 37 39 11 8 31 1,085,070
228 41 37 11 8 31 1,029,919
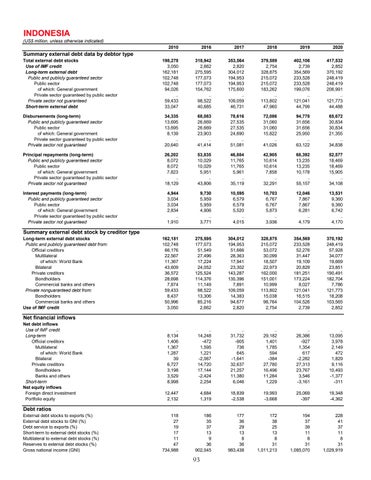
Summary external debt data by debtor type
Summary external debt stock by creditor type
Long-term external debt stocks Public and publicly guaranteed debt from: Official creditors Multilateral of which: World Bank Bilateral Private creditors Bondholders Commercial banks and others Private nonguaranteed debt from: Bondholders Commercial banks and others Use of IMF credit
Net financial inflows
Net debt inflows Use of IMF credit Long-term Official creditors Multilateral of which: World Bank Bilateral Private creditors Bondholders Banks and others Short-term Net equity inflows Foreign direct investment Portfolio equity
Debt ratios
External debt stocks to exports (%) External debt stocks to GNI (%) Debt service to exports (%) Short-term to external debt stocks (%) Multilateral to external debt stocks (%) Reserves to external debt stocks (%) Gross national income (GNI)
93
