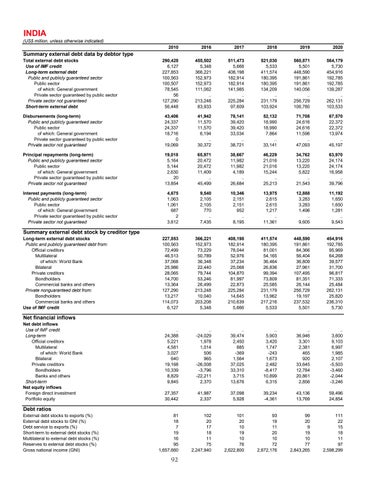
INDIA
(US$ million, unless otherwise indicated) 2010
2016
2017
2018
2019
2020
Total external debt stocks Use of IMF credit Long-term external debt Public and publicly guaranteed sector Public sector of which: General government Private sector guaranteed by public sector Private sector not guaranteed Short-term external debt
290,428 6,127 227,853 100,563 100,507 78,545 56 127,290 56,448
455,502 5,348 366,221 152,973 152,973 111,062 .. 213,248 83,933
511,473 5,666 408,198 182,914 182,914 141,985 .. 225,284 97,609
521,030 5,533 411,574 180,395 180,395 134,209 .. 231,179 103,924
560,871 5,501 448,590 191,861 191,861 140,056 .. 256,729 106,780
564,179 5,730 454,916 192,785 192,785 139,287 .. 262,131 103,533
Disbursements (long-term) Public and publicly guaranteed sector Public sector of which: General government Private sector guaranteed by public sector Private sector not guaranteed
43,406 24,337 24,337 18,716 0 19,069
41,942 11,570 11,570 6,194 .. 30,372
78,141 39,420 39,420 33,034 .. 38,721
52,132 18,990 18,990 7,864 .. 33,141
71,708 24,616 24,616 11,596 .. 47,093
67,570 22,372 22,372 13,974 .. 45,197
Principal repayments (long-term) Public and publicly guaranteed sector Public sector of which: General government Private sector guaranteed by public sector Private sector not guaranteed
19,018 5,164 5,144 2,630 20 13,854
65,971 20,472 20,472 11,409 .. 45,499
38,667 11,982 11,982 4,189 .. 26,684
46,229 21,016 21,016 15,244 .. 25,213
34,762 13,220 13,220 5,822 .. 21,543
63,970 24,174 24,174 16,958 .. 39,796
Interest payments (long-term) Public and publicly guaranteed sector Public sector of which: General government Private sector guaranteed by public sector Private sector not guaranteed
4,675 1,063 1,061 687 2 3,612
9,540 2,105 2,105 770 .. 7,435
10,346 2,151 2,151 952 .. 8,195
13,975 2,615 2,615 1,217 .. 11,361
12,888 3,283 3,283 1,496 .. 9,605
11,192 1,650 1,650 1,281 .. 9,543
227,853 100,563 72,499 46,513 37,068 25,986 28,065 14,700 13,364 127,290 13,217 114,073 6,127
366,221 152,973 73,229 50,789 36,348 22,440 79,744 53,246 26,499 213,248 10,040 203,208 5,348
408,198 182,914 78,044 52,976 37,234 25,068 104,870 81,997 22,873 225,284 14,645 210,639 5,666
411,574 180,395 81,001 54,165 36,464 26,836 99,394 73,809 25,585 231,179 13,962 217,216 5,533
448,590 191,861 84,366 56,404 36,809 27,961 107,495 81,351 26,144 256,729 19,197 237,532 5,501
454,916 192,785 95,969 64,268 39,577 31,700 96,817 71,333 25,484 262,131 25,820 236,310 5,730
.. 24,388 5,221 4,581 3,027 640 19,168 10,339 8,829 9,845
.. -24,029 1,978 1,014 506 965 -26,008 -3,796 -22,211 2,370
.. 39,474 2,450 885 -369 1,564 37,025 33,310 3,715 13,676
.. 5,903 3,420 1,747 -243 1,673 2,482 -8,417 10,899 6,315
.. 36,946 3,301 2,381 465 920 33,645 12,784 20,861 2,856
.. 3,600 9,103 6,997 1,985 2,107 -5,503 -3,460 -2,044 -3,246
27,357 30,442
41,987 2,337
37,098 5,928
39,234 -4,361
43,136 13,769
59,496 24,854
81 18 7 19 16 95 1,657,660
102 20 17 18 11 75 2,247,940
101 20 10 19 10 76 2,622,800
93 19 11 20 10 72 2,672,176
99 20 9 19 10 77 2,843,265
111 22 15 18 11 97 2,598,299
Summary external debt data by debtor type
Summary external debt stock by creditor type
Long-term external debt stocks Public and publicly guaranteed debt from: Official creditors Multilateral of which: World Bank Bilateral Private creditors Bondholders Commercial banks and others Private nonguaranteed debt from: Bondholders Commercial banks and others Use of IMF credit
Net financial inflows
Net debt inflows Use of IMF credit Long-term Official creditors Multilateral of which: World Bank Bilateral Private creditors Bondholders Banks and others Short-term Net equity inflows Foreign direct investment Portfolio equity
Debt ratios
External debt stocks to exports (%) External debt stocks to GNI (%) Debt service to exports (%) Short-term to external debt stocks (%) Multilateral to external debt stocks (%) Reserves to external debt stocks (%) Gross national income (GNI)
92
