Measuring the Performance of Targeting Methods | 491
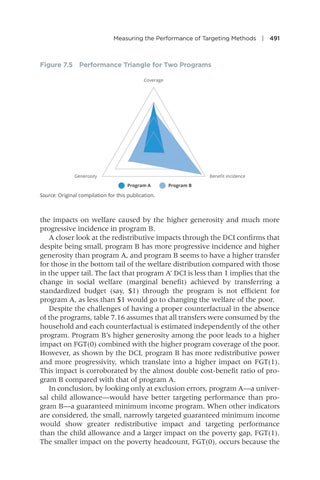
Figure 7.5 Performance Triangle for Two Programs Coverage
Generosity
Benefit incidence Program A
Program B
Source: Original compilation for this publication.
the impacts on welfare caused by the higher generosity and much more progressive incidence in program B. A closer look at the redistributive impacts through the DCI confirms that despite being small, program B has more progressive incidence and higher generosity than program A, and program B seems to have a higher transfer for those in the bottom tail of the welfare distribution compared with those in the upper tail. The fact that program A’ DCI is less than 1 implies that the change in social welfare (marginal benefit) achieved by transferring a standardized budget (say, $1) through the program is not efficient for program A, as less than $1 would go to changing the welfare of the poor. Despite the challenges of having a proper counterfactual in the absence of the programs, table 7.16 assumes that all transfers were consumed by the household and each counterfactual is estimated independently of the other program. Program B’s higher generosity among the poor leads to a higher impact on FGT(0) combined with the higher program coverage of the poor. However, as shown by the DCI, program B has more redistributive power and more progressivity, which translate into a higher impact on FGT(1). This impact is corroborated by the almost double cost-benefit ratio of program B compared with that of program A. In conclusion, by looking only at exclusion errors, program A—a universal child allowance—would have better targeting performance than program B—a guaranteed minimum income program. When other indicators are considered, the small, narrowly targeted guaranteed minimum income would show greater redistributive impact and targeting performance than the child allowance and a larger impact on the poverty gap, FGT(1). The smaller impact on the poverty headcount, FGT(0), occurs because the