
9 minute read
6.1 Example of Classification of Developed Area


350 | Revisiting Targeting in Social Assistance
been used since the 2000s to help social programs decide where to locate services. For social protection, they are often used to allocate budget or create quotas for the number of people who should be covered by programs in each area.
Advertisement
In recent years, advanced technology for geotagging and processing large databases has allowed researchers and policy makers to explore different uses of small area estimation for supporting social protection and targeting, but mostly these sensing data are used in poverty assessments. The following discussion draws on Areias et al. (forthcoming), which summarizes the application of machine learning to big data to facilitate greater geographical targeting; chapter 8 summarizes the application of machine learning to PMT.
Satellite imagery has been used to produce local area poverty estimation. For example, Engstrom, Hersh, and Newhouse (2021) use a convolutional neural network, which is a machine learning approach, with highresolution satellite imagery, in Sri Lanka to classify objects (for example, roof type, paved roads, railroads, and so forth) (photo 6.1). They then impute welfare estimates using the Elbers, Lanjouw, and Lanjouw (2003) approach into the 2011 Census of Population and Housing. That is, for each household in the census, per capita consumption is estimated based on models developed from the Household Income and Expenditure Survey using household indicators that are common to both the census and the
Photo 6.1 Example of Classification of Developed Area (Buildings)
a. Raw image b. Image with developed area classifier
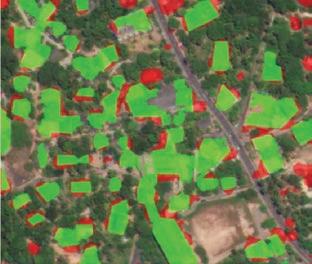
Source: Engstrom, Hersh, and Newhouse 2021. Note: Panels a and b, respectively, show the raw and classified images for developed area classifier from raw satellite imagery. The areas in green show true positive building classifications. The images in red show false positives, areas erroneously classified as buildings.
How to Harness the Power of Data and Inference | 351
Household Income and Expenditure Survey. By comparing convolutional neural network classifications with the poverty estimates and predictions of household income, Engstrom, Hersh, and Newhouse (2021) in fact as above explain around 60 percent of the variation in imputed household consumption data averaged at the village level, which could help future geographic targeting without the burden of collecting a census or household-level data. Jean et al. (2016) implement a convolutional neural network with nightlight satellite imagery applied to daytime satellite imagery for Malawi, Nigeria, Rwanda, Tanzania, and Uganda. They find promising results for small area poverty estimates. The authors show that satellite imagery can produce fine-grained poverty and wealth estimates using only available data such as a Living Standards Measurement Study survey, explaining up to 75 percent of the variation in local-level economic outcomes. The approach explains 37–55 percent of the variation in average household consumption (as measured in the Living Standards Measurement Study surveys) and 55–75 percent of the variation in average household asset wealth obtained at the cluster level.5 In a background paper for the World Development Report 2021 on data for development, Masaki et al. (2020) show that incorporating satellite data into small area nonmonetary poverty estimates in Sri Lanka and Tanzania improves map accuracy to a degree equivalent to tripling the household survey in Sri Lanka and increasing it by five times in Tanzania.
Mobile phone CDRs have also been used to infer household-level welfare at the regional/cluster level.6 The prototypical CDR metadata include a hashed phone number of the calling and receiving parties, the type of transaction (call or text), the date and time of the transaction, the cost, the call duration, and an identifier for the cell phone tower used to initiate the transaction, which indicates geographical location. The literature combining CDRs and household surveys provides a promising contribution to predicting low-level poverty and wealth indicators at the cluster level. Blumenstock and Eagle (2010, 2012) in Rwanda and Wesolowski et al. (2012) in Kenya examine correlations between household and individual demographics and call patterns. Blumenstock, Cadamuro, and On (2015) provided the first rigorous machine learning approach to modeling household-level poverty and wealth indicators in Rwanda. Using a phone survey of 856 respondents, they can explain 68 percent of the variation in the first principal component of a principal component analysis wealth index.7
Phone data can also be used to create maps of travel times to public services, which account for not just distance but congestion. Roberts, Gil Sander, and Tiwari (2019) show correlations of mobile phone–based traffic congestion time and the times and costs associated with reaching public services such as health and education facilities in Jakarta, Indonesia (see map 6.1). The analysis reveals that regular survey data do not capture the
352 | Revisiting Targeting in Social Assistance
Map 6.1 Travel Times to Jakarta’s Main Government Offices
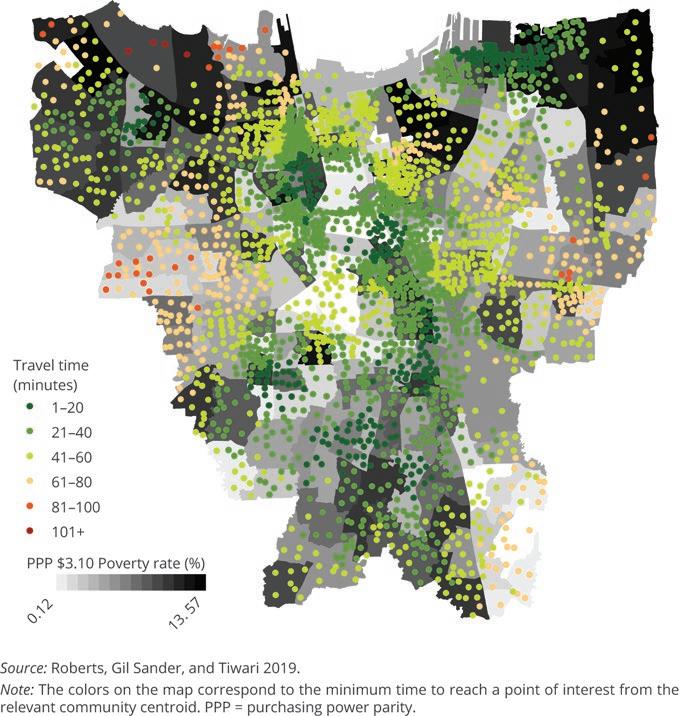
full extent of spatial inequality and constraints on access to services in Indonesia’s cities: distance to certain facilities may be an inappropriate indicator of access in settings with high levels of congestion.8 Recently, CDRs have been used to target individuals directly. This is discussed further in the section on PMT.
However, the use of CDRs faces limitations, particularly in access. In many countries, CDR data are owned by private operators and may not be accessible to governments for use in social protection programs. In countries with multiple operators, access to all firms’ data may be necessary to get a nationally representative data set, making access issues even
How to Harness the Power of Data and Inference | 353
more difficult. Moreover, as with traditional poverty mapping models, which combine census and household survey data, CDR-based models do well at estimating welfare at the community level but may have much greater errors at the household level, which is the level most pertinent for social assistance eligibility determination.
The use of social media data for poverty assessments is also increasing. Recent work has combined social media data with satellite data to improve or substitute for traditional poverty mapping techniques. For example, Fatehkia et al. (2020) train a model using satellite daytime imagery on Demographic and Health Survey localized (cluster) household principal component analysis wealth indices to predict poverty in India and the Philippines. They then show that use of basic (and freely available) Facebook data can come close to replicating satellite data–based maps or standard poverty mapping approaches or can be used to augment them.9
The ever-expanding access to and frequency of big data and the computational power of machine learning provide an encouraging option for prediction that can be used for poverty mapping at fine levels of disaggregation. Chi et al. (2021) have recently combined satellite, CDR, and social media data to construct poverty maps for 135 developing countries. However, there are several significant data constraints. The ability to make inferences for individual households is dependent on the quality of the “ground truth” data from more traditional surveys. Where survey data are unavailable or inaccurate, it will be difficult (or impossible) to develop accurate big data–based models. Hence, investments in big data do not replace the need to collect more information at the household level to improve the ability to differentiate eligibility or benefits. Moreover, the current literature suggests that although identifying droughts and agricultural shocks is feasible with sensing data, identifying economic shocks (such as job loss) and health shocks is not well served by this. Ohlenburg’s (2020a) careful analysis of using big data in social protection shows that despite having multiple usages, data protection, including which data the state can legitimately use to determine eligibility (box 6.1), is one among many questions for this promising but still immature field. The Give Directly example discussed in the PMT section offers a cautionary tale about the use of novel data sources. Other researchers, such as Steele et al. (2017), suggest that targeting methods with big data are not yet accurate enough for use at the household level. Nonetheless, in the half-decade since Steele et al. (2017) published that paper, the use of CDRs to target households has moved from the academic to implementation, as discussed later in this chapter.
Moreover, methodological questions remain on data and the accuracy of big data–driven maps. First, several researchers use the Demographic and Health Survey wealth index to train their models (for example,
354 | Revisiting Targeting in Social Assistance
Blumenstock, Cadamuro, and On 2015; Head et al. 2017; Jean et al. 2016; Masaki et al. 2020). However, this wealth index is the first component from a principal component analysis, which is itself a proxy for the desired measure to be predicted, based on the same household characteristics that PMT uses to predict income or consumption. So, many of the big data models are training on a proxy for the desired measure rather than directly on the measure itself (as models that train on a Living Standards Measurement Study survey or Household Income and Expenditure Survey do). Second, although some big data—notably, administrative and census data—are direct measures, satellite data are modeled and interpolated before they are used in the poverty mapping models. Thus, a combination of noise in the training data and noise in the big data explanatory variables raises some questions about the accuracy of the resulting maps. Moreover, maps are often produced with point estimates and not a measure of precision, which is needed to know how confident a policy maker should be in using the maps at different levels of disaggregation or running the risk of producing biased estimates with inaccurate measures of precision. To date, to our knowledge, the accuracy of the big data approaches is only estimated by simulations in the training data themselves, or in comparison with alternative imputations in the case of Engstrom, Hersch, and Newhouse (2021). There is a need for research that would directly assess the big data maps by, for example, surveying household income or consumption in selected areas with samples that are large enough to compare true local area poverty rates with the predicted rates from the new maps. Future research could also compare the different big data maps—satellite, CDR, and social media—to identify which versions are more accurate.
In addition to determining quotas or regional prioritization for social programs, big data may be used to improve the dynamism of targeting with early warning systems. These data can help policy makers with program response (vertical and horizontal expansion) and planning, especially in times of crises, for better targeted responses. In Bangladesh, for example, in July 2020, the Jumana River experienced more severe and protracted flooding than it had experienced in decades. Data on upstream river levels were used to trigger electronic cash payments to downstream households a few days in advance of the flooding. Subsequent evaluation showed that the anticipatory cash transfer was mostly spent on food and water, and that treated households were 36 percent less likely to go a day without eating during the flood. Three months after the flood, households that had received the transfer reported significantly higher child and adult food consumption and well-being. They also experienced lower asset loss, engaged in less costly borrowing after the flood, and reported higher earnings potential (Pople et al. 2021).
