474 | Revisiting Targeting in Social Assistance
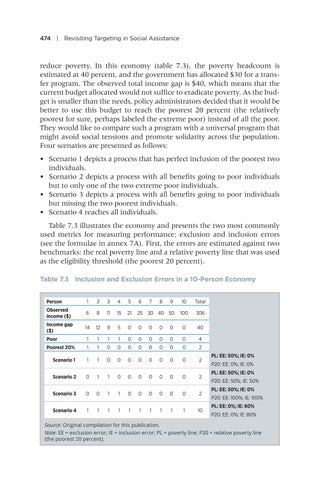
reduce poverty. In this economy (table 7.3), the poverty headcount is estimated at 40 percent, and the government has allocated $30 for a transfer program. The observed total income gap is $40, which means that the current budget allocated would not suffice to eradicate poverty. As the budget is smaller than the needs, policy administrators decided that it would be better to use this budget to reach the poorest 20 percent (the relatively poorest for sure, perhaps labeled the extreme poor) instead of all the poor. They would like to compare such a program with a universal program that might avoid social tensions and promote solidarity across the population. Four scenarios are presented as follows: • Scenario 1 depicts a process that has perfect inclusion of the poorest two individuals. • Scenario 2 depicts a process with all benefits going to poor individuals but to only one of the two extreme poor individuals. • Scenario 3 depicts a process with all benefits going to poor individuals but missing the two poorest individuals. • Scenario 4 reaches all individuals. Table 7.3 illustrates the economy and presents the two most commonly used metrics for measuring performance: exclusion and inclusion errors (see the formulae in annex 7A). First, the errors are estimated against two benchmarks: the real poverty line and a relative poverty line that was used as the eligibility threshold (the poorest 20 percent). Table 7.3 Inclusion and Exclusion Errors in a 10-Person Economy Person
1
2
3
4
5
6
Observed income ($)
6
8
11
15
21
25 30 40 50
Income gap ($)
14
12
9
5
0
0
0
0
Poor
1
1
1
1
0
0
0
Poorest 20%
1
1
0
0
0
0
0
Scenario 1
1
1
0
0
0
0
Scenario 2
0
1
1
0
0
Scenario 3
0
0
1
1
Scenario 4
1
1
1
1
7
8
9
10
Total
100
306
0
0
40
0
0
0
4
0
0
0
2
0
0
0
0
2
0
0
0
0
0
2
0
0
0
0
0
0
2
1
1
1
1
1
1
10
PL: EE: 50%; IE: 0% P20: EE: 0%; IE: 0% PL: EE: 50%; IE: 0% P20: EE: 50%; IE: 50% PL: EE: 50%; IE: 0% P20: EE: 100%; IE: 100% PL: EE: 0%; IE: 60% P20: EE: 0%; IE: 80%
Source: Original compilation for this publication. Note: EE = exclusion error; IE = inclusion error; PL = poverty line; P20 = relative poverty line (the poorest 20 percent).