How to Harness the Power of Data and Inference | 393
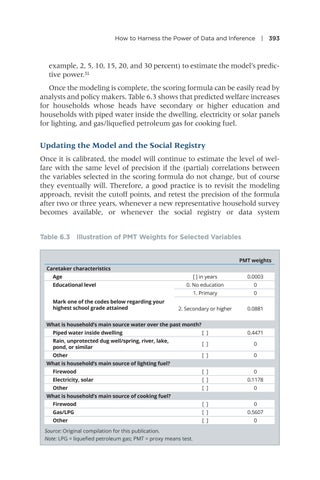
example, 2, 5, 10, 15, 20, and 30 percent) to estimate the model’s predictive power.51 Once the modeling is complete, the scoring formula can be easily read by analysts and policy makers. Table 6.3 shows that predicted welfare increases for households whose heads have secondary or higher education and households with piped water inside the dwelling, electricity or solar panels for lighting, and gas/liquefied petroleum gas for cooking fuel.
Updating the Model and the Social Registry Once it is calibrated, the model will continue to estimate the level of welfare with the same level of precision if the (partial) correlations between the variables selected in the scoring formula do not change, but of course they eventually will. Therefore, a good practice is to revisit the modeling approach, revisit the cutoff points, and retest the precision of the formula after two or three years, whenever a new representative household survey becomes available, or whenever the social registry or data system Table 6.3 Illustration of PMT Weights for Selected Variables PMT weights Caretaker characteristics Age Educational level Mark one of the codes below regarding your highest school grade attained
[ ] in years
0.0003
0. No education
0
1. Primary
0
2. Secondary or higher
0.0881
What is household’s main source water over the past month? Piped water inside dwelling
[ ]
0.4471
Rain, unprotected dug well/spring, river, lake, pond, or similar
[ ]
0
Other
[ ]
0
What is household’s main source of lighting fuel? Firewood
[ ]
0
Electricity, solar
[ ]
0.1178
Other
[ ]
0
What is household’s main source of cooking fuel? Firewood
[ ]
0
Gas/LPG
[ ]
0.5607
Other
[ ]
0
Source: Original compilation for this publication. Note: LPG = liquefied petroleum gas; PMT = proxy means test.

