350 | Revisiting Targeting in Social Assistance
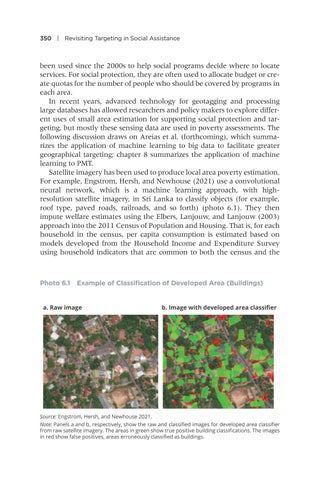
been used since the 2000s to help social programs decide where to locate services. For social protection, they are often used to allocate budget or create quotas for the number of people who should be covered by programs in each area. In recent years, advanced technology for geotagging and processing large databases has allowed researchers and policy makers to explore different uses of small area estimation for supporting social protection and targeting, but mostly these sensing data are used in poverty assessments. The following discussion draws on Areias et al. (forthcoming), which summarizes the application of machine learning to big data to facilitate greater geographical targeting; chapter 8 summarizes the application of machine learning to PMT. Satellite imagery has been used to produce local area poverty estimation. For example, Engstrom, Hersh, and Newhouse (2021) use a convolutional neural network, which is a machine learning approach, with high- resolution satellite imagery, in Sri Lanka to classify objects (for example, roof type, paved roads, railroads, and so forth) (photo 6.1). They then impute welfare estimates using the Elbers, Lanjouw, and Lanjouw (2003) approach into the 2011 Census of Population and Housing. That is, for each household in the census, per capita consumption is estimated based on models developed from the Household Income and Expenditure Survey using household indicators that are common to both the census and the
Photo 6.1 Example of Classification of Developed Area (Buildings)
a. Raw image
b. Image with developed area classifier
Source: Engstrom, Hersh, and Newhouse 2021. Note: Panels a and b, respectively, show the raw and classified images for developed area classifier from raw satellite imagery. The areas in green show true positive building classifications. The images in red show false positives, areas erroneously classified as buildings.

