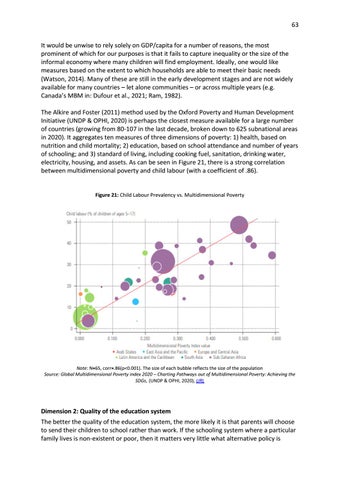
63 It would be unwise to rely solely on GDP/capita for a number of reasons, the most prominent of which for our purposes is that it fails to capture inequality or the size of the informal economy where many children will find employment. Ideally, one would like measures based on the extent to which households are able to meet their basic needs (Watson, 2014). Many of these are still in the early development stages and are not widely available for many countries – let alone communities – or across multiple years (e.g. Canada’s MBM in: Dufour et al., 2021; Ram, 1982). The Alkire and Foster (2011) method used by the Oxford Poverty and Human Development Initiative (UNDP & OPHI, 2020) is perhaps the closest measure available for a large number of countries (growing from 80-107 in the last decade, broken down to 625 subnational areas in 2020). It aggregates ten measures of three dimensions of poverty: 1) health, based on nutrition and child mortality; 2) education, based on school attendance and number of years of schooling; and 3) standard of living, including cooking fuel, sanitation, drinking water, electricity, housing, and assets. As can be seen in Figure 21, there is a strong correlation between multidimensional poverty and child labour (with a coefficient of .86).
Figure 21: Child Labour Prevalency vs. Multidimensional Poverty
Note: N=65, corr=.86(p<0.001). The size of each bubble reflects the size of the population Source: Global Multidimensional Poverty index 2020 – Charting Pathways out of Multidimensional Poverty: Achieving the SDGs, (UNDP & OPHI, 2020), URL
Dimension 2: Quality of the education system The better the quality of the education system, the more likely it is that parents will choose to send their children to school rather than work. If the schooling system where a particular family lives is non-existent or poor, then it matters very little what alternative policy is


