
9 minute read
3. Child labour footprint findings


3. Child labour footprint findings
The USDOL List of Goods flagged 74 countries, 145 commodities, and a total of 395 combinations (country-commodity) produced with child labour in its last publication covering for years 2019-2020. Out of those, the results of 102 commodities from 66 countries are displayed in Figure 6 (280 combinations). The omitted products and countries are due to excluded commodities, whether because there was no importation of the flagged commodity to the EU from the selected country, or they could not be matched with a Comext category. 11 As the study is focused on importation flows outside of geographical Europe, Ukraine was not considered (as the only in-scope country as per the USDOL List of Goods).
Advertisement
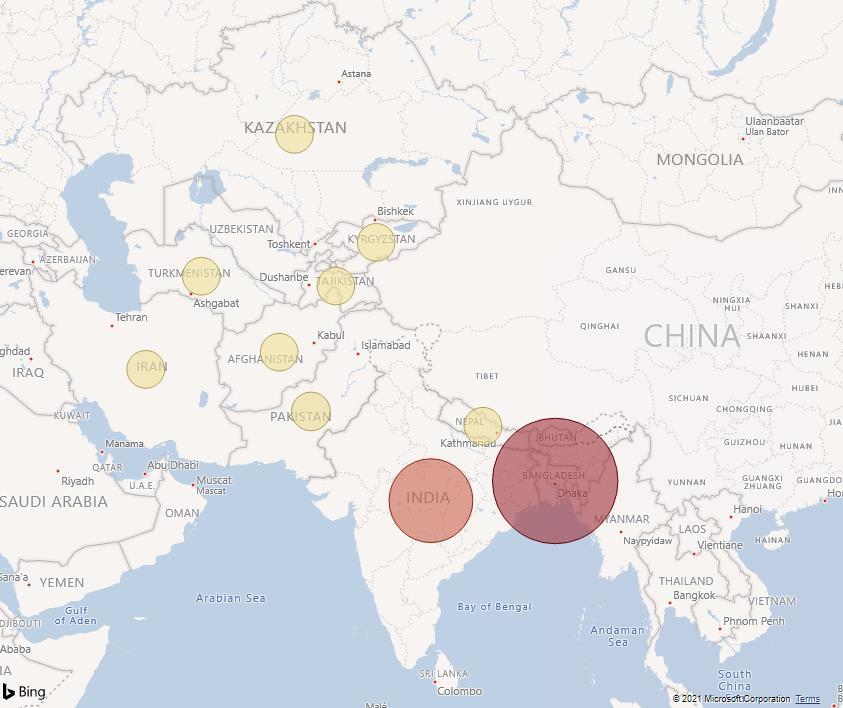
Figure 6: Child Labour Bubble Map
An estimated €50.08 billion was the value of imports by the EU produced with child labour in 2019. Figure 6 presents the data of the value of in-scope exported goods to the EU produced with child labour, where the bubbles’ size and colour vary according to the estimated amount of child labour. The most prominent in-scope exporters to the EU (see Table 6) are China (EUR 143bn), Bangladesh (EUR 18.4bn), Turkey (EUR 13.4bn), Viet Nam (EUR 12.3bn), and India (EUR 9.3bn). These countries are also the ones that contributed the most to the child labour value estimated in EUR. In first place is China, with 74% (EUR
11 The countries, for which the value of imports of the in-scope product/s was null, are: Mauritania, Ethiopia, Lesotho, Eswatini, Chad, and South Sudan.
37.2bn) of the value mentioned above. In second place is Viet Nam 6% (EUR 3.2bn), in third Bangladesh 4% (EUR 2.2bn), followed by Turkey and India 2% each, in fourth (EUR 1.2bn) and fifth (EUR 1.1bn) place, respectively. Table 6 presents the top 20 in absolute terms. For the full list, see our application visualising those findings.
Table 6: Top 20 In-Scope Countries Exporting to the EU with Child Labour (Ordered by the Contribution to the Estimated EUR Value of Child Labour)
Country
1. China 2. Vietnam 3. Bangladesh 4. Turkey 5. India 6. Brazil 7. Indonesia 8. Burma 9. Colombia 10. Côte d'Ivoire 11. Malaysia 12. Ecuador 13. Ghana 14. Thailand 15. Honduras 16. Bolivia 17. Philippines 18. Democratic Republic of the Congo 19. Nigeria 20. Cameroon In-scope importations (EUR) 143,172,279,621 12,323,108,894 18,391,656,557 13,373,033,536 9,304,000,608 4,128,323,323 3,114,678,094 2,646,794,974 1,908,292,867 3,147,419,697 1,080,557,144 1,145,583,785 1,200,922,370 509,234,377 597,939,665 426,093,855 322,087,243 638,691,318 517,172,701 506,894,944 Estimated value of child labour (EUR) 37,224,792,701.46 3,204,008,312.44 2,206,998,786.84 1,203,573,018.24 1,116,480,072.96 908,231,131.06 809,816,304.44 688,166,693.24 419,824,430.74 377,690,363.64 280,944,857.44 252,028,432.70 144,110,684.40 132,400,938.02 131,546,726.30 93,740,648.10 83,742,683.18 76,642,958.16 62,060,724.12 60,827,393.28
The principal in-scope products imported with child labour (see Table 7) were Electronics (EUR 35bn), Garments (EUR 5.4bn), Footwear (EUR 1.5bn), Coffee (EUR 1.1bn), and Toys (EUR 1.1bn).
Table 7: Top 10 In-scope Commodities Exported to the EU with Child Labour (Ordered by the Contribution to the Estimated EUR Value of Child Labour)
Goods In-scope importations (EUR) Estimated value of child labour (EUR)
1. Electronics 134,891,109,865 35,071,688,564.90
2. Garments 3. Footwear 4. Coffee 39,535,377,933 6,780,229,648 4,990,472,465 5,368,812,578.53 1,452,434,066.40 1,098,477,466.50
5. Toys 6. Textiles 7. Oil (palm) 8. Cocoa 9. Furniture 10. Rubber 4,088,001,417 3,515,747,483 2,903,245,530 5,391,985,710 2,531,227,884 1,359,889,915 1,062,880,368.42 912,806,637.48 754,675,825.34 648,809,380.10 440,527,130.02 349,489,532.58
Applying the country categories as per the UN Methodology M49 Standard (United Nations, 2020), in-scoped countries can be grouped into five regions. The following figure shows the value in Euros of the flagged commodities imported to the EU with and without child labour.
Figure 7: Value of In-scope Goods Imported by the EU With/Without Child Labour by Region

We observe that Eastern and South-Eastern Asia is the region which exports the most inscope goods to the EU with and without child labour. The region also represents almost 85% of the calculated value of child labour. Central and Southern Asia contributes to that total with 6.71%, Latin America and Caribbean with 4.12%, Northern Africa and Western Asia 2.43%, and last, Sub-Saharan Africa with 2.01%.
3.1 Eastern and South-Eastern Asia Breaking down the analysis per region, Eastern and South-Eastern Asia exported to the EU 163.2 bn EUR of in-scope products. The principal commodities contributing to Child Labour, as per Table 8, were Electronics, Garments, Footwear, Toys, and Textiles.
Table 8: Top 5 In-scope Countries and Goods Contributing to Child Labour in Eastern and South-Eastern Asia
Country Estimated value of child labour (EUR)
% contribution
China 37,224,792,701.46 87.74%
Vietnam Indonesia 3,204,008,312.44 7.55% 809,816,304.44 1.91%
Burma Malaysia 688,166,693.24 1.62% 280,944,857.44 0.66%
Goods Estimated value of child labour (EUR)
% contribution Electronics 35,071,688,564.90 82.66% Garments 1,711,214,199.24 4.03% Footwear 1,160,695,568.76 2.74% Toys 1,062,880,368.42 2.51% Textiles 911,702,887.68 2.15%
USDOL justifies the inclusion of Electronics from China in its List of Goods on the following grounds:
There are reports that children ages 13-15 are forced to produce electronics in China. Based on the most recently available data from media sources, government raids, and NGOs, hundreds of cases of forced child labor have been reported in factories in Guangdong province, but the children are often from Henan, Shanxi, or Sichuan provinces. In some cases, children are forced to work in electronics factories through arrangements between the factories and the schools that the children attend in order to cover alleged tuition debts. The forced labor programs are described as student apprenticeships; however, the children report that they were forced to remain on the job and not allowed to return home. Half of the students' wages are sent directly to the schools, and the children receive little compensation after deductions are made for food and accommodations. In other cases, children are abducted or deceived by recruiters, sent to Guangdong, and sold to employers. Some children are held captive, forced to work long hours for little pay (U.S. Department of Labor, n.d.-b).
Figure 8 graphically represents where child labour is concentrated: China (87.74%), for the most part, and then Viet Nam (7.55%), Indonesia (1.91%) and Burma (1.62%). The contribution of the rest of the in-scoped countries is minimal (less than 1% each).
Figure 8: Value of In-scope Goods Imported by the EU With/Without Child Labour from Countries in Eastern and South-Eastern Asia Region


3.2 Central and Southern Asia Central and Southern Asia region exported into the EU around EUR 28bn. Top five products imported contributing to child Labour are Garments (81.01%), Footwear (6.42%), Leather Goods/Accessories (4.85%), Carpets (1.75%), and Cotton (1.58%).
Table 9: Top 5 In-scope Countries and Goods Contributing to Child Labour in Central and Southern Asia
Country
Bangladesh India Pakistan Iran Nepal Estimated value of child labour (EUR)
% contribution 2,206,998,786.84 65.69% 1,116,480,072.96 33.23% 26,340,959.40 0.78% 3,788,356.68 0.11% 2,558,448.00 0.08%
Goods
Garments Footwear Leather Goods/ Accessories Carpets Cotton Estimated value of child labour (EUR)
% contribution 2,721,661,680.84 81.01% 215,778,491.88 6.42% 162,865,584.12 4.85% 58,638,574.92 1.75% 52,923,511.08 1.58%
Regarding countries, Figure 9 shows the amount of exports to the EU and the degree to which each country contributes to the child labour total estimated in the region. Bangladesh represents 64.77% (EUR 2.20bn) of the estimates, and India 34.16% (EUR 1.16bn).
Figure 9: Value of In-scope Goods Imported by the EU With/Without Child Labour from Countries in Central and Southern Asia Region

3.3 Latin America and the Caribbean For Latin America and the Caribbean, Figure 10 shows that in comparison to the previous regions, a higher number of countries were flagged as producing with child labour. Nevertheless, it remains third with respect to the regional contribution to the estimated value of child labour. Another finding of note is that most of the commodities flagged by USDOL correspond with raw goods, the top 5 contributing to child labour are Coffee, Bananas, Corn, Coal and Gold.
Concerning the five principal country positions, Brazil exported a total of EUR 4.12bn, Colombia EUR 1.9bn, Ecuador EUR 1.14bn, Honduras EUR 597M and Bolivia EUR 426M of inscope goods. A hotspot for child labour, as per Figure 10, is Brazil, with almost half (44%) of the child labour estimated in the region. In second and third place are Colombia 20.34% and Ecuador 12.21%.
Table 10: Top 5 In-scope Countries and Goods Contributing to Child Labour in Latin America and the Caribbean
Country Estimated value of child labour (EUR)
% contribution
Brazil 908,231,131.06 44.00%
Colombia 419,824,430.74 20.34%
Ecuador 252,028,432.70 12.21%
Honduras Bolivia 131,546,726.30 6.37% 93,740,648.10 4.54%
Goods Estimated value of child labour (EUR)
% contribution
Coffee 755,411,409.28 36.60%
Bananas Corn Coal Gold 225,628,184.10 10.93% 183,322,434.90 8.88% 175,952,219.74 8.53% 142,206,213.16 6.89%
Figure 10: Value of In-scope Goods Imported by the EU With/Without Child Labour from Countries in Latin America and Caribbean


3.4 Northern Africa and Western Asia The Northern Africa and Western Asia region follows fourth in terms of their regional position, with only 5 countries considered for the study. The principal in-scoped commodities exported to the EU with child labour were Garments, Furniture, Cotton, Hazelnuts and Footwear.
Table 11: Top 5 In-scope Countries and Goods Contributing to Child Labour in Northern Africa and Western Asia
Country Estimated value of child labour (EUR)
% contribution
Turkey 1,203,573,018.24 98.79%
Egypt Sudan 9,975,919.41 0.82% 2,633,356.80 0.22%
Lebanon 1,585,251.99 0.13%
Yemen 486,440.55 0.04%
Goods Estimated value of child labour (EUR)
% contribution
Garments 916,742,000.07 75.25%
Furniture 115,195,828.14 9.46%
Cotton Hazelnuts 77,623,393.68 6.37% 60,406,675.11 4.96%
Footwear 26,286,642.90 2.16%
Figure 11 shows that Turkey makes up for almost all exports with child labour, as in-scope exports for the region was EUR 13.53bn, and for Turkey they were EUR 13.37bn.
Figure 11: Value of In-scope Goods Imported by the EU With/Without Child Labour from Countries in Northern Africa and Western Asia


3.5 Sub-Saharan Africa Sub-Saharan Africa is the region with most countries flagged as producing with child labour. However, similar observations as in the Latin America region can be made: the main commodities are raw goods without much further added value. The top five products are Cocoa, Tobacco, Copper, Coffee and Diamonds.
Table 12: Top 5 In-scope Countries and Goods Contributing to Child Labour in Sub-Saharan Africa
Country Estimated value of child labour (EUR)
% contribution
Côte d'Ivoire 377,690,363.64 37.54%
Ghana 144,110,684.40 14.32%
Congo, Dem. Rep. Nigeria Cameroon 76,642,958.16 7.62% 62,060,724.12 6.17% 60,827,393.28 6.05%
Goods Estimated value of child labour (EUR)
% contribution
Cocoa 644,912,971.32 64.10%
Tobacco 76,256,525.88 7.58%
Copper Coffee Diamonds 71,828,178.00 7.14% 52,883,867.52 5.26% 49,759,733.40 4.95%
The hotspot for child labour is in Côte d’lvoire (EUR 377.7M), where 98.81% of the estimated value of child labour for the country is due to Cocoa production also ranked first in the top 5 commodities in the region.
Figure 12: Value of In-scope Goods Imported by the EU With/Without Child Labour from Countries in SubSaharan Africa


