5 minute read
4. Forced/indentured child labour findings


4. Forced/indentured child labour findings
USDOL’s List of Products Produced by Forced or Indentured Child Labour flagged 25 countries and 34 commodities in 2019. Out of those, 25 commodities originating from 19 countries are shown in Figure 13 (42 combinations). As previously mentioned, the omitted products and countries are due to the fact that the flagged commodities were either not traded with the EU, or that they could not be matched with an appropriate Comext category.
Advertisement
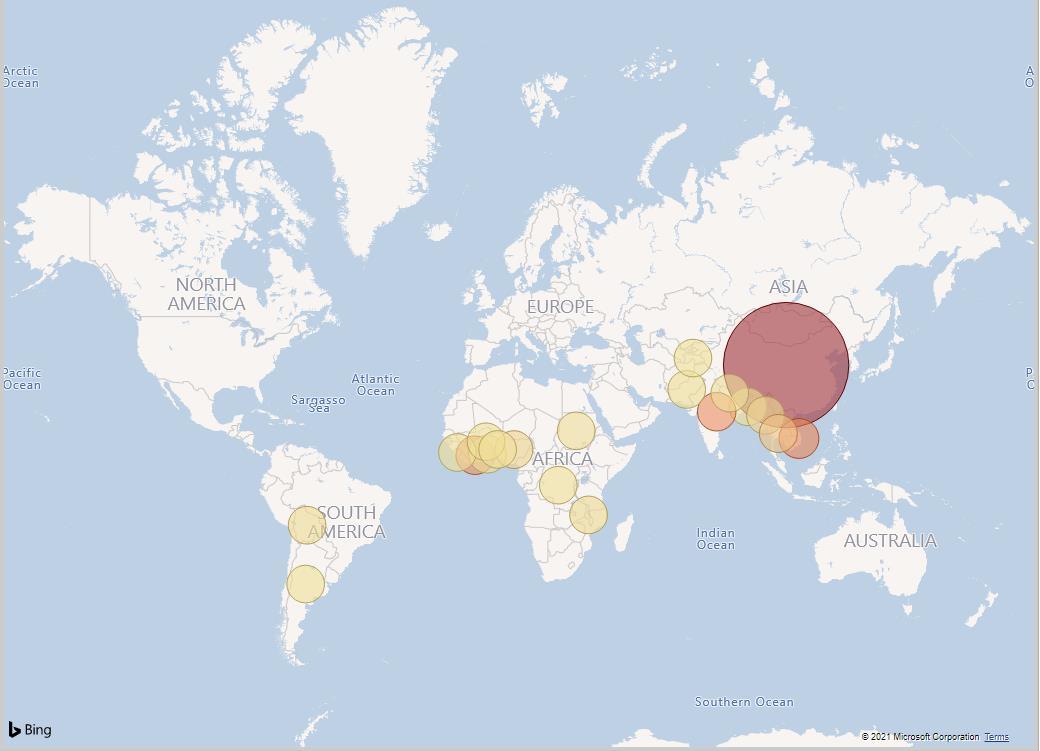
Figure 13: Forced or Indentured Child Labour Bubble Map
An estimated €38.55 billion was the value of imports by the EU produced with forced or indentured child labour in 2019. Figure 13 presents the data of the value of in-scope exported goods to the EU with forced or indentured child labour, where the bubbles’ size and colour vary according to the estimated amount of forced or indentured child labour. The five most prominent exporters of the in-scoped goods to the EU are China (EUR 139.5bn), India (EUR 5.5bn); Viet Nam (EUR 3.7bn), Côte d’Ivoire (EUR 3.1bn), and Nigeria (EUR 517.1M). Four of the beforementioned countries also comprised the top 5 contributors to the forced or indentured child labour value. China accounts for 94.05% of the EUR 38.55bn estimation, Viet Nam 2.48%, India 1.71%, Côte d’Ivoire 0.98%, and Thailand 0.34%. The principal in-scope products imported with forced or indentured child labour were Electronics (EUR 35.1bn), Garments (EUR 1.7bn), Toys (EUR 1.1bn) Cocoa (EUR 435M), and Cotton (EUR 109M), as is depicted in Table 14.
Table 13: Top 10 In-Scope Countries Exporting to the EU with Forced/Indentured Child Labour (Ordered by the Contribution to the Estimated EUR Value of Forced/Indentured Child Labour)
Country In-scope importations (EUR) Estimated value of forced/indentured child labour (EUR)
1. China 2. Vietnam 3. India 4. Côte d'Ivoire 5. Thailand 6. Nigeria 7. Burma 8. Malawi 9. Bolivia 10. Sierra Leone 139,452,666,511 3,674,196,997 5,503,535,602 3,147,419,697 508,937,034 517,098,775 164,853,748 234,146,098 99,446,711 54,283,473 36,257,693,292.86 955,291,219.22 660,424,272.24 377,690,363.64 132,323,628.84 62,051,853.00 42,861,974.48 28,097,531.76 21,878,276.42 6,514,016.76
Table 14: Top 10 In-scope Commodities Exported to the EU with Forced/Indentured Child Labour (Ordered by the Contribution to the Estimated EUR Value of Forced/Indentured Child Labour)
Goods In-scope importations (EUR) Estimated value of forced/indentured child labour (EUR)
1. Electronics 2. Garments 3. Toys 4. Cocoa 5. Cotton 6. Rice 7. Tobacco 8. Stones 9. Brazil Nuts/ Chestnuts 10. Bricks 134,891,109,865 9,162,148,008 4,088,001,417 3,627,123,298 422,303,997 384,054,526 234,146,098 189,072,186 99,439,184 71,102,951 35,071,688,564.90 1,680,416,459.80 1,062,880,368.42 435,254,795.76 108,992,901.86 68,625,926.70 28,097,531.76 22,688,662.32 21,876,620.48 16,514,019.14
Grouping the countries according to the regions indicated by the UN (2020) Methodology M49, Figure 14 shows the value in Euros of the flagged country-commodity pairs imported to the EU with and without forced or indentured child labour. The figure notes that most of the importation flow comes from the Eastern and South-Eastern Asia (EUR 143.8bn), followed by Central and Southern Asia (EUR 5.6bn), Sub-Saharan Africa (EUR 4bn) and last, Latin America and the Caribbean (EUR 100M). There were no products flagged for the Northern Africa and Western Asia region.
Figure 14: Value of In-scope Goods Imported by the EU With/Without Forced or Indentured Child Labour

Concerning the analysis of each region, similar conclusions can be drawn as for the Child Labour dimension. One notable change was that Sub-Saharan Africa went from last position in the Child Labour dimension to third in the current analysed dimension.
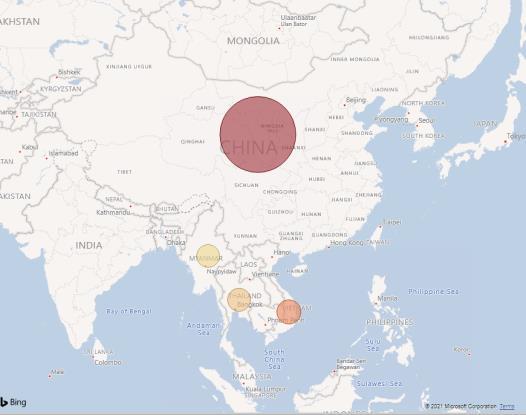
4.1 Eastern and South-Eastern Asia Region Eastern and South-Eastern Asia Region contributes to the aforementioned value with 37.4bn (96.98%). The countries considered were China, Viet Nam, Thailand, and Burma. The hotspot of forced or indentured child labour is concentrated in China, as per Figure 15, contributing with EUR 36.3bn to the total estimation, after which comes Viet Nam with 955.3M, and last the other two countries Thailand 132.3M, and Burma 42.9M. The main in-scope commodities are Electronics, Garments, Toys and Cotton.
Figure 15: Value of In-scope Goods Imported by the EU With/Without Forced or Indentured Child Labour from Countries in Eastern and South-Eastern Asia Region

4.2 Central and Southern Asia In this dimension, the Central and Southern Asia region encompasses five countries, detailed in Figure 16. Nearly 99% of the in-scope importation flow comes from India with EUR 5.5bn, which is also where forced or indentured child labour is most concentrated.
Figure 16: Value of In-scope Goods Imported by the EU With/Without Forced or Indentured Child Labour from Countries in Central and Southern Asia
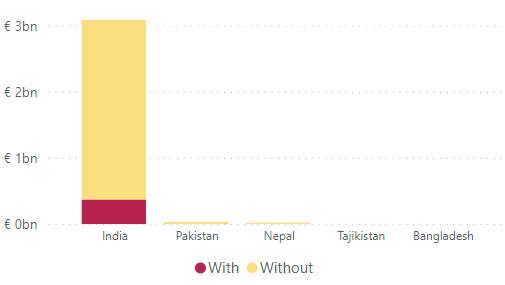

With EUR 660.4M, India alone contributes the most to the estimated EUR value of forced or indentured child labour in the region (a total of EUR 667.2M). The top 5 commodities for the
region are: Garments, Rice, Stones, Embellished Textiles, and Carpets. Next in the country ranking comes Pakistan with 4M, and third Nepal 2.5M.
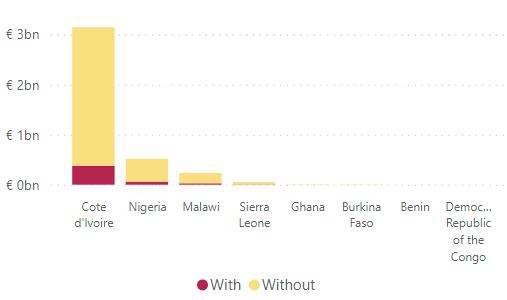
4.2 Sub-Saharan Africa region For the Sub-Saharan Africa region, Figure 17 shows that the hotspot for forced or indentured child labour is in Côte d’Ivoire, contributing with 377M. Second comes Nigeria 62M, third Malawi 28M and forth Sierra Leone 6.5M. Ghana, Burkina Faso, Benin and the DRC did not reach 1% of the total estimated for the region. Regarding commodities, the top five are Cocoa, Tobacco, Diamonds, Coffee and Fish.
Figure 17: Value of In-scope Goods Imported by the EU With/Without Forced or Indentured Child Labour from Countries in Sub-Saharan Africa
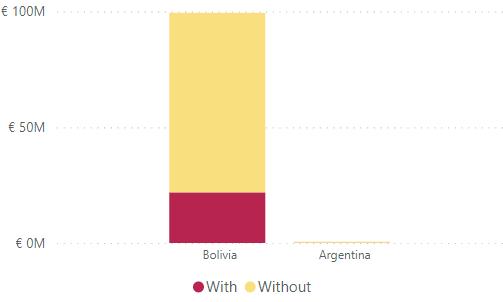
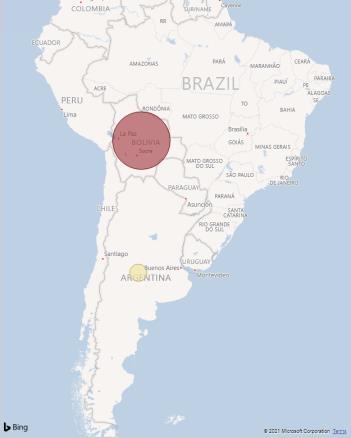
4.2 Latin America and the Caribbean Last, as can be seen in Figure 18, Latin America and the Caribbean features two countries for this dimension: Bolivia and Argentina. Bolivia is the largest exporter, and also the hotspot for forced or indentured child labour, accounting for 99.43% of the estimated value calculated for the region (EUR 22M). There are only 3 commodities contributing to this estimation: Brazil Nuts/Chestnuts (21M), Garments (124K) and Sugarcane (1K).
Figure 18: Value of In-scope Goods Imported by the EU With/Without Forced or Indentured Child Labour from Countries in Latin America and Caribbean