5 minute read
Dimension 2: Quality of the education system


It would be unwise to rely solely on GDP/capita for a number of reasons, the most prominent of which for our purposes is that it fails to capture inequality or the size of the informal economy where many children will find employment. Ideally, one would like measures based on the extent to which households are able to meet their basic needs (Watson, 2014). Many of these are still in the early development stages and are not widely available for many countries – let alone communities – or across multiple years (e.g. Canada’s MBM in: Dufour et al., 2021; Ram, 1982).
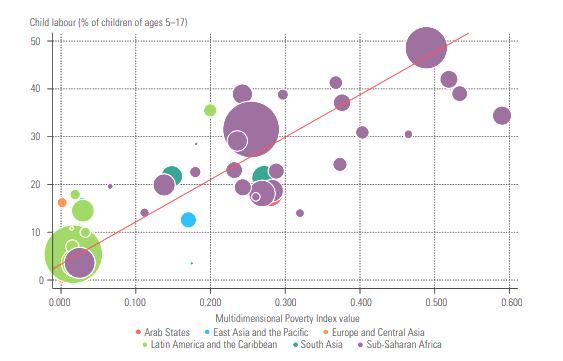
The Alkire and Foster (2011) method used by the Oxford Poverty and Human Development Initiative (UNDP & OPHI, 2020) is perhaps the closest measure available for a large number of countries (growing from 80-107 in the last decade, broken down to 625 subnational areas in 2020). It aggregates ten measures of three dimensions of poverty: 1) health, based on nutrition and child mortality; 2) education, based on school attendance and number of years of schooling; and 3) standard of living, including cooking fuel, sanitation, drinking water, electricity, housing, and assets. As can be seen in Figure 21, there is a strong correlation between multidimensional poverty and child labour (with a coefficient of .86).
Advertisement
Figure 21: Child Labour Prevalency vs. Multidimensional Poverty
Note: N=65, corr=.86(p<0.001). The size of each bubble reflects the size of the population Source: Global Multidimensional Poverty index 2020 – Charting Pathways out of Multidimensional Poverty: Achieving the SDGs, (UNDP & OPHI, 2020), URL
Dimension 2: Quality of the education system
The better the quality of the education system, the more likely it is that parents will choose to send their children to school rather than work. If the schooling system where a particular family lives is non-existent or poor, then it matters very little what alternative policy is
chosen: their child will not be going to school. It makes very little sense then to use penalties in places where the school system is very poor. Put another way, for EU trade policy to have the greatest potential for improving child welfare standards, more energy should be placed on those countries that have better school systems already in place or to improving the education systems in areas with high amounts of child labour. Basu (1999) has also pointed out that a law making education compulsory through the age of 14 is much easier to measure (and therefore enforce) than a law banning child labour.
A number of countries achieved a remarkable increase in school attendance – and some in a very short timeframe. India case in point: While between the years of 1983-2002, the number of Indian children not in school decreased from 25 to 20 million, in just six years from 2002-2008, the number of children not in school dropped from 20 to 4 million (see Figure 22).
Figure 22: India, Children Out of School vs. Income (GDP/capita, PPP, $ Inflation Adjusted)

Source: Gapminder.org; CC-BY
A remarkable decrease in school absenteeism was also witnessed in Indonesia and Ethiopia, whereas Bangladesh made steady progress over a longer stretch of time. As Table 15 also highlights, all of these cases were associated with sustained, multi-year economic growth.
Measuring the quality of education systems, however, is not a simple proposition. A seminal paper by Harvey and Green (1993) points out that educational systems have multiple purposes – such as preparing people for the workforce, spreading and defending cultural norms and values, preparing children for adulthood, and teaching people how to learn throughout their lives – and multiple ways of identifying a “quality” system, be that value for money efficiency, accurate sorting of students, high average scores on a standardised test, or personal transformation. Spaull and Taylor (2012) point out that most measures have either focused on access (enrollment) or on quality (some combination of inputs and outputs), but exceptionally few consider both.
Table 15: Decrease in School Absenteeism, Country Examples
Country
India
Indonesia
Decrease in school absenteeism 20 to 4 million (-16 million) 5.4 to 0.6 million (-4.8 million) GDP per capita, PPP, inflation adjusted 37% growth ($2850-$3910) 27% growth ($2690-$3420)
Bangladesh 5 to 0.4 million (-4.6 million) 56% growth ($1270-$1990)
Ethiopia
6 to 3 million (-3 million) 37% growth ($677-$928)
Source: Gapminder.org, CC-BY Timeframe
2002-2008
1975-1983
1987-2006
2004-2008
To be brief, families need physical access to schools, including both geographic distance and cost dimensions. Instruction needs to be in a language the child understands and there needs to be sufficient supplies and inputs, including teachers who are trained both in subject matter and in pedagogy. Quality educational systems will produce learners capable of performing certain skills, particularly basic literacy and numeracy. Quality systems will be more valued by parents that already have higher rates of education themselves, so quality education systems may take generations to develop. They will also be more valued if there are higher-paying jobs that specifically demand the skills being taught in schools and families feel there is a chance their children could have access to these types of jobs. System administrators will also need to consider that the needs of students may differ by gender, minority status, income, and disability.
Getting measures on all these dimensions, or even some, is remarkably difficult. UNESCO’s September 2020 data update contains a large Excel file that lists the years that different measures of educational quality are available by country (UNESCO Institute for Statistics [UIS], n.d.). In Kenya, for example, over half of the 561 proposed measures for Sustainable Development Goal 4 have never been measured and some, like the percent of students who finished particular milestones, have not been measured in the last ten years. In Mexico – a country with six times the GDP/capita of Kenya – over 100 indicators have never been measured, many have only been measured once, and the vast majority have not been updated since 2018. Even that is doing much better than the United States, UK, France, or Germany which can boast over 340 missing indicators each and statistics that have not been updated since 2015. In fact, the average indicator of educational quality has 124 missing observations out of 229 countries. 188 countries have never measured what percent of the population has a minimum level of literacy.
These difficulties suggest a few points. First, most governments simply are not collecting data on educational quality consistently. To the extent the EU can encourage governments, including member governments, to collect and report data on educational quality, it will be easier to identify where the gaps are to improve child welfare and reduce child labour. Second, it will be difficult to craft trade conditionalities based on improved educational outcomes (as a sign of reduced child labour) if those outcomes are not being measured. Third, this highlights why GDP/capita is one of the first measures to be used, because other measures simply are not widely available or updated in a timely fashion.


