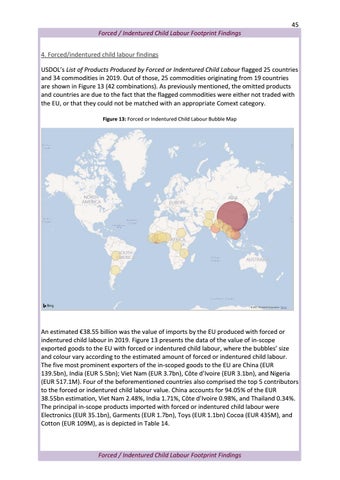
45 Forced / Indentured Child Labour Footprint Findings 4. Forced/indentured child labour findings USDOL’s List of Products Produced by Forced or Indentured Child Labour flagged 25 countries and 34 commodities in 2019. Out of those, 25 commodities originating from 19 countries are shown in Figure 13 (42 combinations). As previously mentioned, the omitted products and countries are due to the fact that the flagged commodities were either not traded with the EU, or that they could not be matched with an appropriate Comext category. Figure 13: Forced or Indentured Child Labour Bubble Map
An estimated €38.55 billion was the value of imports by the EU produced with forced or indentured child labour in 2019. Figure 13 presents the data of the value of in-scope exported goods to the EU with forced or indentured child labour, where the bubbles’ size and colour vary according to the estimated amount of forced or indentured child labour. The five most prominent exporters of the in-scoped goods to the EU are China (EUR 139.5bn), India (EUR 5.5bn); Viet Nam (EUR 3.7bn), Côte d’Ivoire (EUR 3.1bn), and Nigeria (EUR 517.1M). Four of the beforementioned countries also comprised the top 5 contributors to the forced or indentured child labour value. China accounts for 94.05% of the EUR 38.55bn estimation, Viet Nam 2.48%, India 1.71%, Côte d’Ivoire 0.98%, and Thailand 0.34%. The principal in-scope products imported with forced or indentured child labour were Electronics (EUR 35.1bn), Garments (EUR 1.7bn), Toys (EUR 1.1bn) Cocoa (EUR 435M), and Cotton (EUR 109M), as is depicted in Table 14.
Forced / Indentured Child Labour Footprint Findings


