36 Child Labour Footprint Findings 3. Child labour footprint findings The USDOL List of Goods flagged 74 countries, 145 commodities, and a total of 395 combinations (country-commodity) produced with child labour in its last publication covering for years 2019-2020. Out of those, the results of 102 commodities from 66 countries are displayed in Figure 6 (280 combinations). The omitted products and countries are due to excluded commodities, whether because there was no importation of the flagged commodity to the EU from the selected country, or they could not be matched with a Comext category.11 As the study is focused on importation flows outside of geographical Europe, Ukraine was not considered (as the only in-scope country as per the USDOL List of Goods).
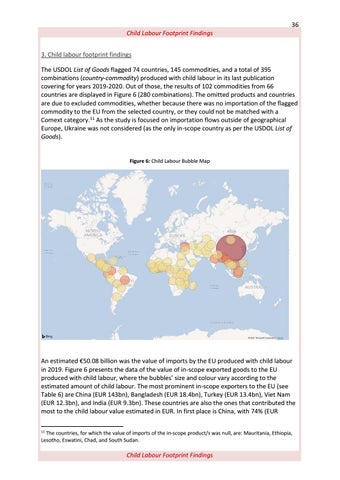
Figure 6: Child Labour Bubble Map
An estimated €50.08 billion was the value of imports by the EU produced with child labour in 2019. Figure 6 presents the data of the value of in-scope exported goods to the EU produced with child labour, where the bubbles’ size and colour vary according to the estimated amount of child labour. The most prominent in-scope exporters to the EU (see Table 6) are China (EUR 143bn), Bangladesh (EUR 18.4bn), Turkey (EUR 13.4bn), Viet Nam (EUR 12.3bn), and India (EUR 9.3bn). These countries are also the ones that contributed the most to the child labour value estimated in EUR. In first place is China, with 74% (EUR 11
The countries, for which the value of imports of the in-scope product/s was null, are: Mauritania, Ethiopia, Lesotho, Eswatini, Chad, and South Sudan.
Child Labour Footprint Findings


