
ABSTRACT
The aim of this is experiment was to explore the principles of multi objective optimisation as well as to develop an understanding of their application in design primarily through the development of towers using the Wallacei engine.
The given case study in order to execute the above experiment was the Shard situated in London. The Shard is a mixed use tower located in an urban context, next to the Tower Bridge Station. The region experiences large footfalls. Hence, there is a considerable amount of need to drive the pedestrian traffic inside the public spaces of the tower. Hence, creating public concourses became crucial for this experiment in order to respond to the urban context. Also, London experiences extreme heat in months of summer and extreme cold in the months of winter. Hence, creating a morphology to optimise for both summer and winter months became a challenge.
Hence, the fitness objectives were based on enhancing the architectural functionality with response to the context and climatic responsiveness of the building morphology. However, the simulation’s accuracy was based on defining the adequate relationship between the chromosomes defined in the body plan and the fitness criterias framed, in order to commence the onset of the genetic traits that lead to optimised simulation. Hence, formulating accurate strategies was extremely crucial based on trial and error methods. Although several trial and errors were conducted, defining the accurate relationship between the fitness objectives and gene pool was still challenging .
INTRODUCTION
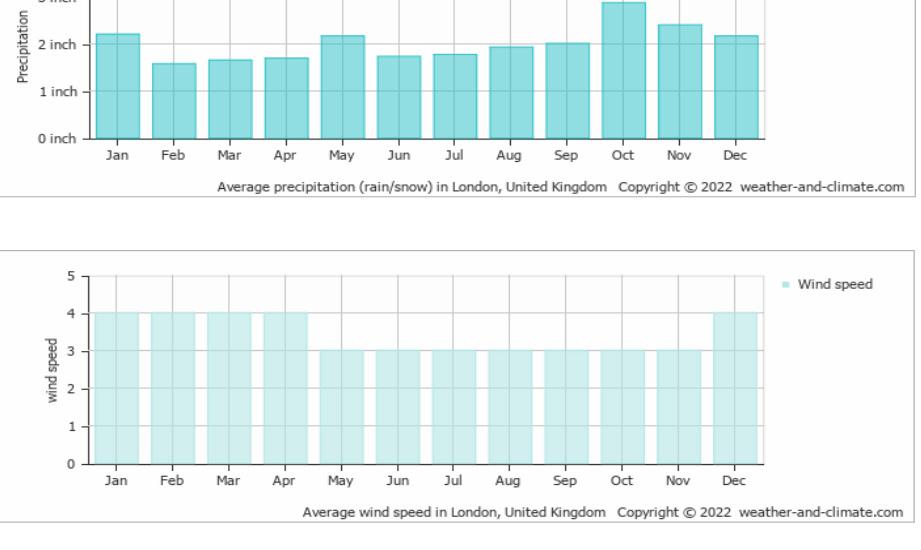
The site assigned to conduct the Multiobjective Evolutionary Computational experiment for the tower morphology was The Shard, London,located in an Oceanic Biome which is characterised by extremely high temperatures in summer and extremely low temperatures in winter with moderate precipitation throughout the year. The Shard, also known as the London Bridge Tower, is a 72-storey, mixed-use tower located beside London Bridge Station on the south bank of the River Thames.
https://www.bbc.co.uk/weather/2643743
https://www.bbc.co.uk/weather/2643743
https://www.bbc.co.uk/weather/2643743
https://www.bbc.co.uk/weather/2643743
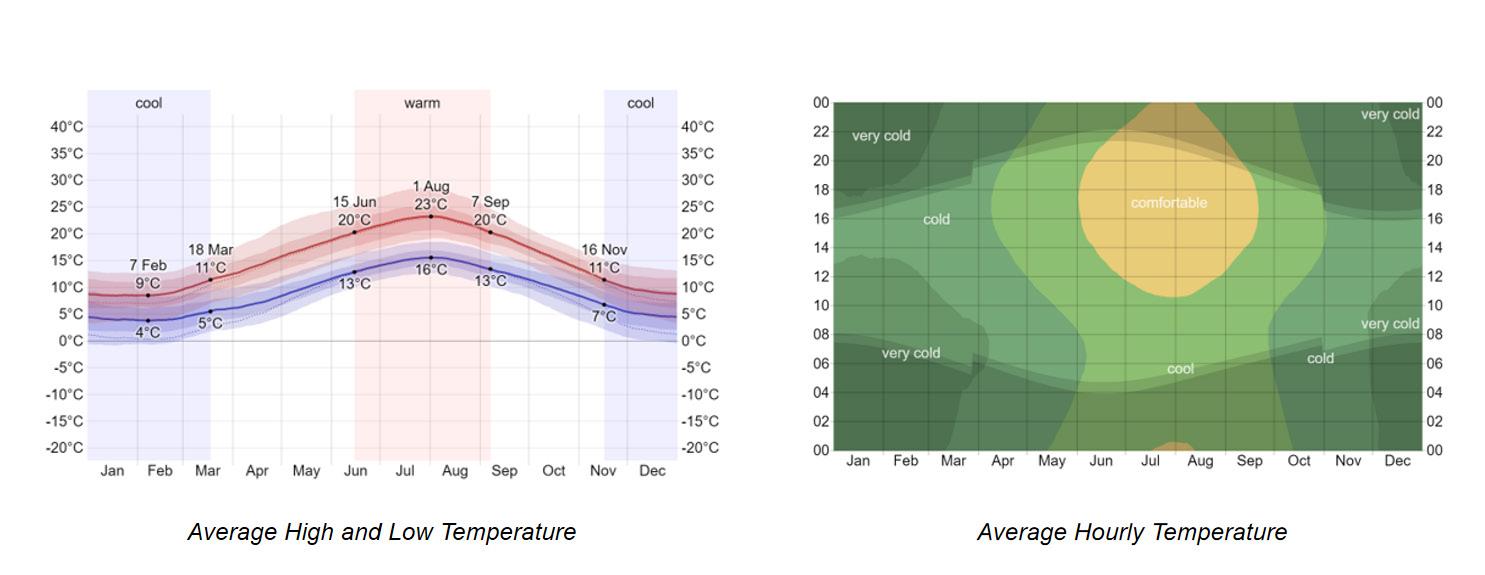 Figure 4 - Weather Chart - London
Figure 3 - Weather Chart - London
Figure 2 - Weather Chart - London
Figure 1 - Weather Chart - London
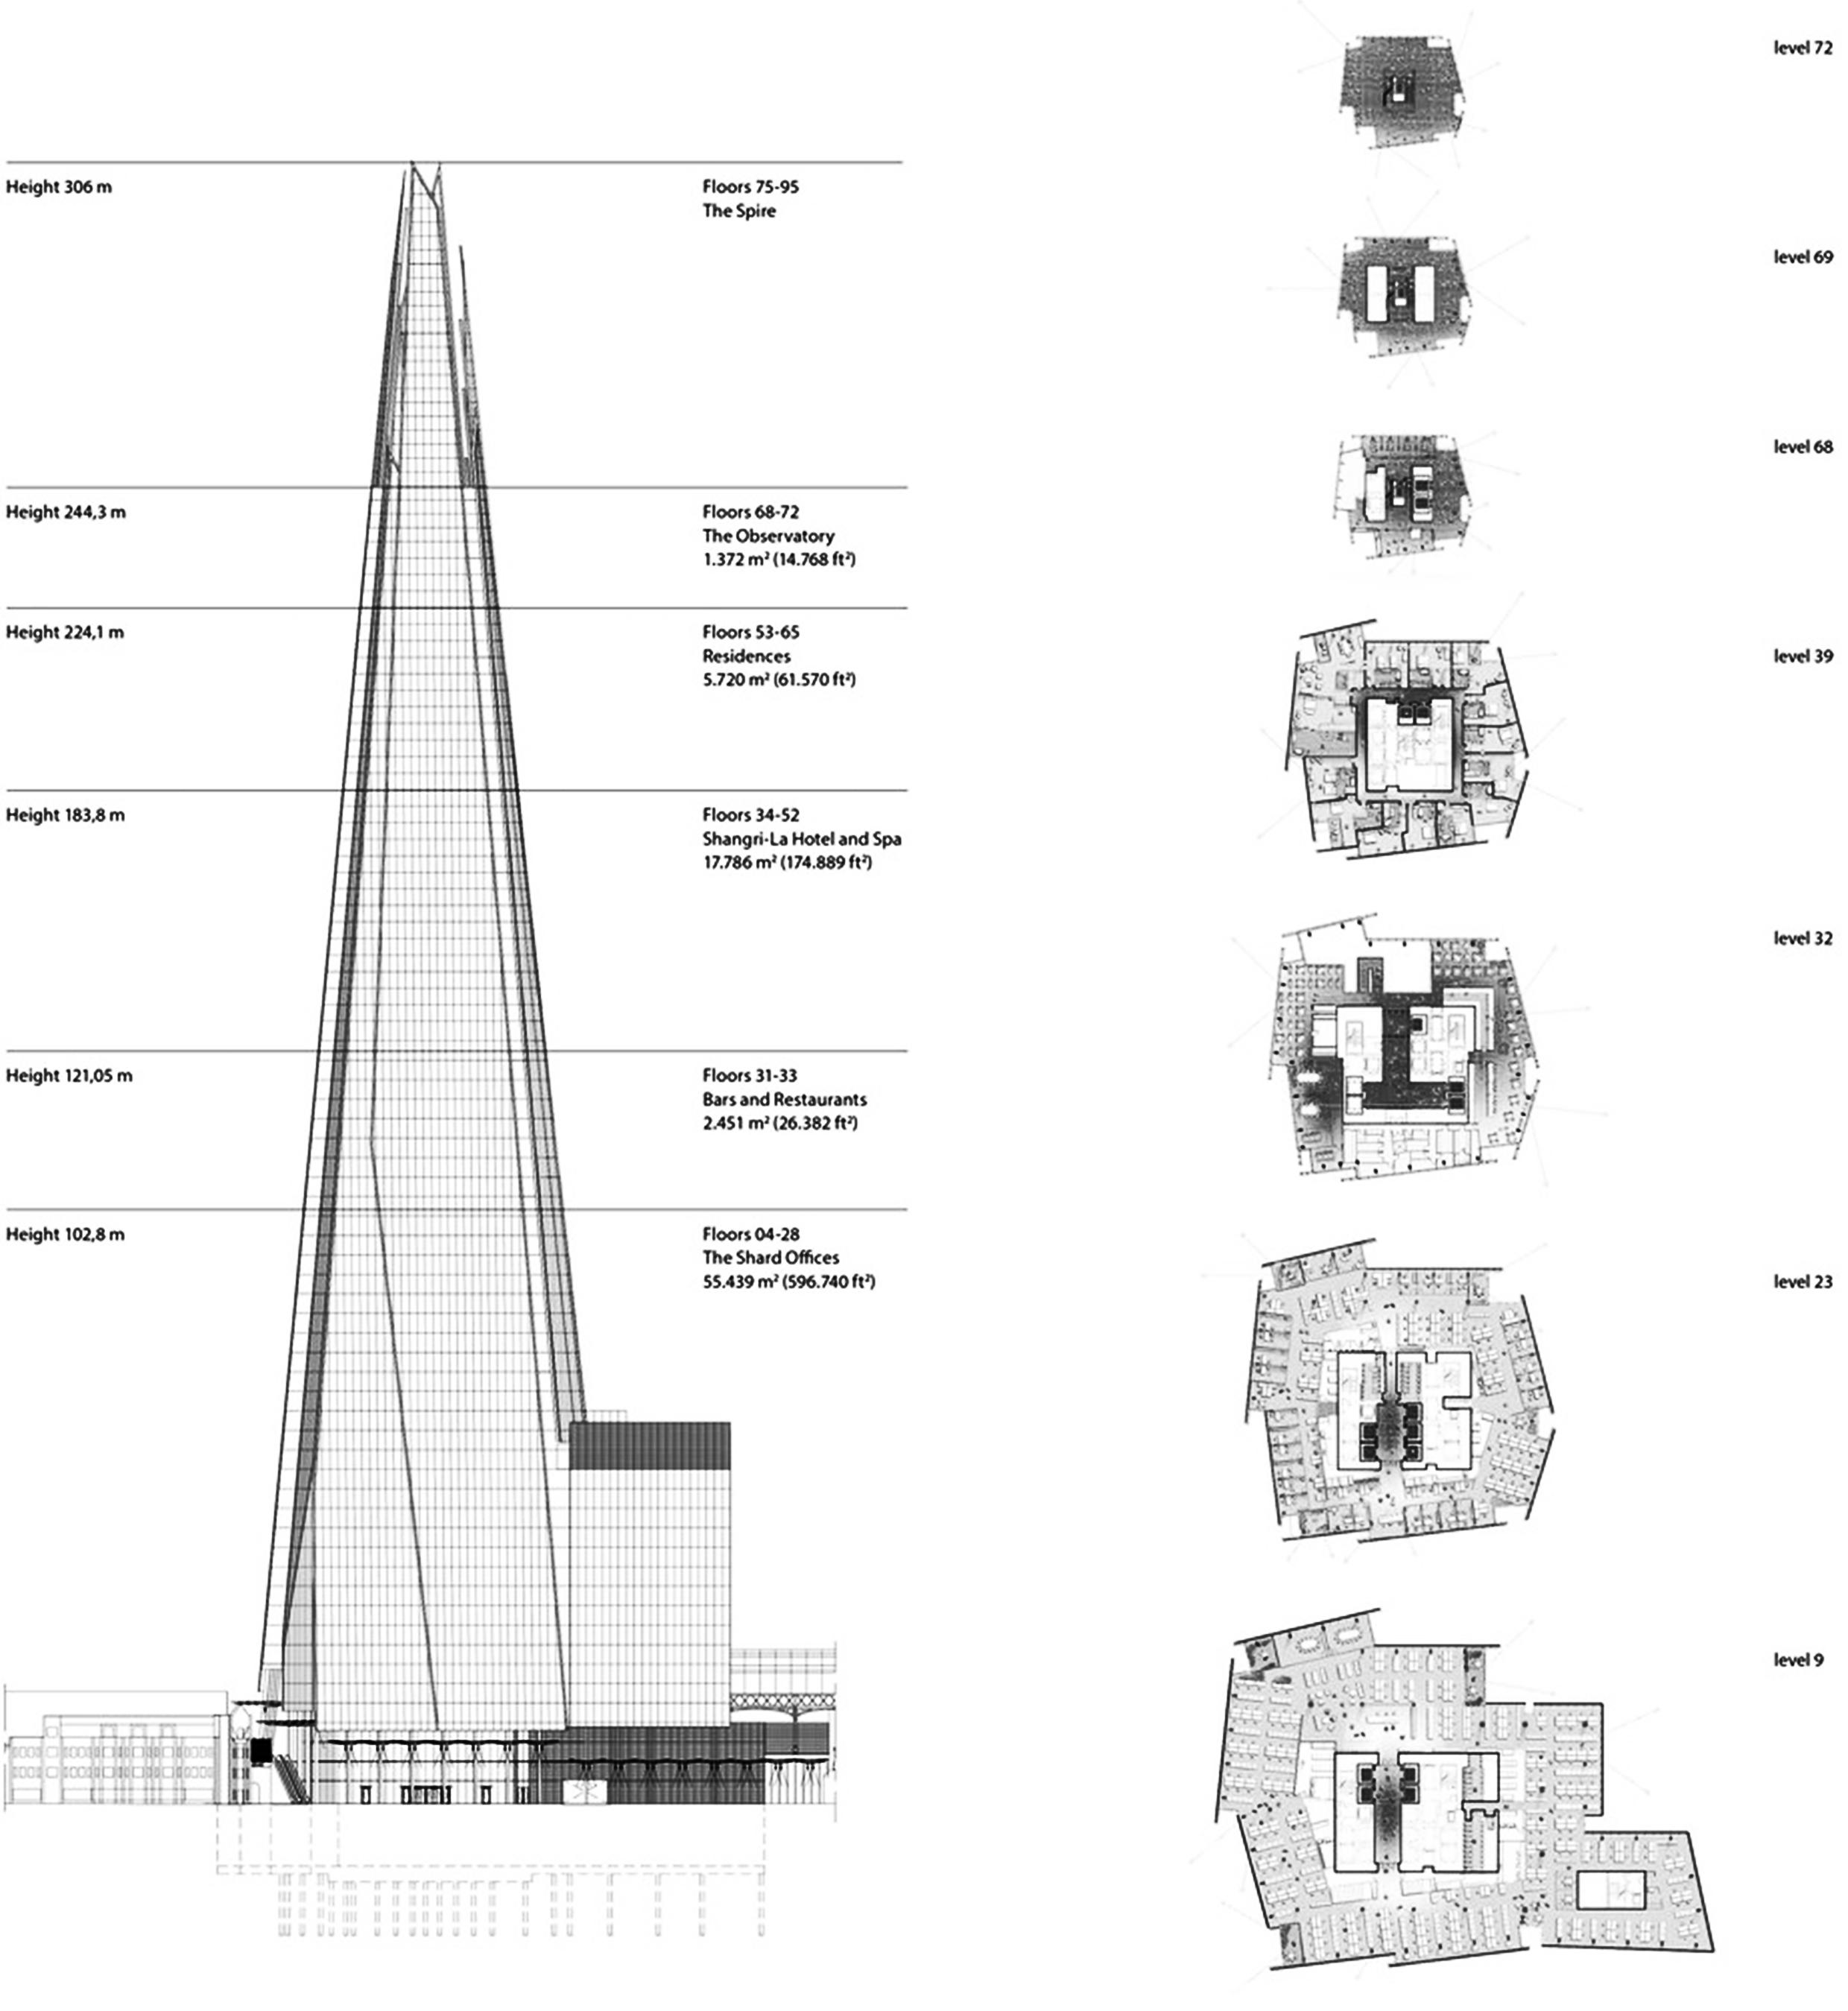
This project was a response to the urban vision of London Mayor Ken Livingstone and to his policy of encouraging high-density development at key transport nodes in London. This sort of sustainable urban extension relies on the proximity of public transportation, discourages car use and helps to reduce traffic congestion in the city.The mixed-use tower houses offices, apartments, a hotel and spa, retail areas, restaurants and a 15-storey public viewing gallery.Planned as a “vertical city” to address the city’s growing population and need to maximise space, the Shard’s program varies to provide a functional central structure for London. The ground level includes a public piazza with restaurants and cafes, in addition to areas for art installations. The 50,000 sqm of office spaces include naturally ventilated galleries while the 195 hotel rooms and exclusive apartments located on the upper floors showcase beautiful views. The building also caters to the public with viewing platforms on floors 68-72. Accessed directly from an entrance on the ground level, these viewing galleries attract over half a million visitors each year.
To further the morphological development of the tower in order to enhance its architectural performance. The multi-objective design agendas were strategised which were to maximise the mixed use functionality of The Shard, maximise public influx in the site,maximise visibility to the public,facilitate social interaction and create a habitable micro climate corresponding to the extreme weather conditions in summers and winters.The conducted research was based on exercising the application of principles of multi objective Optimisation.The challenge was to define and redefine the set of fitness objectives that would lead to just adequate optimisation, with developing the understanding of crucial relationship between the chromosomes controlling the tower morphology and the defined fitness objectives.
DESIGN OBJECTIVES

Aim : To conduct multi objective evolutionary simulation on the given case study - the Shard, in order to enhance its architectural performance, informed by functional and environmental parameters.
Fitness Objectives and Body Plan : An octagonal plan (figure 6) was formulated for the building morphology in order to maximise the views. The building morphology was split in three volumes, in order to create urban corridors. The originally existing central core was also considered to be split in two. The second goal was creating double courtyards- North Courtyard for extreme summer months, and South Courtyard for extreme winter months. Another goal was to minimise the wind impact on the tall building morphology.
Fitness Criteria : Following fitness criterias (figure 7) were devised in order to run the multiobjective simulation. Maximising floor plate area to utilise adequate space. Minimising shaded region on the ground (figure 10), and minimising self shading on the building morphology (figure 9), prioritising requirement of sunlight in winter months. Minimising wind vector hits on the tall building morphology.
Gene Pool
In order to instigate the formation of courtyards, chromosomes that controlled the scaling of the floor plates were devised for Volume 1 and Volume 3(figure 6). Another set of chromosomes that generated the movement of floor plates in x and y direction were added(figure 7).
In order to minimise the wind influence (figure 8), a few chromosomes that induced tapering and rotation of the floor plates were added. To avoid destruction from wind , chromosomes that induced smoothening of the sharp corners of the floor plates,puncturing void that is deletion of floor plates were added for the Volume 2, so that air would flow through the structure with ease. Lastly chromosomes that induced corrugation were added in order to create self shading on the building morphology.
Figure 6 - Diagram representing Development of morphology Body Plan Primitive Maximising views Creating Urban Corridors Creating courtyardsMORPHOLOGY GENEALOGY
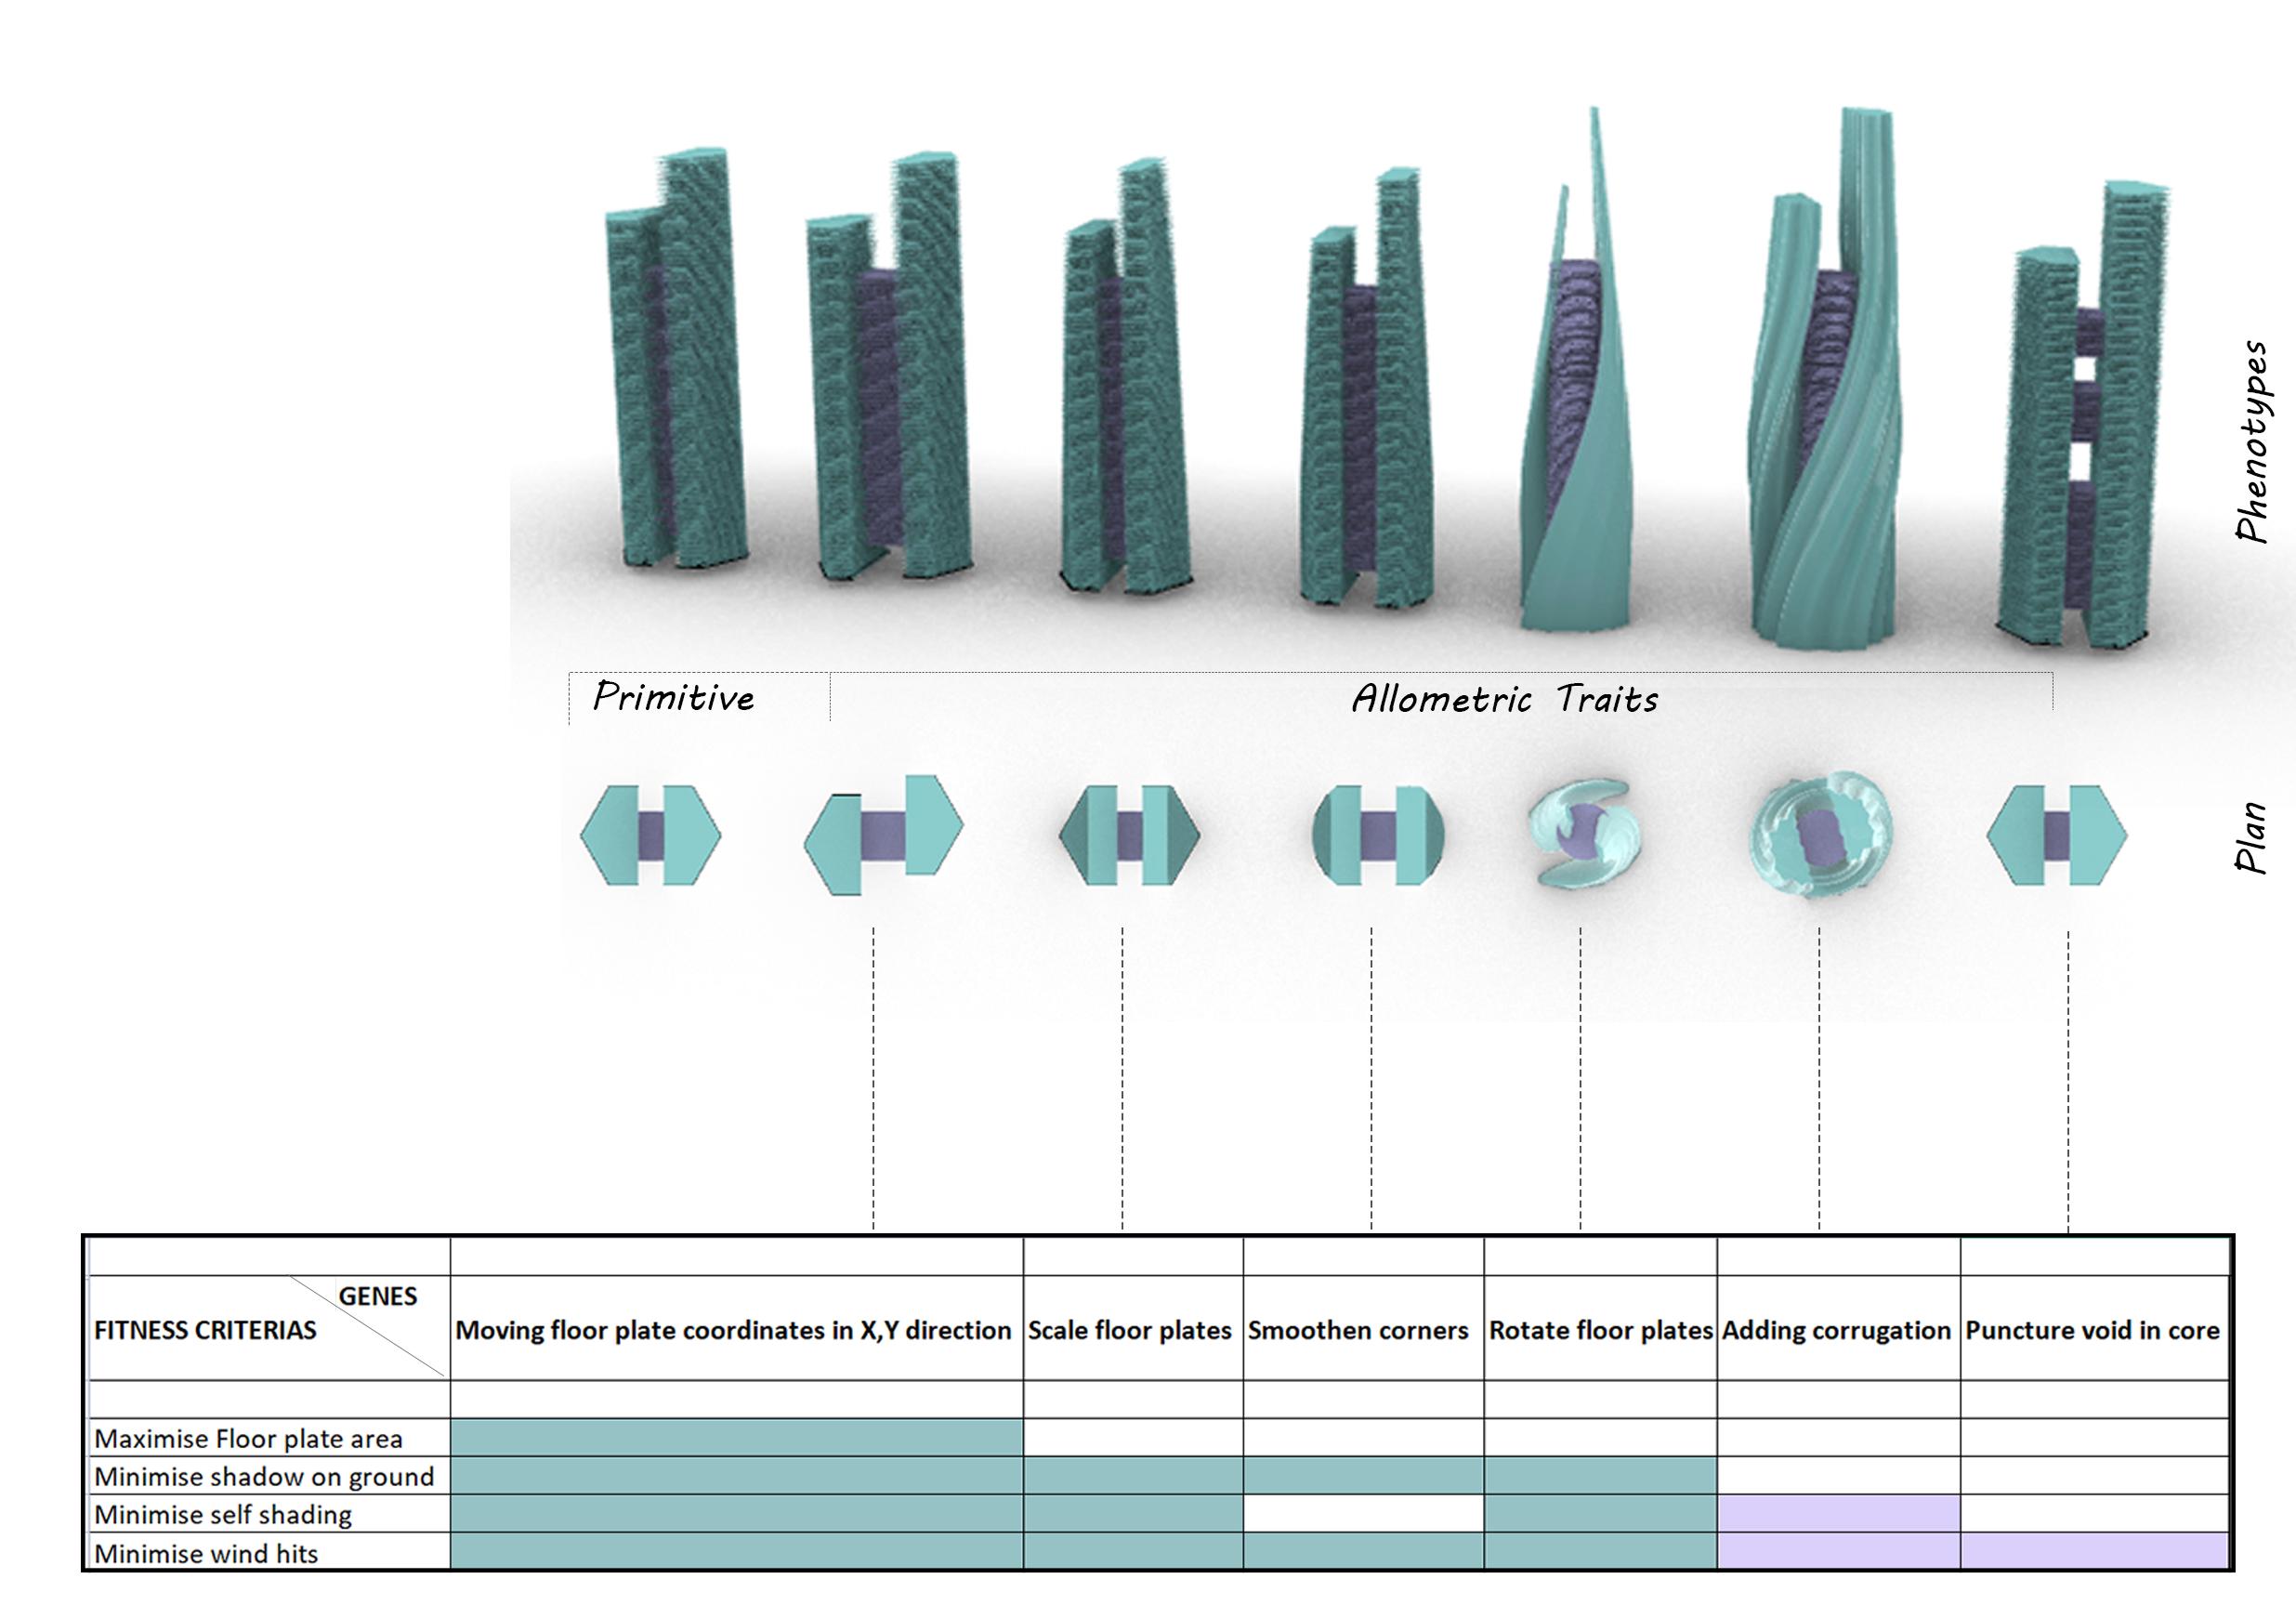
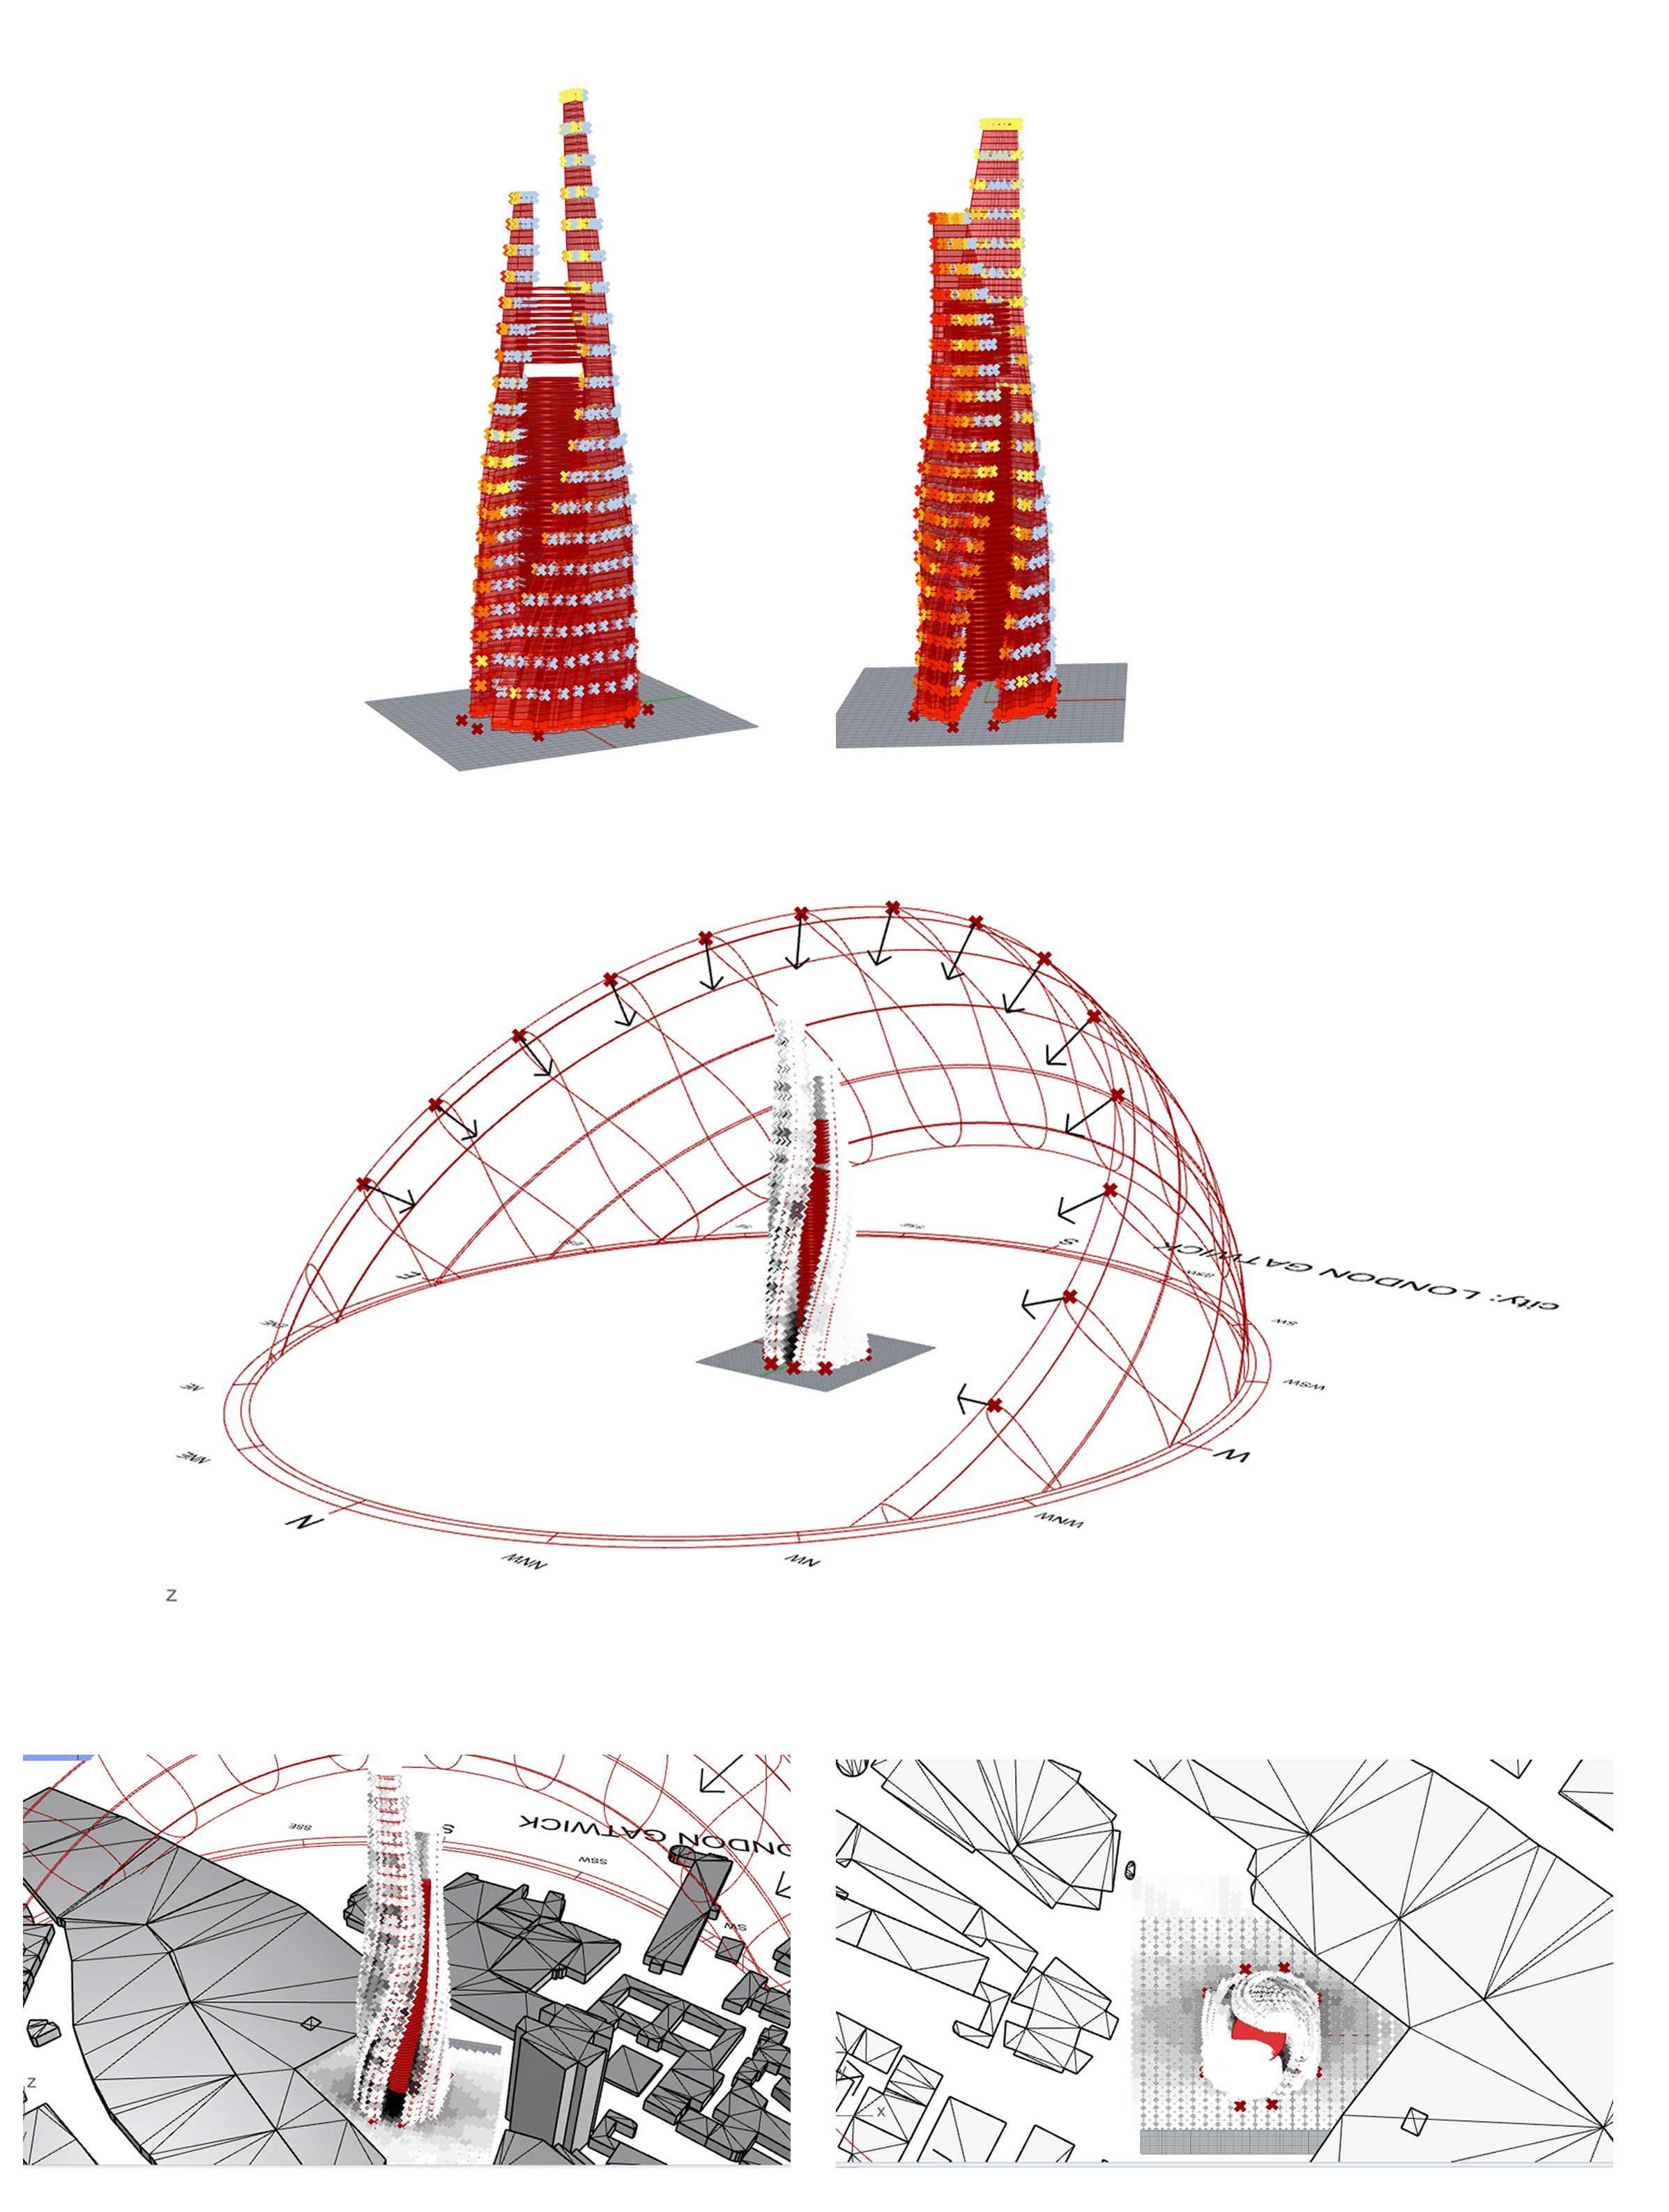 Figure 8 - Diagram representing the calculation of wind vector hits against the building morpholo-
Figure 9 - Diagram representing the calculation of self shading on the building morphology
Figure 10 - Diagram representing the calculation of shading on the ground casted by the building morphology
EVOLUTIONARY PROCESS
TRIAL 1
A first set of experiments with a greater number of fitness criterias that is five in number (figure 11) was run initially consisting of 20 generations of 20 individuals each. In the initial experiments the fitness criterias considered were : maximising sunlight gain, maximising volume, and maximising floor plate area. After reading from the parallel coordinate plot it was realised that these objectives could be clubbed under one category as all of them influenced each other proportionately.Where as, minimising surface area and minimising wind vector hits could be clubbed under one category as they simulated towards producing one common objective.
TRIAL 2
Hence, the simulation was run with the revised fitness criterias as shown in the evolutionary matrix(figure 7).The purpose of this part of the Stage was to explore the potential of Wallacei/GH plugin within Rhino to simulate a genetic experiment for the evolution of Towers. For the trial number 2 the simulation time was estimated to be run for extremely long hours by Wallacei engine. Hence, it was crucial to restrict the domain of genes. The chromosomes that affected the degree of rotation and the degree of corrugation were restricted as they induced complexity in the phenotypes of the building morphology. After the gene alteration process, another test of a simulation of 20 generations of 20 individuals each was run. As the fitness criterias were adequately contradicting each other, observed from the mean trendline graphs from Wallacei analytics; the simulation was run for optimisation of 100 generations each with a population of 50 individuals.
GENERATION 20
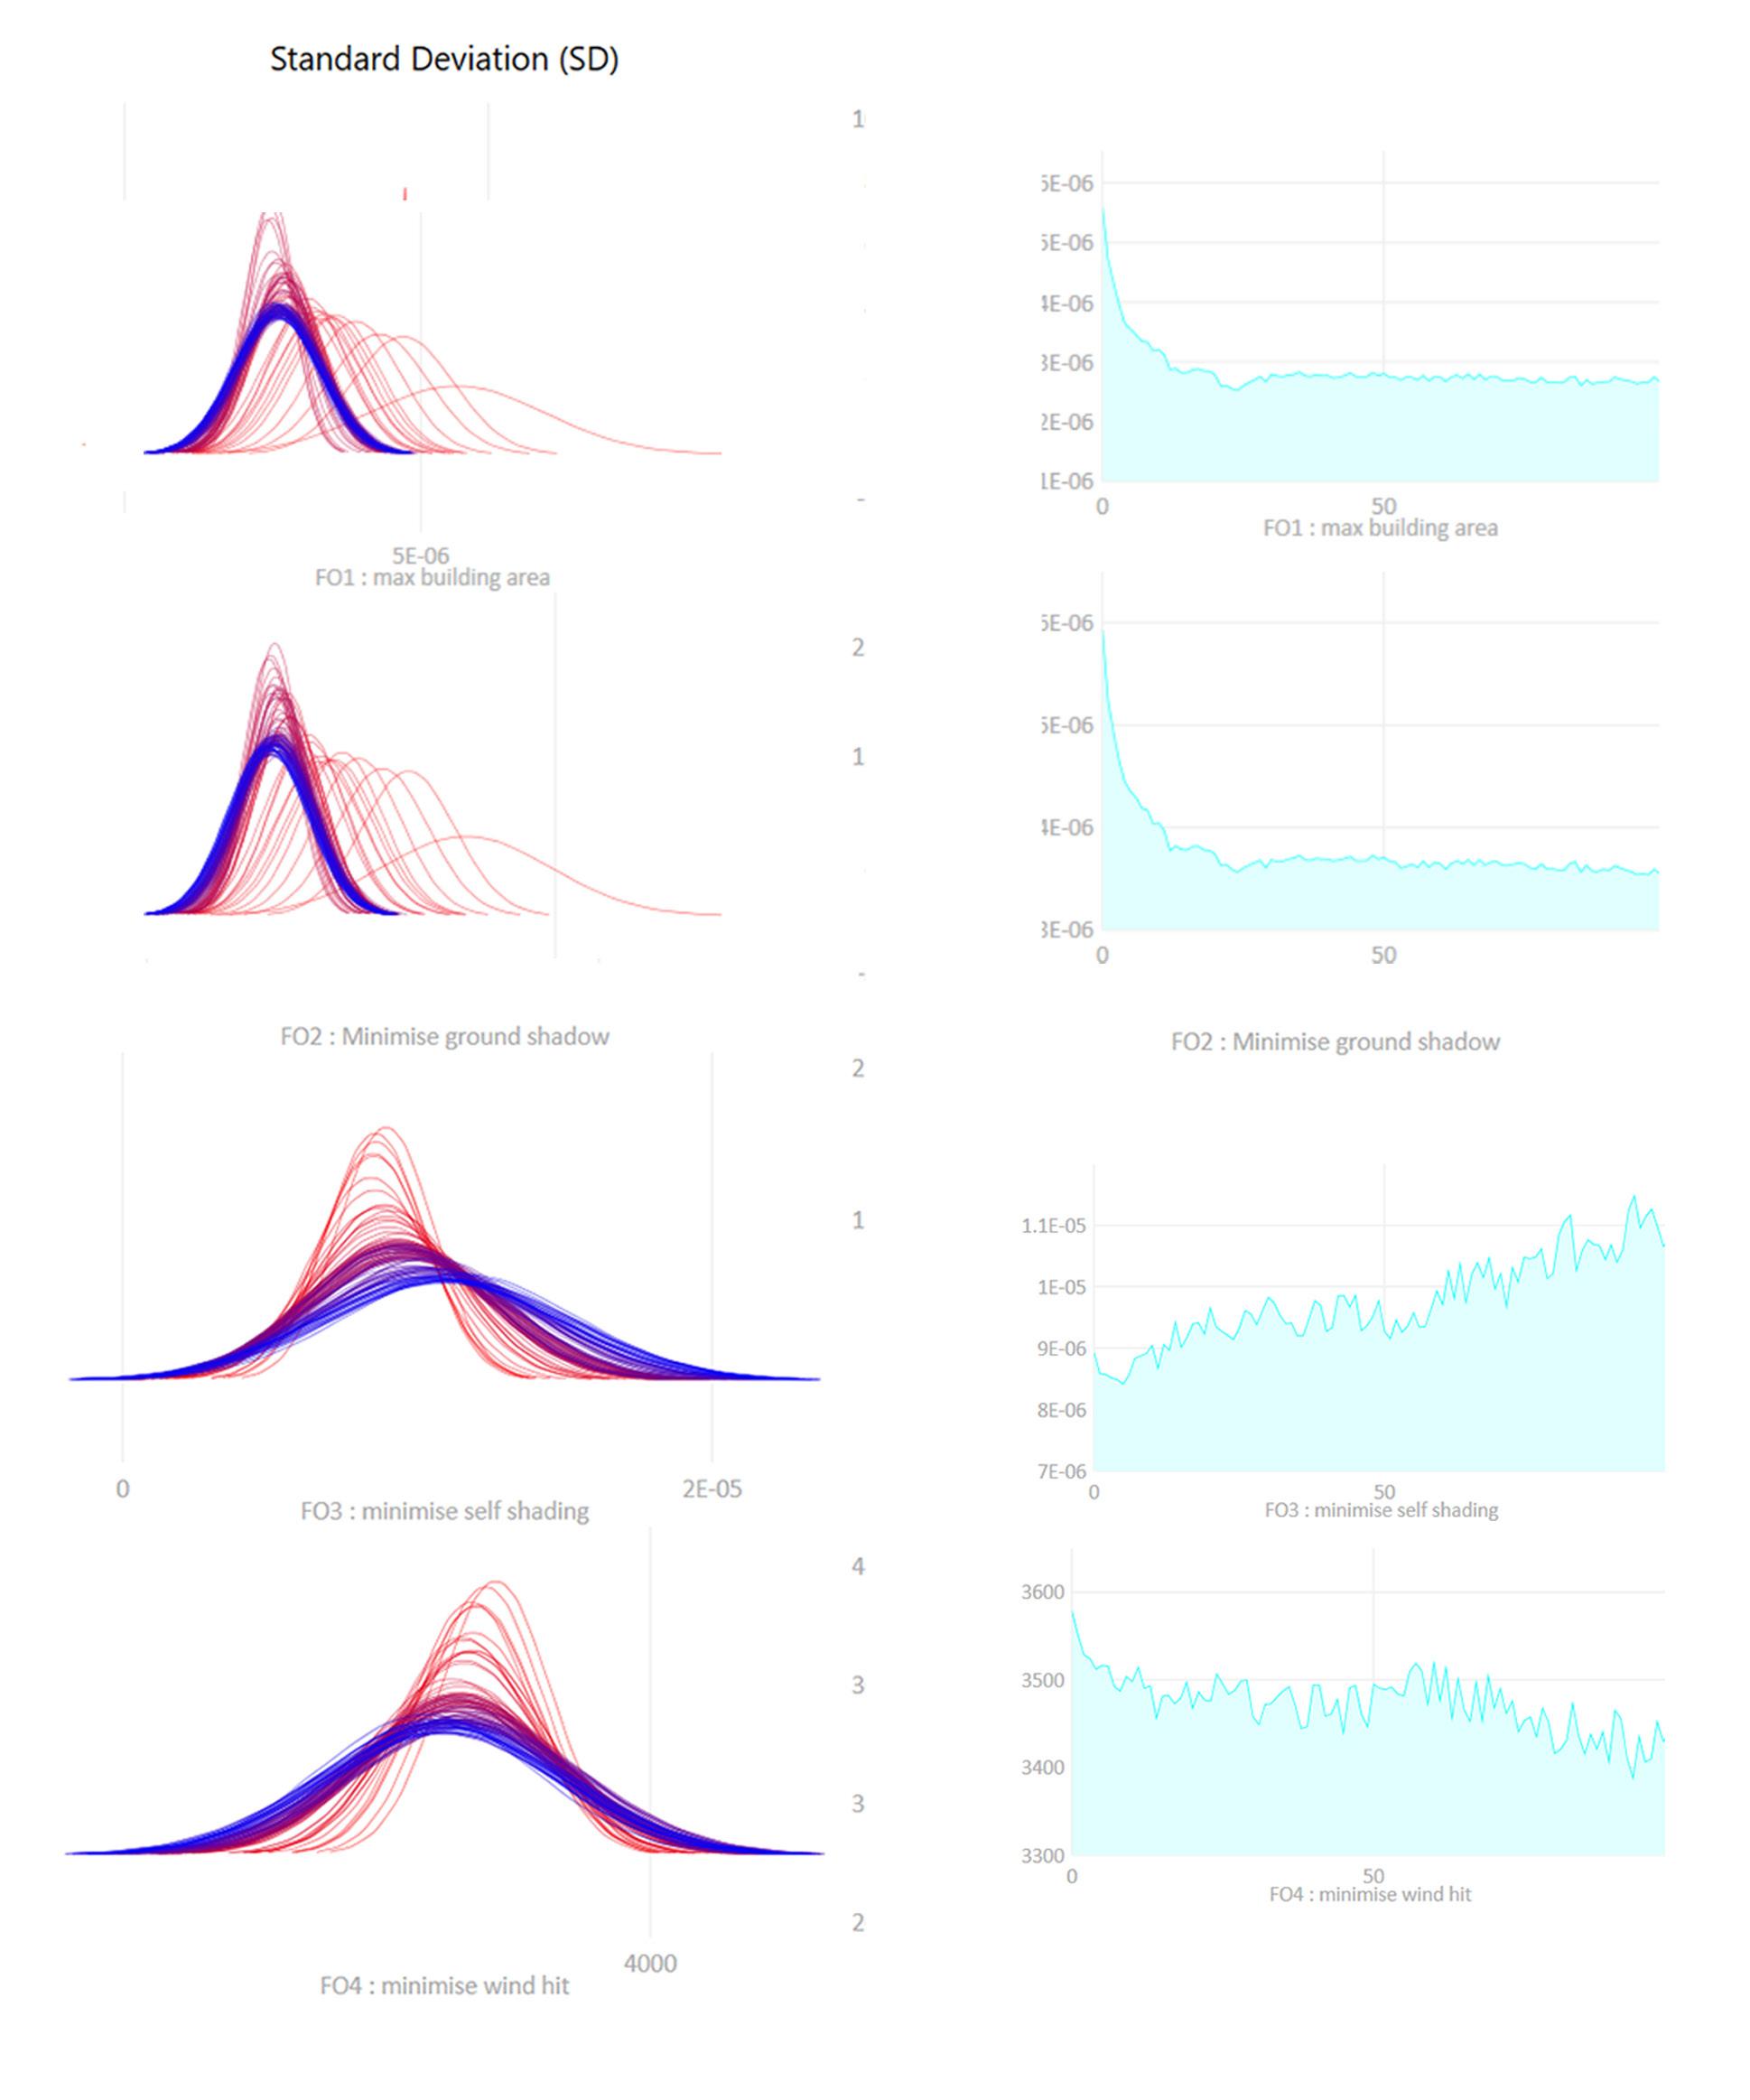
The simulation was analysed for generation 20 (figure 12). The chromosomes that affected the maximisation of the floor plate area were affected by increase in the corrugation that increased the area of the floor plates. The other chromosomes that induced smoothening of the corners, scaling down of floor plates, and puncture in the floor plates simulated a decrease in the area of floor plates of the building morphology. Although all the fitness criterias except fitness criteria three were optimising towards the minimal value away from the mean trendline. (figure 13)The generation had similar individuals with almost similar corrugation patterns and volumetric configuration.
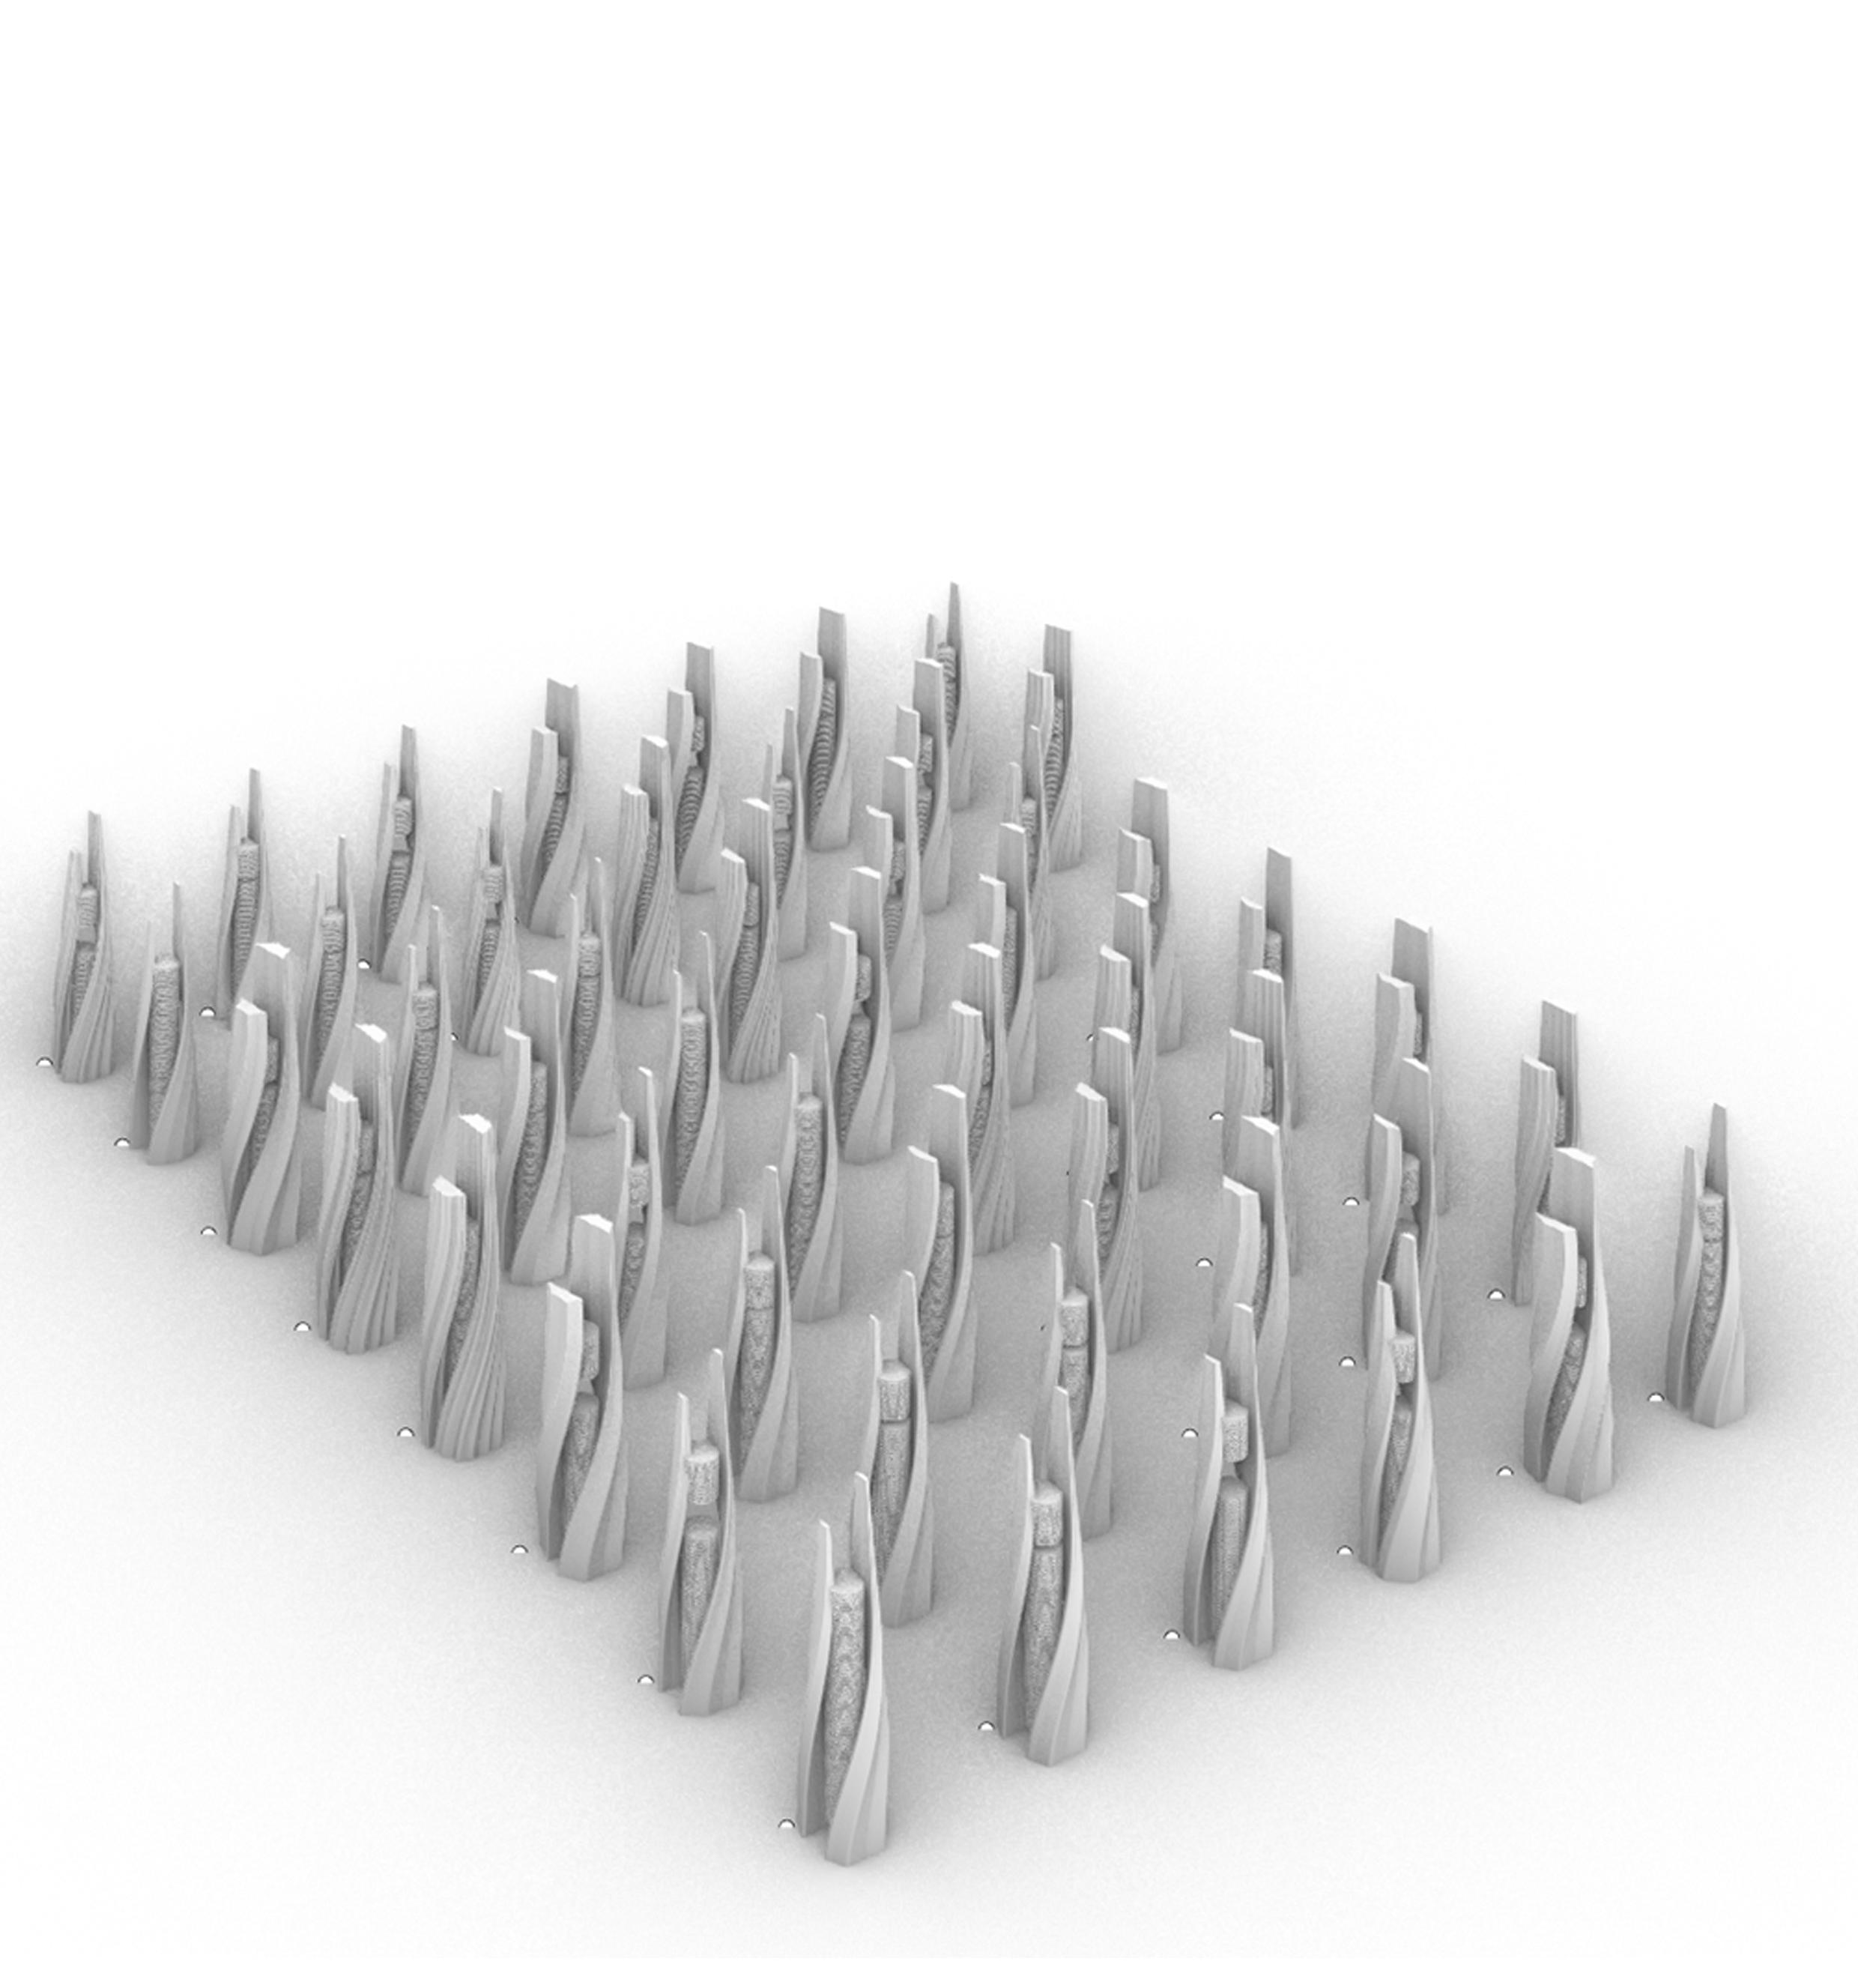 Figure 12 - Diagram representing the generation 20
GENERATION 60
The simulation was analysed for generation 60 (figure 14). It was observed that all the fitness criterias except FC3 were optimising towards the minimal value away from the mean trendline.(figure 15) Although, fitness criterias -Minimising shading on ground, minimising shading on the ground and minimising wind vector hits synthesised more slender forms. The chromosomes affecting the same fitness criterias were also larger in number as compared to the chromosomes affecting the increase in floor plate area. However, it was hypothesised that more corrugation would induce more self shading, but in contrast it simulated the increase in the surface area, simulating non optimisation of fitness criteria 3.Also, the methodology for the calculation of the wind vector hits was not proposed to be relative to the surface area. This was one of the major limitations faced in defining the relationship between the chromosomes affecting the corrugation and the calculation of wind vector hits. However, fitness criteria optimised due to the deletion of corrugation as a trait in order to achieve the same.
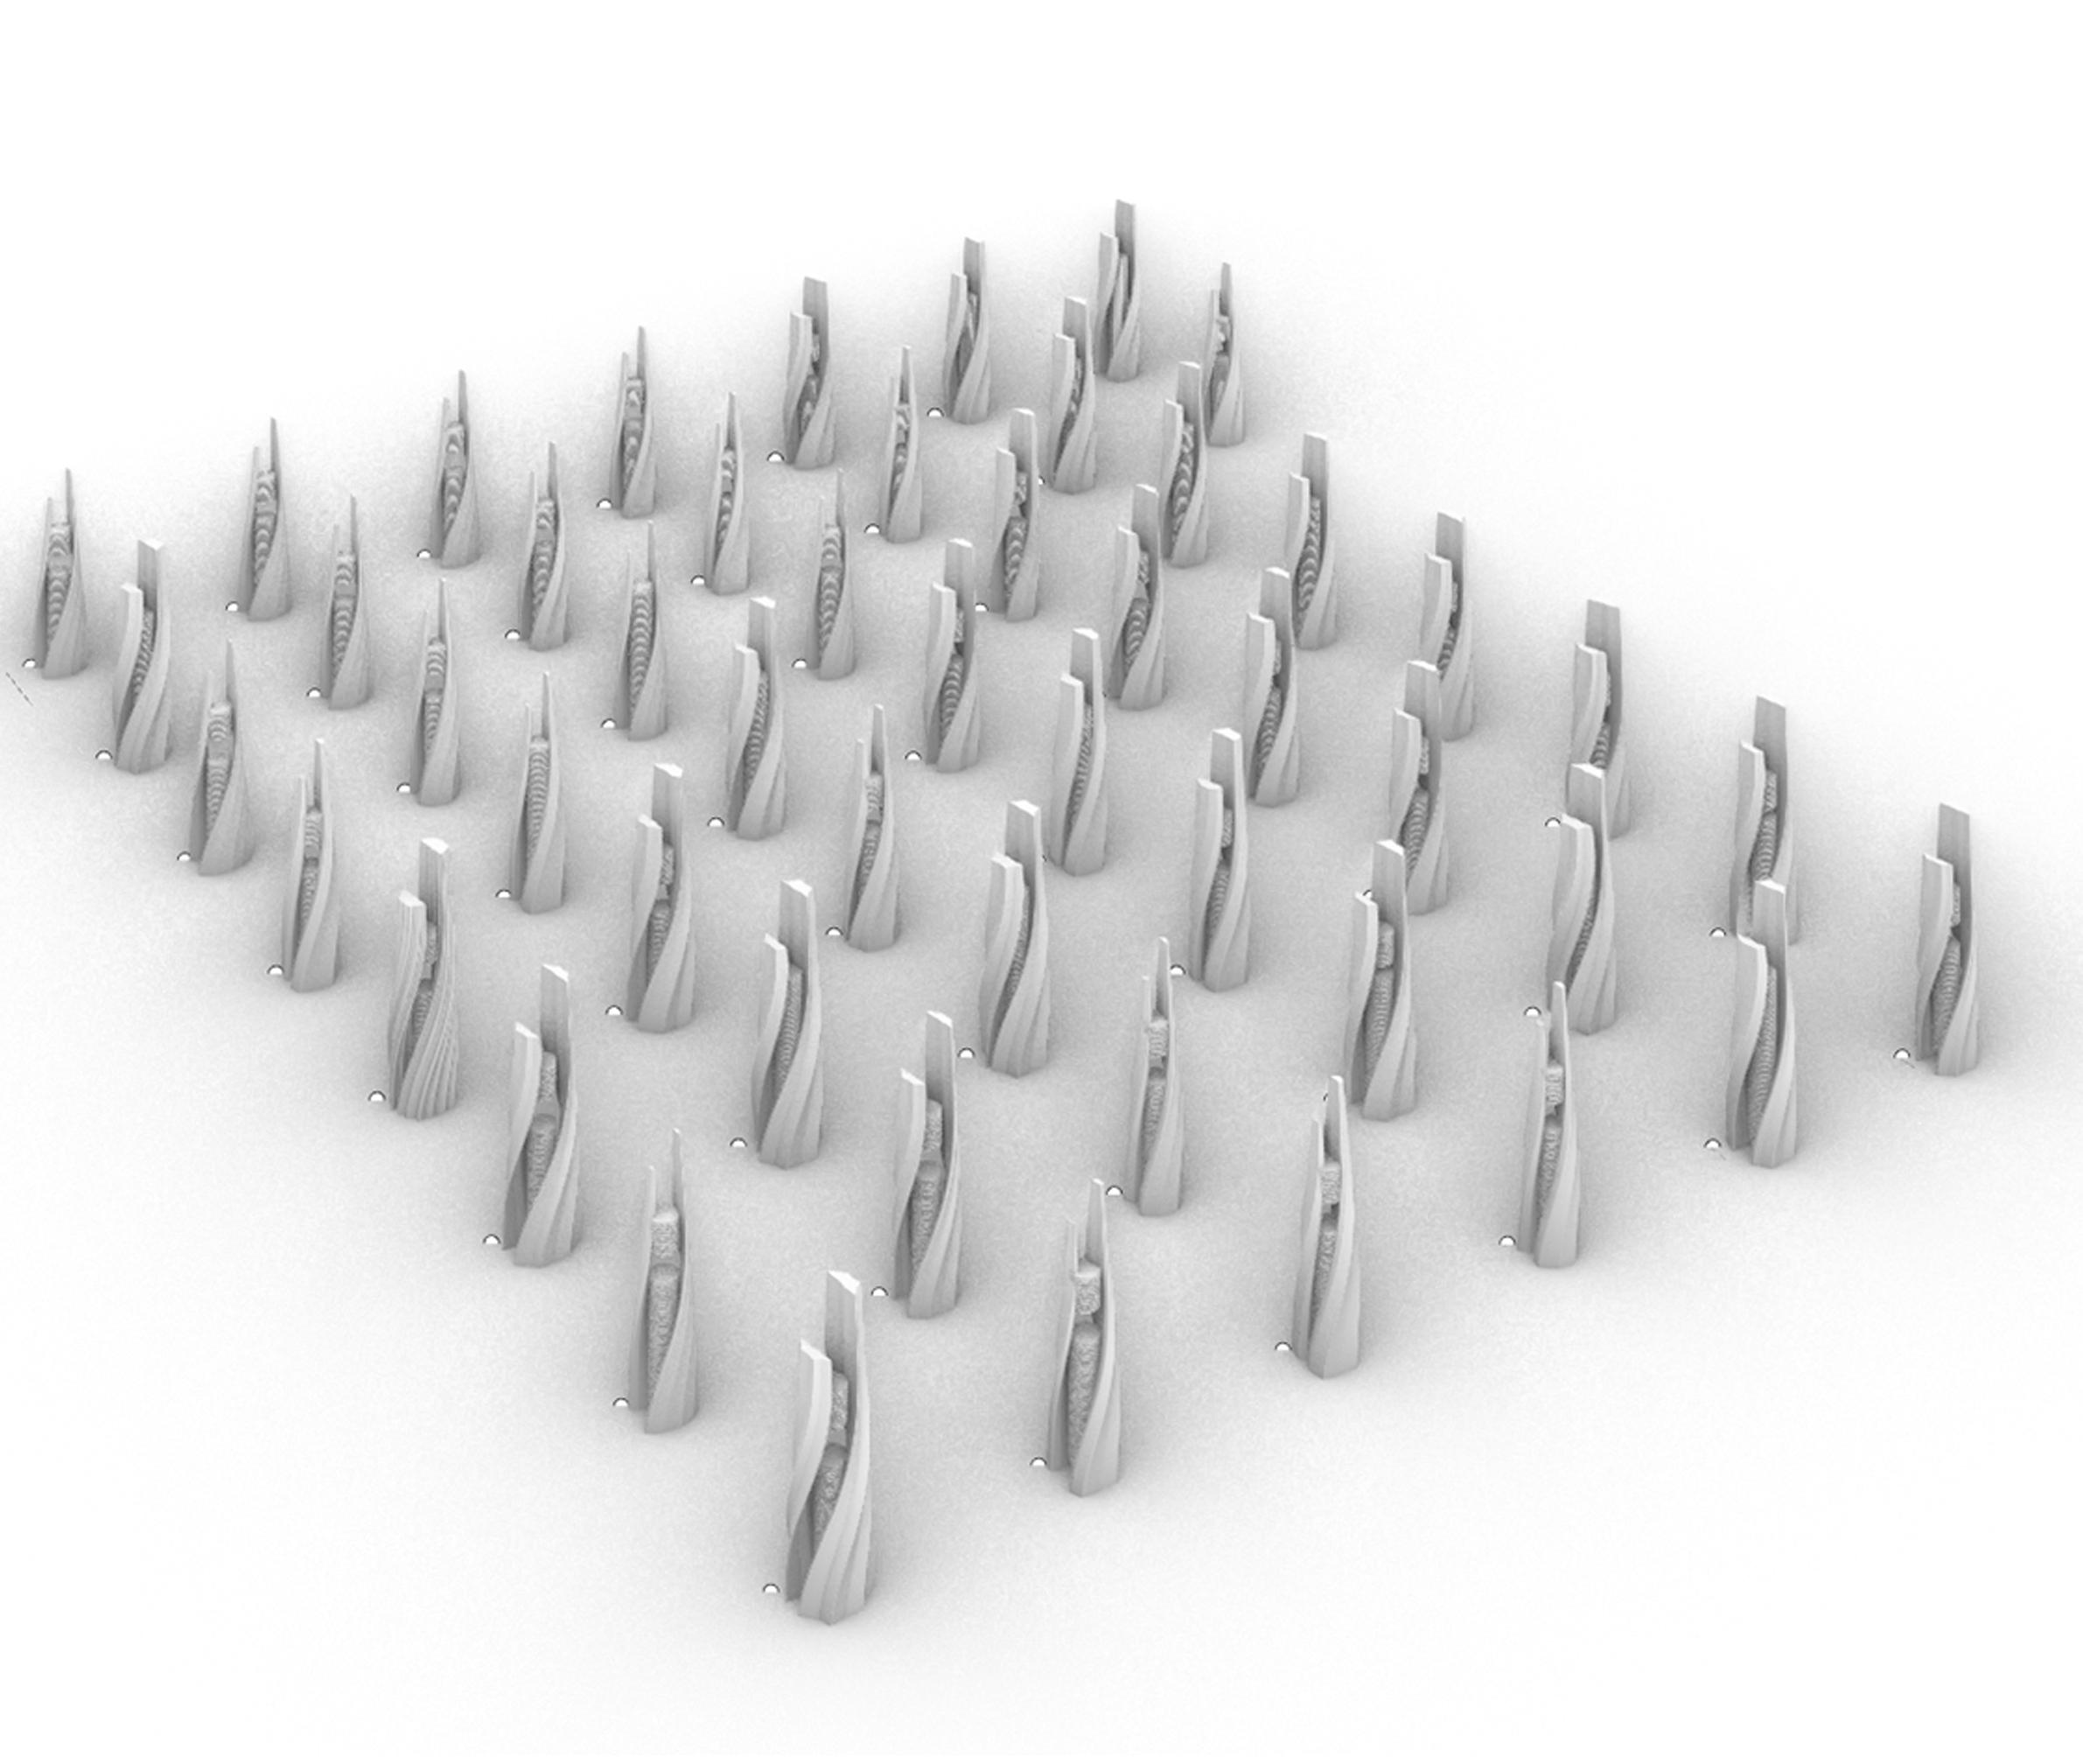 Figure 14 - Diagram representing the generation 60

GENERATION 99
The simulation was analysed for generation 99 (figure 16). As the crossover continued with the similar trend as in the generation 60, towards optimisiation of FC1, FC2, and FC3.(figure 17). One common trend that occurred due to dominance of the last three fitness criterias was tapering as a well defined allometric trait in all the individuals. There were individuals majorly optimised by the increase in floor plate area due to the chromosomes and fitness criteria affecting the same. However, increasing floor plate area induced reduction in the size of the courtyard. Extreme corrugation was almost omitted in order to achieve minimal
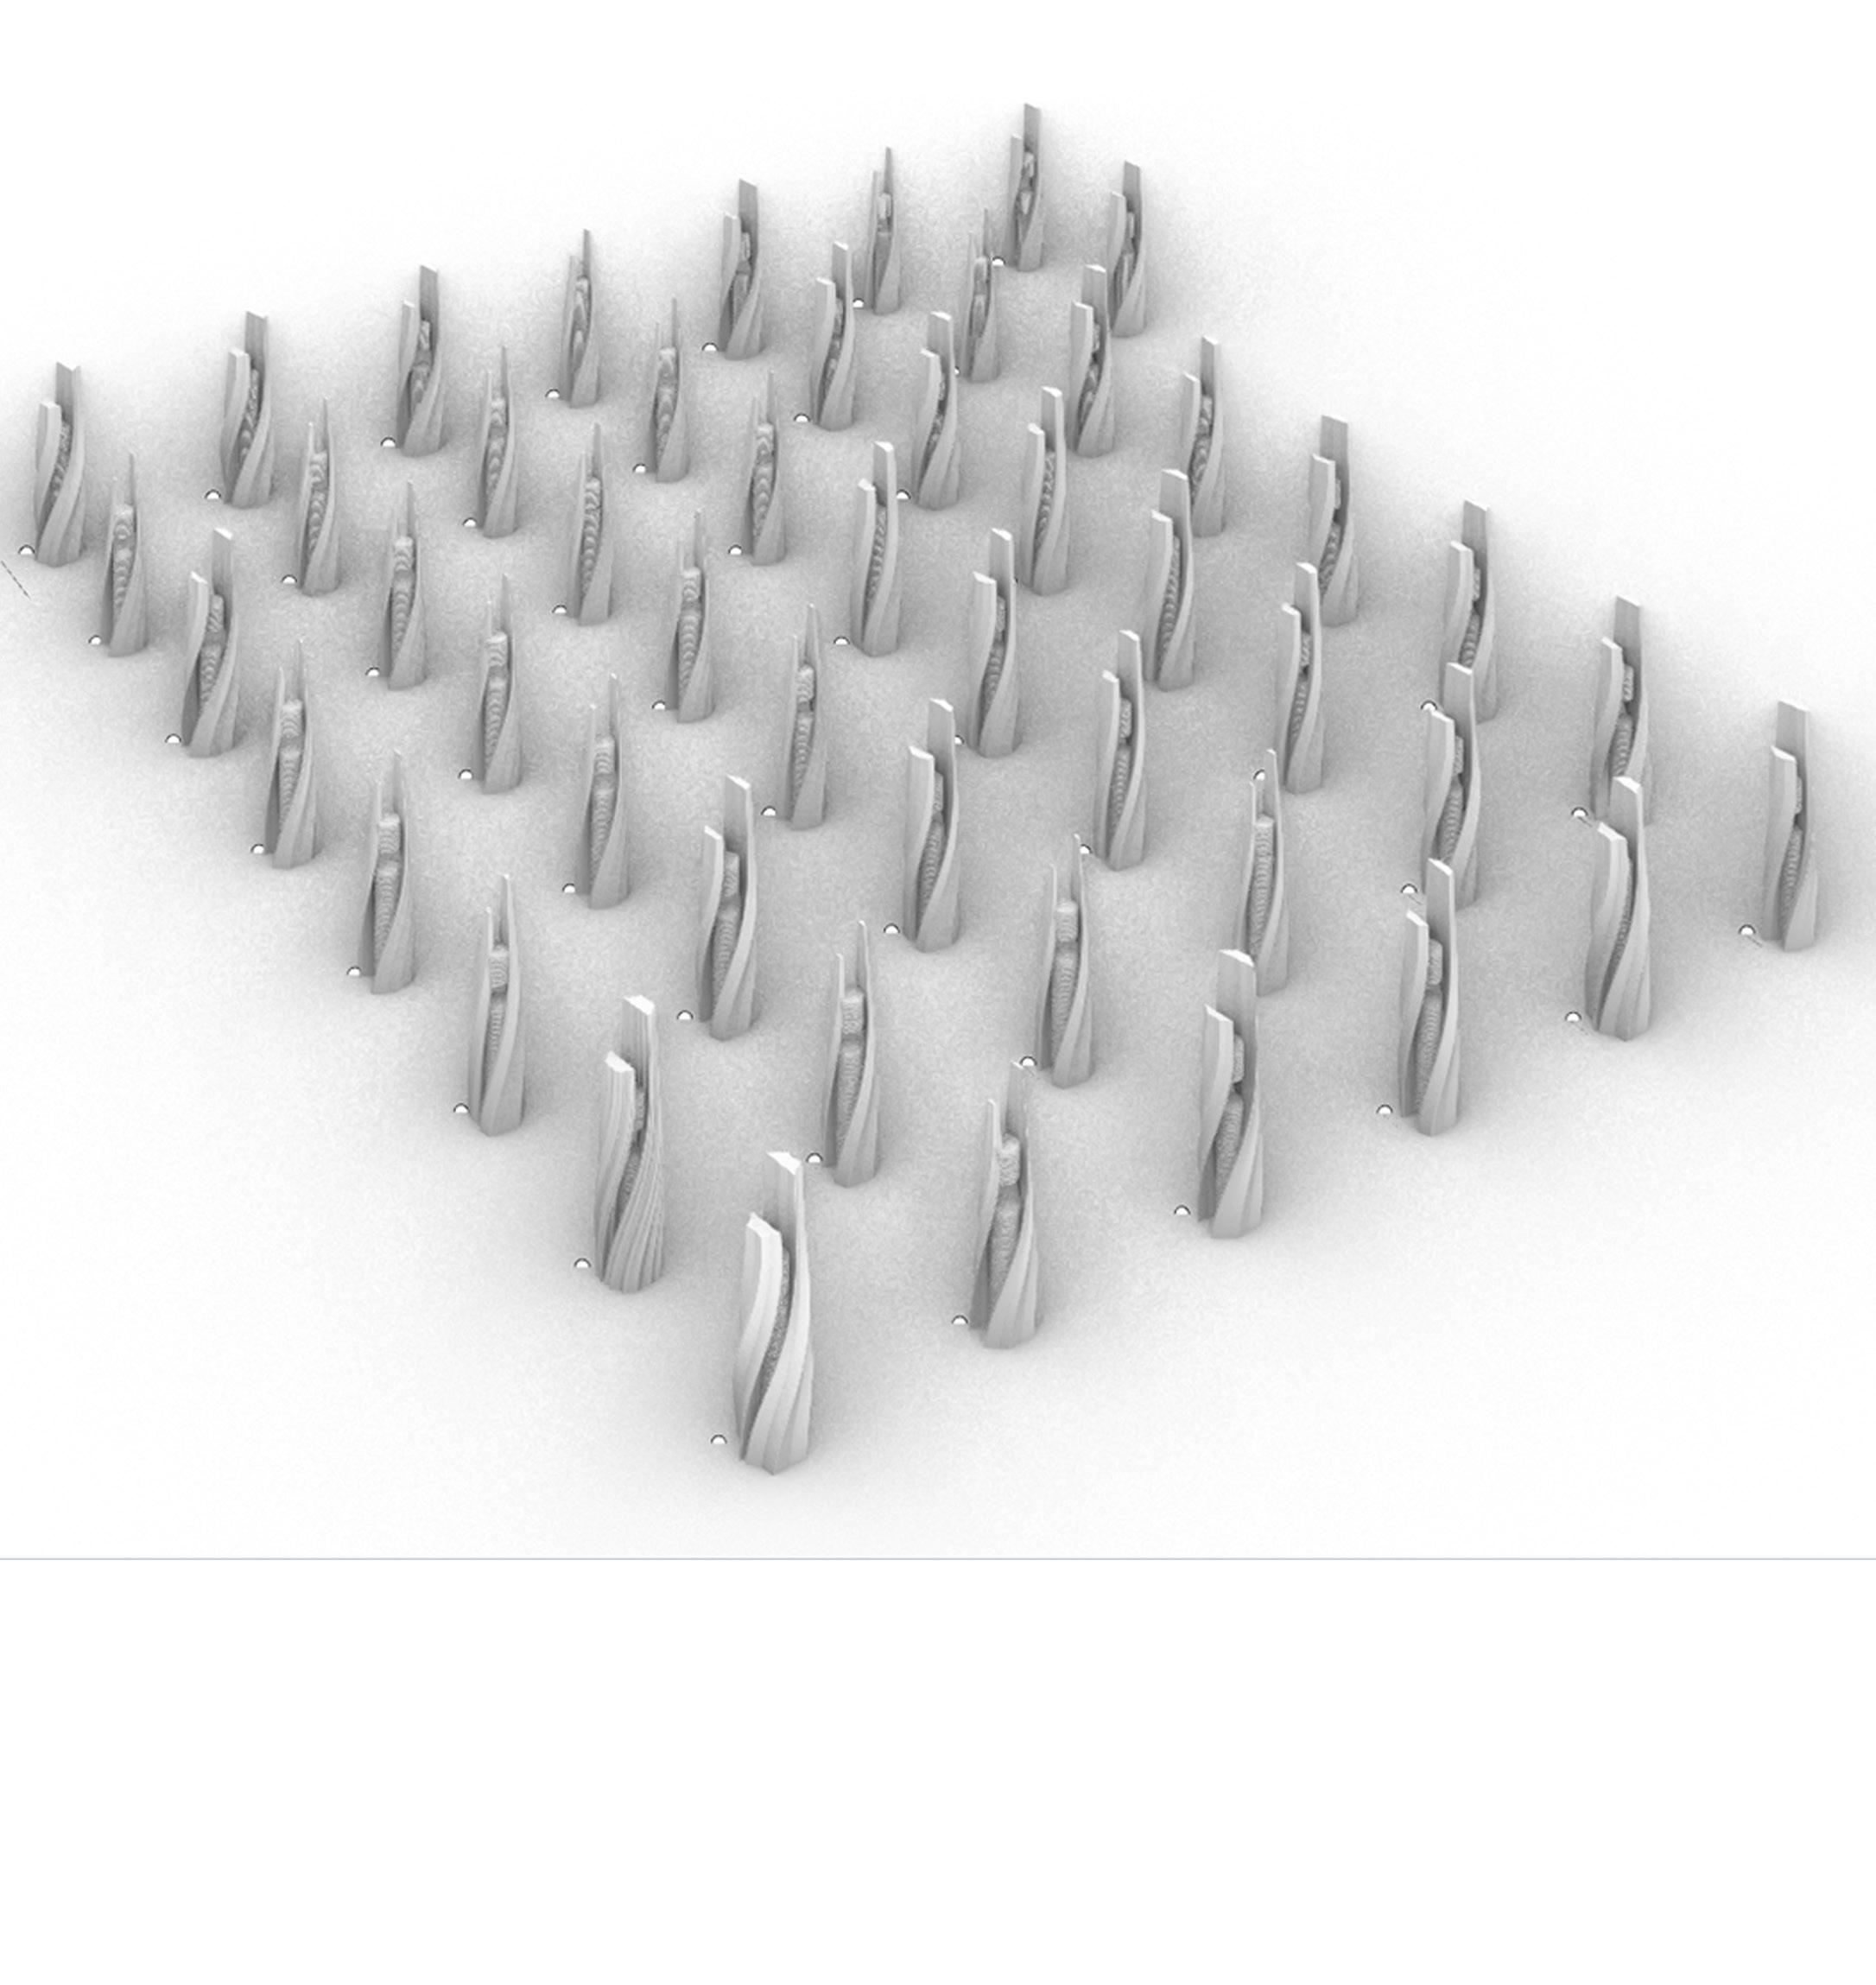 Figure 16 - Diagram representing the generation 99

SIMULATION ANALYSIS
The individual 2 from generation 85 (Figure 18 )optimised for the fitness criteria one that is maximising the floor plate area which was induced by the chromosomes that affected the increase in the floor plate area. Although chromosomes inducing increase in the corrugation, would simulate the increase in the floor plate area. But due to deletion of these chromosomes through the simulation, very less corrugation was obtained. Also it can be verified that this fitness criteria optimised till the last generations as this individual belongs to generation 80.
The individual 2 from generation 99 (Figure 19 )optimised for the fitness criteria two that is minimising shaded region on the ground. This was induced by the chromosomes that controlled tapering of the form, in order to simulate more volumetrically compact forms. Corrugation as a trait was also diminished due to this fitness criteria, as less corrugated form would cast smaller shaded regions on the ground.Also it can be verified that this fitness criteria optimised till the last generations as this individual belongs to generation 99.
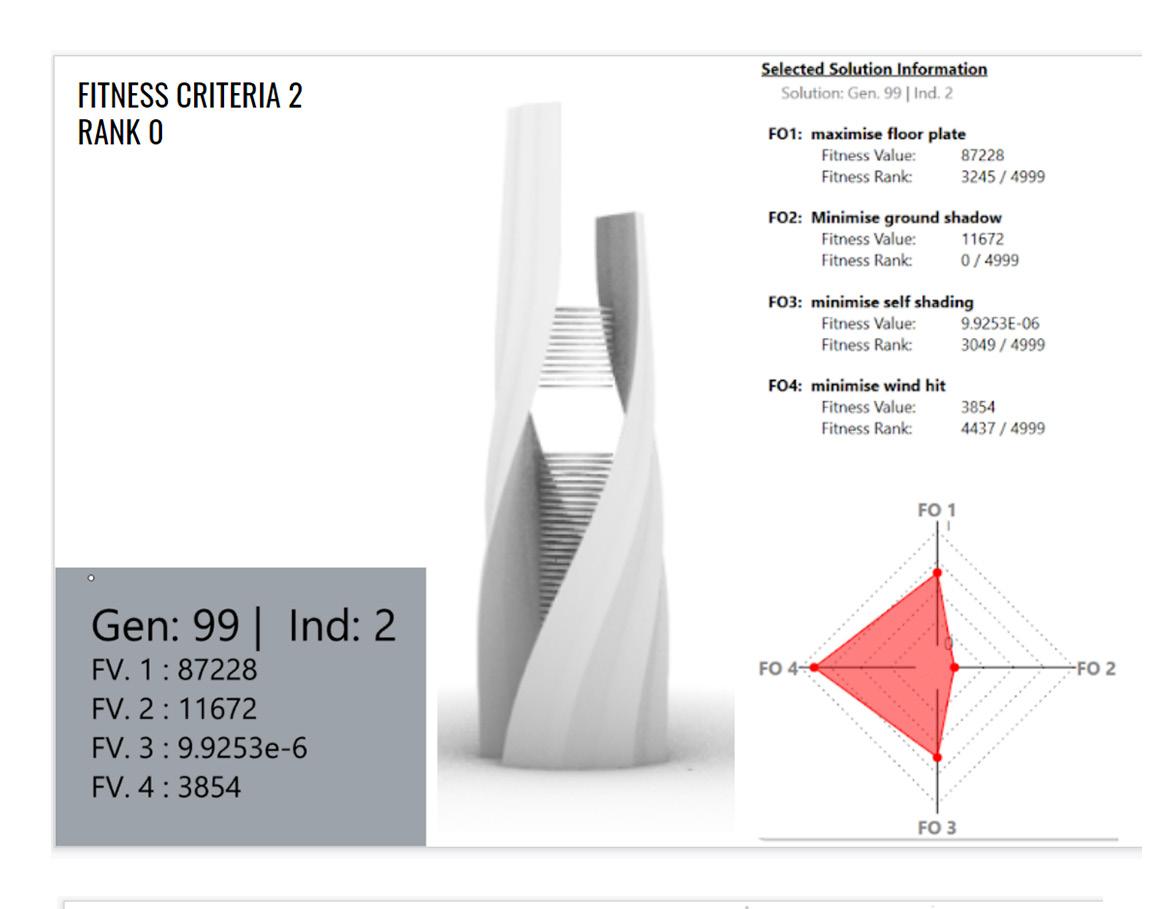
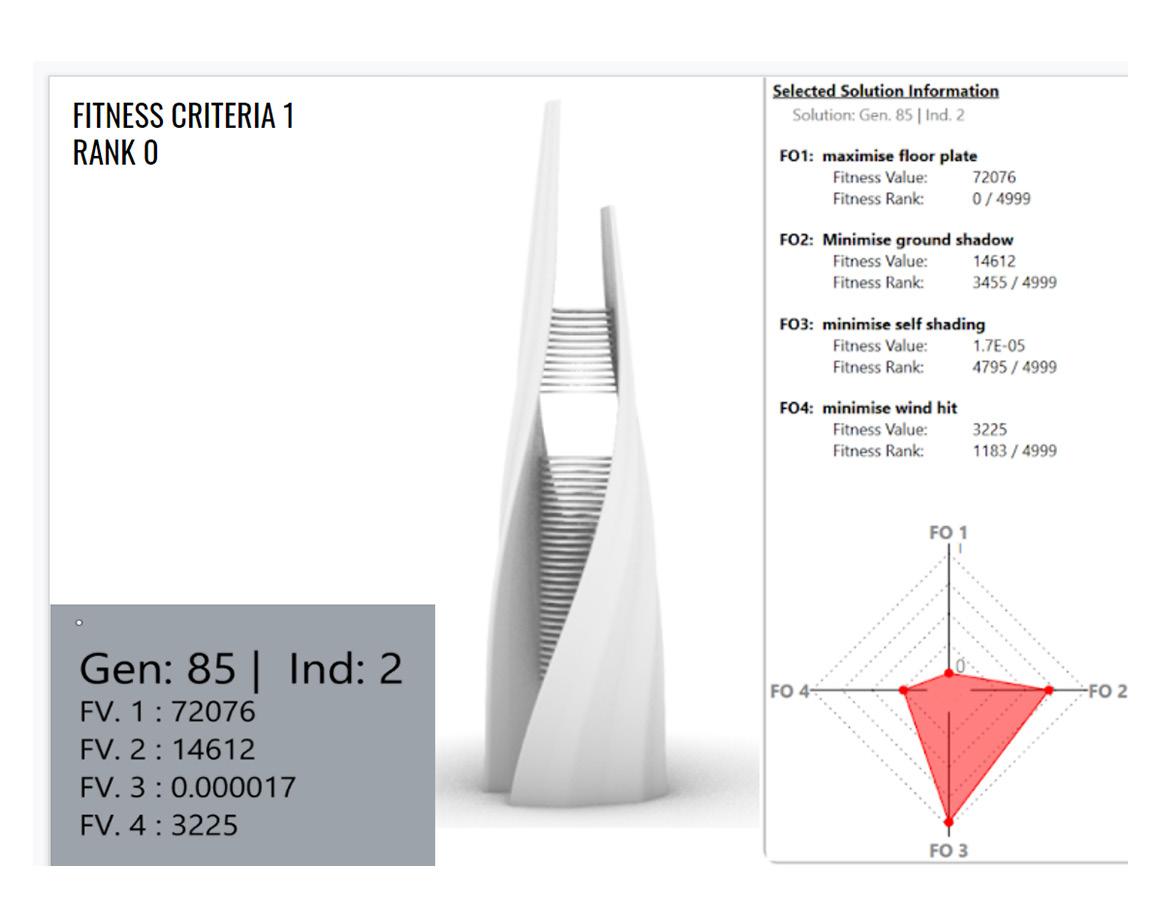 Figure 18 - Diagram representing the individual- FC 1-Rank 0
Figure 19 - Diagram representing the individual- FC 2-Rank 0
SIMULATION ANALYSIS
The individual 2 from generation 80 (Figure 20)optimised for the fitness criteria that is minimising self shading on the surface of the building morphology. The factor inducing self shading is controlled by the tapering and the corrugation of the form. More the corrugation , more the surface area, hence, more exposure to sunlight leading to minimisation of self shade. .Also it can be verified that this fitness criteria optimised till the last generations as this individual belongs to generation 80.
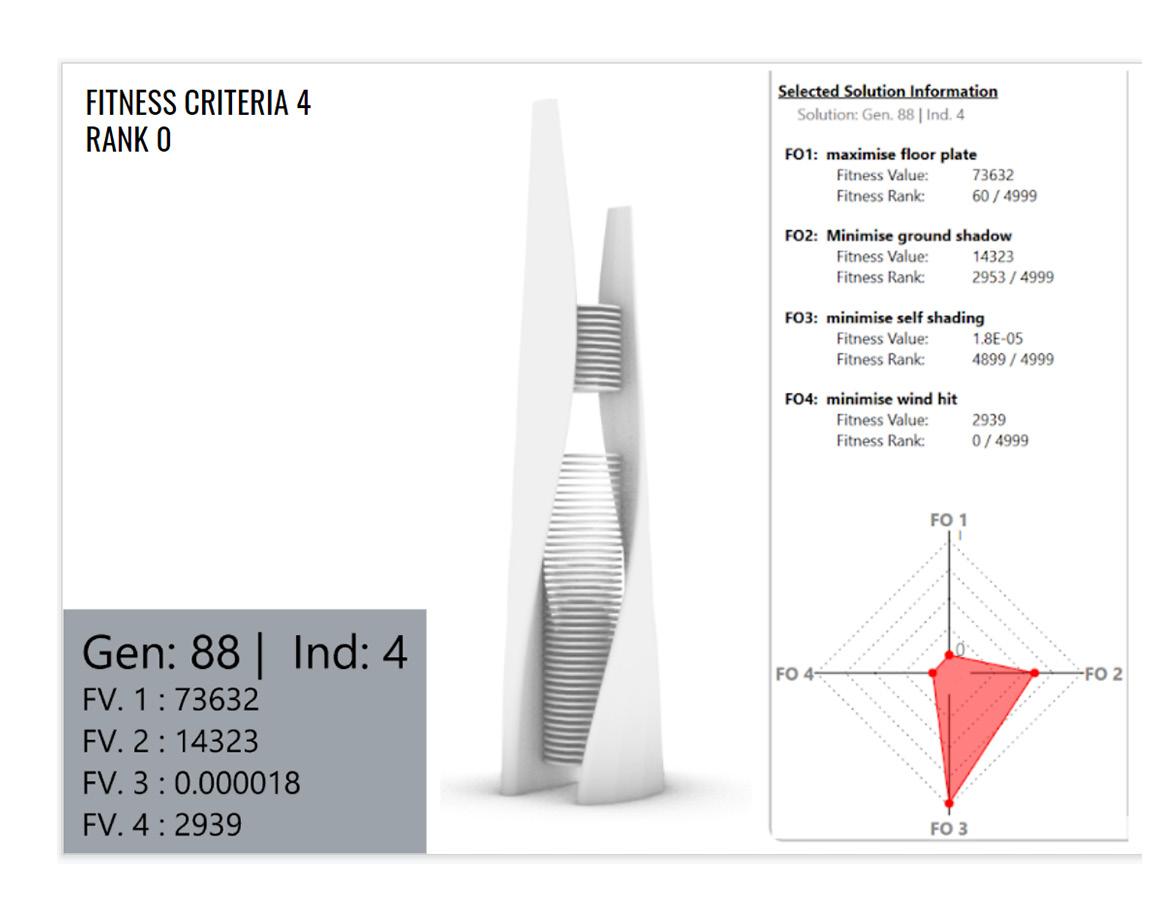
The individual 4 from generation 88 (Figure 21) optimised for the fitness criteria 4 that is minimisation of the wind hit vector. The form had minimal surface area, hence,there was no corrugation pattern observed.The form displayed optimal tapering.And also a larger void in the central floor plates in order to achieve the reduction in the wind influence.
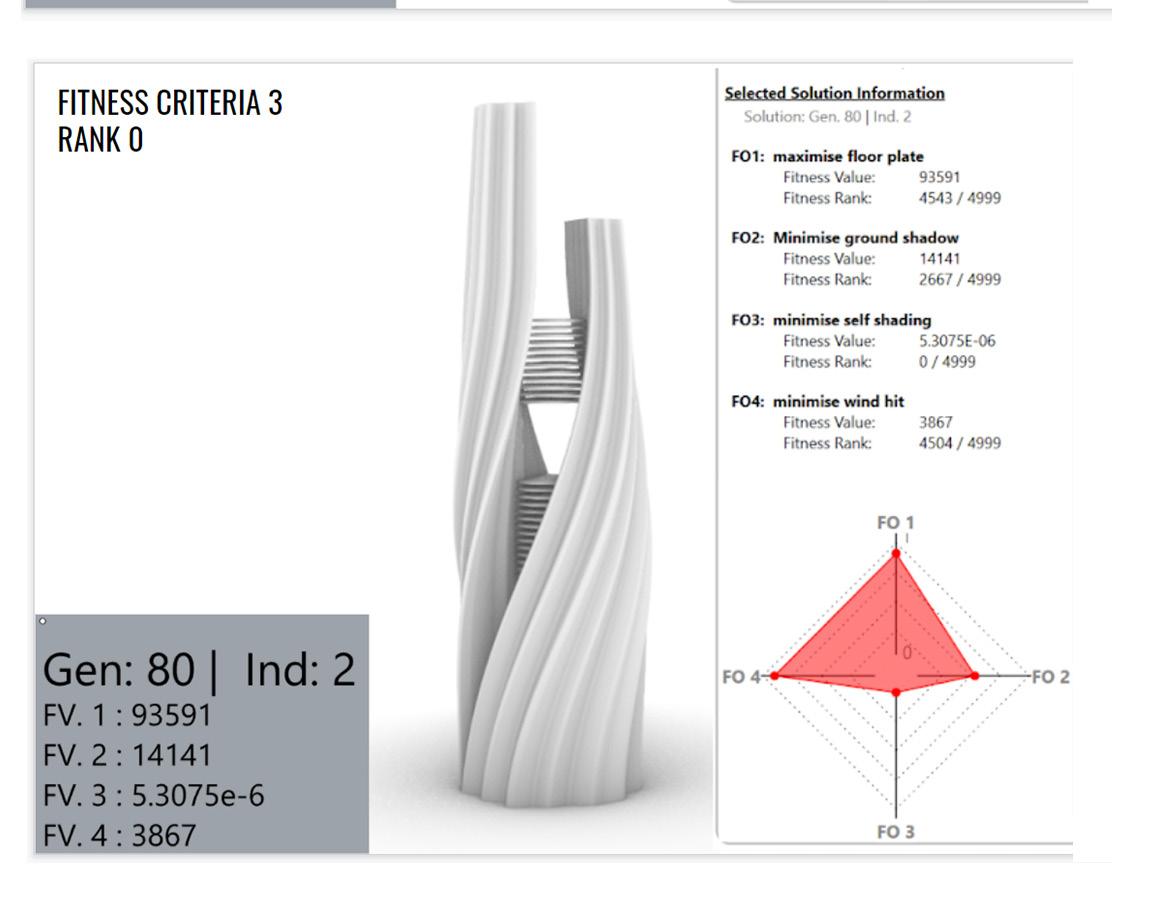 Figure 20 - Diagram representing the individual- FC 3-Rank 0
SIMULATION ANALYSIS
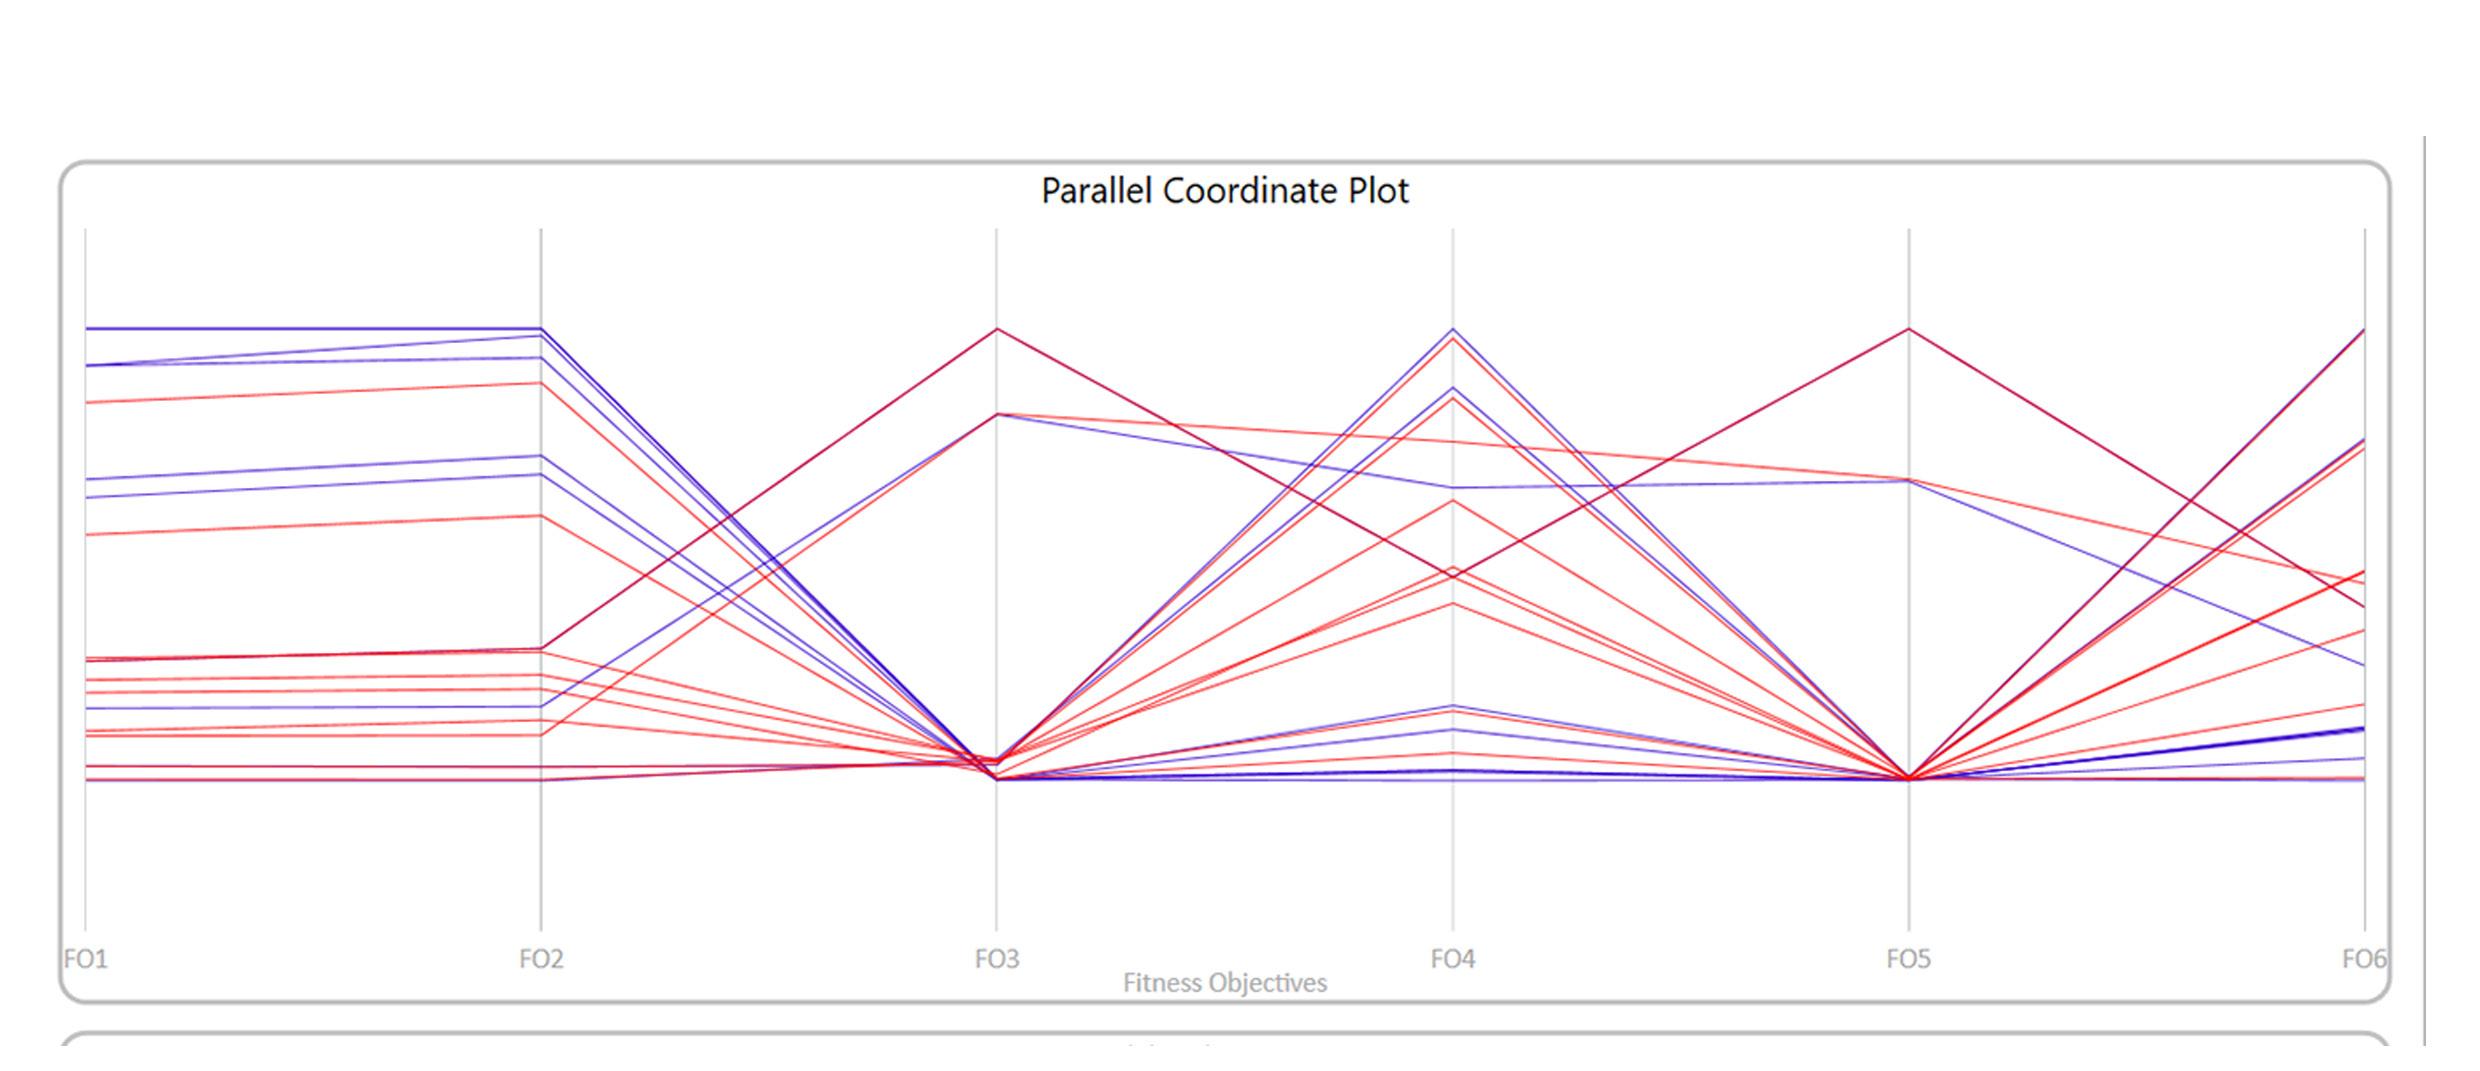
The parallel coordinate plot (figure 22) individual indicates that fitness criterias were contradicting each other in order to generate a more optimised simulation. The floor plates were maximised in the later generations as indicated by blue colour in the PCP. It can be verified that maximisation of floor plates is contradictory to minimising the shaded region on the ground. However there is variation in the genealogy of the pareto front individuals. As some individuals were optimised based on the increase in the floor plate area and corrugation. Whereas others were majorly optimised due to deletion of chromosomes that induced corrugation, as it resulted in minimisation of self shading and the wind vector hits. Fitness criterias 1,2 and 4 optimised efficiently as compared to fitness criteria 3. Although the entire generation 99 was on the pareto front (figure 23) with major allometric traits being - optimised tapering, optimised floor plate area, optimised minimisation of shadow casted on ground. The individuals belonging to the pareto front, displayed similar traits as to the individual 2 from generation 99. figure24,25,26).
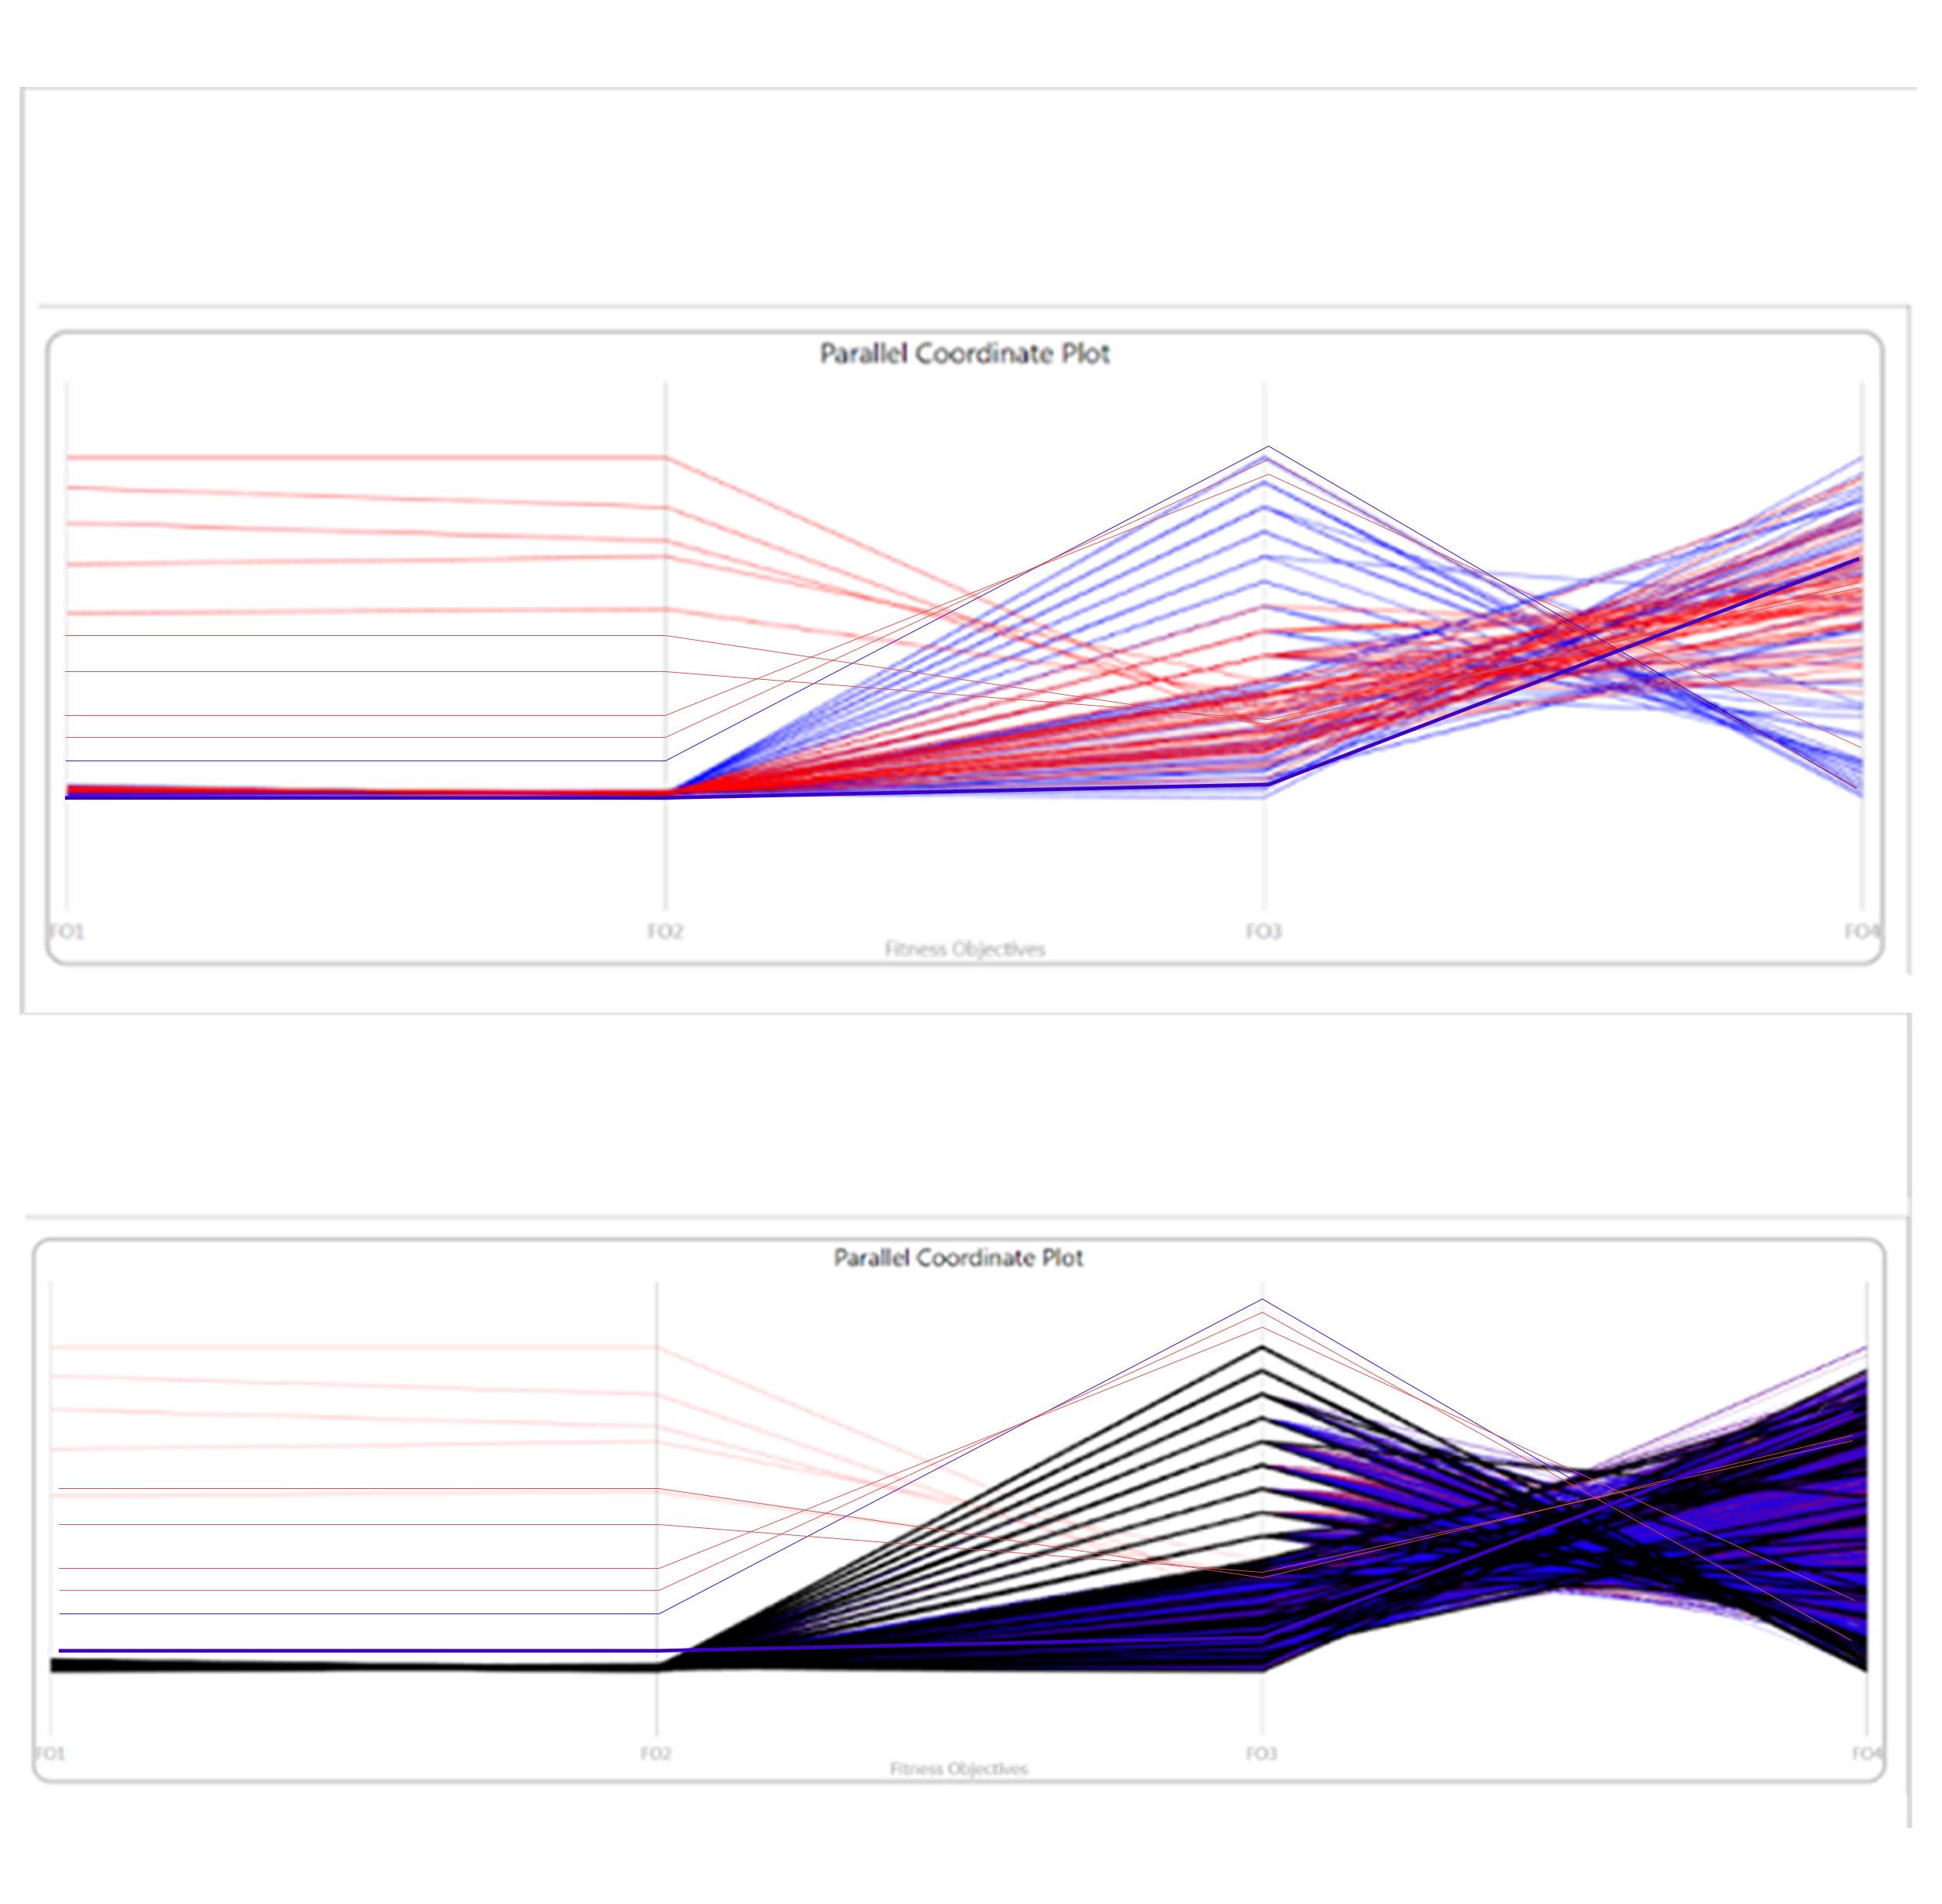 Figure 22 - Diagram representing the parallel coordinate plot
Figure 23 - Diagram representing the pareto front on the parallel coordinate plot
SIMULATION ANALYSIS
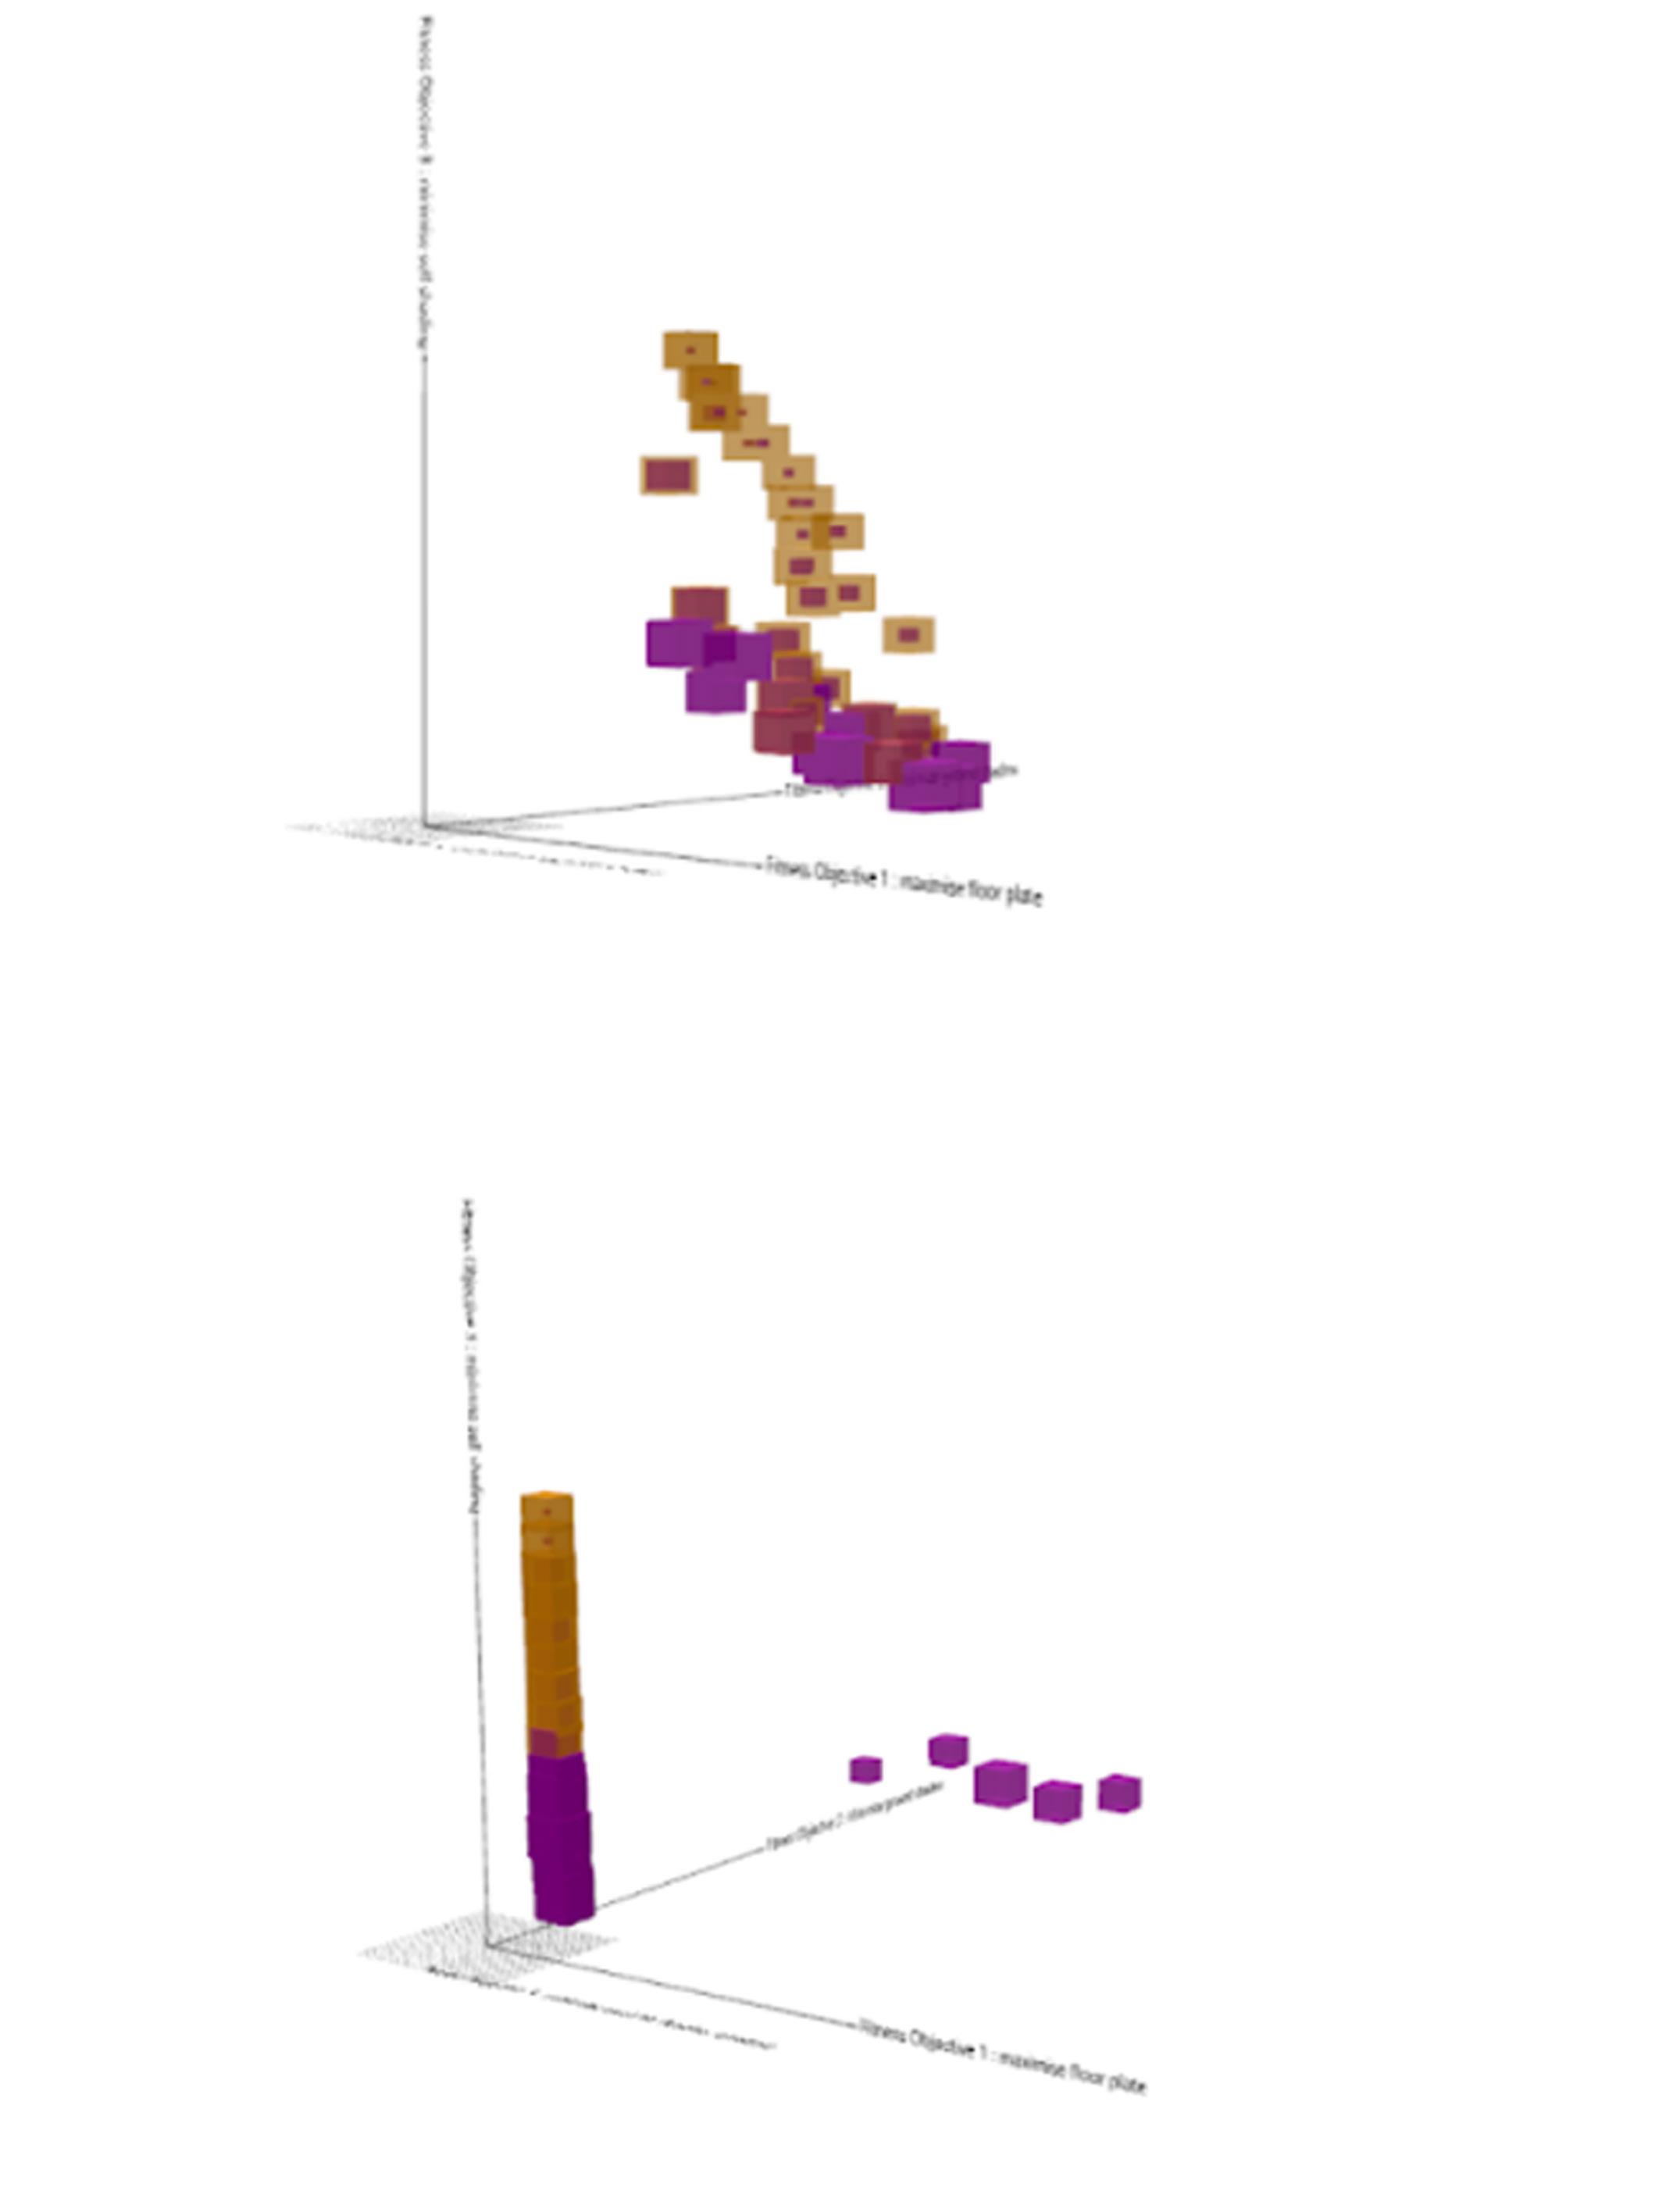 Figure 24 - Diagram representing the pareto front of all the generations
PARETO FRONT INDIVIDUALS
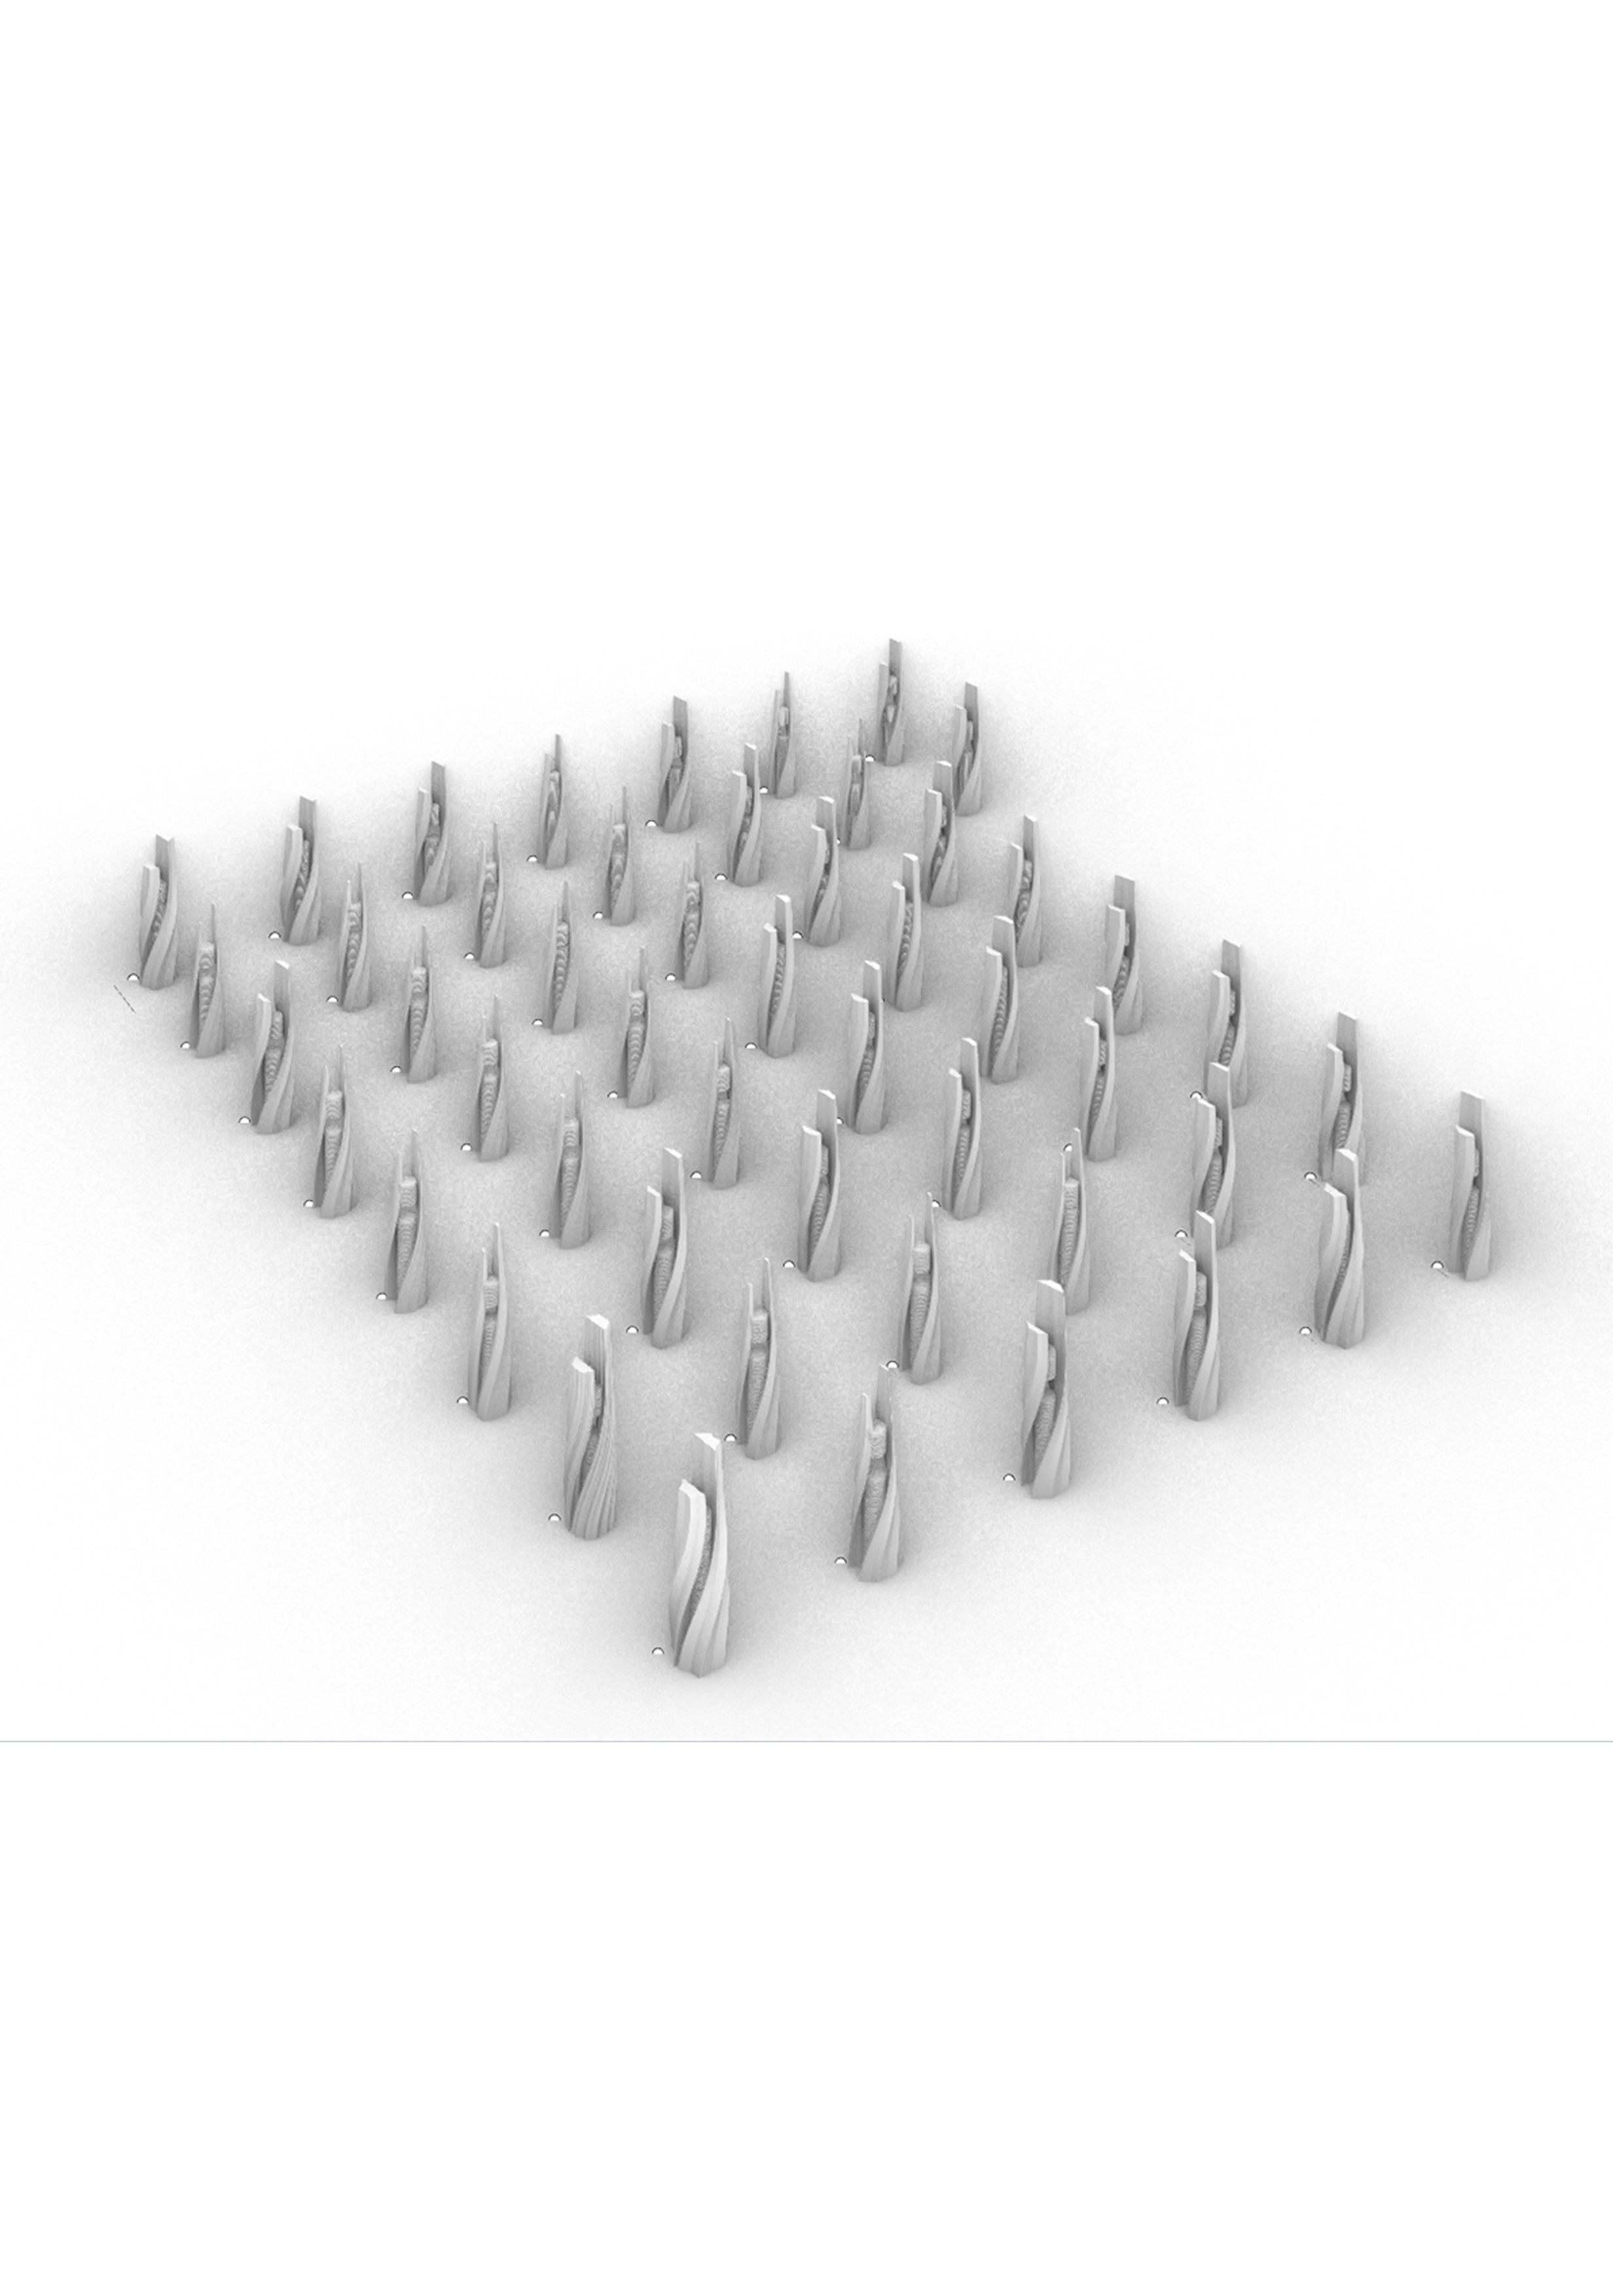 Figure 26- Diagram representing the pareto front individuals -generation 99
The experiment for the multiobjective computational evolution was conducted in two stages. The stage 1 consisted of intensive exercising on the architectural enhancement, and creating a more climate responsive version of the given case study that is the tower - The Shard.This stage dealt with exploration of the morphogenesis of the building morphology independent of any facade system. The aim was to create goals and objectives for desired morphology and brainstorm how to create the phenotype in order to address the defined fitness criterias.The holistic goal of all the experiments was to engage more pedestrian traffic in the site. Hence, creating public concourses through the building morphology on the ground level, maximising floor plate areas and maximising shade cover on ground were common fitness objectives.

In this experiment the building morphology was split in three volumes, in order to create urban corridors. The second goal was creating double courtyards- North Courtyard for extreme summer months, and South Courtyard for extreme winter months. Another goal was to create corrugation on the surface in order to create self shade and allow effective flow of wind to reduce wind impact. The fitness criterias were set up with the goal of minimising self shade, minimising wind hits with the other objectives. After running the simulation it was observed that more corrugation also increased the surface area of the morphology, hence, the self shade and wind vector hits maximised. Hence, the method of calculation had to be revised. Calculating the ratio of wind vector hits to surface area was the new proposed strategy. One major set back of this experiment was limitations in calculating the wind speed around the corrugated building morphology. Another set back was uncontrolled tapering as opposed to the objective of minimising wind influence.Hence, the chromosomes did not adequately correspond to the fitness objectives.
The major challenges faced in conducting the multi objective evolutionary algorithm using the Wallacie engine were defining the accurate relationship between the chromosomes and the fitness criterias that was subjected to trial and error. Another challenge was controlling the domain of the chromosomes in order to generate a desired result. The limitation of this experiment was lack of comparison between the best and worse individuals. However, deletion of corrugation as the set of chromosomes through generation proved that the chromosomes were not impacting the morphology, in the desired sequence. A crucial factor in a multi objective simulation is controlling the influence of one fitness criteria over the other. It was observed from this experiment that similar fitness objectives could be clubbed together in order to reduce the load of the simulation run time. This stage generated a good insight to revise the strategies for the morphology and the facade design.

